
Integrative Biomedical Research

Integrative Biomedical Research (Journal of Angiotherapy) | Online ISSN  3068-6326
463
Citations
1.8m
Views
746
Articles
Your new experience awaits. Try the new design now and help us make it even better
Switch to the new experience
Figures and Tables
REVIEWS   (Open Access)

Mapping the Invisible Architecture of Disease: Spatial Multi-Omics Technologies, Computational Integration, and the Path Toward Clinical Translation

Mohammad Asaduzzaman 1* Lamiah Hossain 2

+ Author Affiliations

Integrative Biomedical Research 10 (1) 1-8 https://doi.org/10.25163/biomedical.10110883

Submitted: 11 December 2025 Revised: 28 January 2026  Published: 10 February 2026 


Abstract

Tissue is not a bag of cells. It is a coordinated, three-dimensional community whose spatial organization shapes development, homeostasis, and disease, yet this organization is destroyed the moment tissue is dissociated for conventional sequencing. Spatial multi-omics has emerged to close that gap, but the field remains fragmented across technologies, computational strategies, and clinical settings that rarely speak to one another. We conducted a structured narrative synthesis of the spatial multi-omics literature (2016-2026), organized around a five-branch conceptual framework spanning molecular hierarchy, next-generation sequencing- and imaging-based platforms, computational fusion architectures, clinical translation, and deployment barriers. Sources were drawn from peer-reviewed journals indexed in PubMed, Scopus, and Web of Science, supplemented by platform-defining primary reports. Ninety-plus sources converged on several consistent patterns. NGS-based platforms (Visium, Visium HD, Stereo-seq, DBiT-seq) trade spatial precision for unbiased transcriptomic breadth, whereas imaging-based platforms (MERFISH, seqFISH+, Xenium, CosMx) achieve subcellular fidelity at the cost of panel size. Intermediate-fusion architectures, particularly graph-neural-network models such as SpatialGlue, SWITCH, and MultiGATE, now outperform early- and late-fusion approaches for preserving native spatial topology. Clinically, spatially resolved immune-proximity and stromal-exclusion scores outperform bulk immunohistochemistry in predicting immunotherapy response, and multi-omic mapping has nominated actionable targets in oncology, cardiology, and nephrology. Persistent barriers include FFPE incompatibility, terabyte-scale computational burden, algorithmic opacity, and a severe European-ancestry bias that erodes polygenic score accuracy by up to 78% in African-ancestry cohorts. Spatial multi-omics is approaching, but has not yet reached, routine clinical deployment; standardized pre-analytical protocols, interpretable AI, and globally representative biobanking are the rate-limiting steps for translation.

Keywords: spatial multi-omics, spatial transcriptomics, tissue microenvironment, data integration, graph neural networks, precision medicine, health equity

1. Introduction

Understanding how cells arrange themselves in space -- and why that arrangement matters -- is, in a sense, one of the oldest questions in medicine dressed up in new molecular clothes. Pathologists have known for well over a century that where a cell sits inside a tissue often says as much about its fate as what genes it carries. What has changed, only recently, is our ability to measure that "where" with the same molecular depth we once reserved for dissociated cell suspensions. Cells, after all, do not function as isolated units; they assemble into elaborate, three-dimensional architectures that coordinate everything from organ development to immune surveillance (Wu et al., 2026). The spatial arrangement of genetically and phenotypically distinct subpopulations within their native microenvironment shapes developmental lineages, physiological homeostasis, and -- when things go wrong -- pathological trajectories (Cen et al., 2026). Bulk transcriptomic and proteomic profiling, for all the precision-medicine progress it has enabled, was never built to see this. By averaging signals across dissociated tissue, it necessarily discards the very heterogeneity that gives a tumor its resilience or a failing heart its patchwork of injury and repair (Arora, 2025; Sahu et al., 2026).

Single-cell RNA sequencing (scRNA-seq) was, for a time, the field's best answer to this problem. It gave researchers an unprecedented view of cellular diversity, lineage dynamics, and rare cell populations that bulk methods had simply averaged away (Chen et al., 2023; Sahu et al., 2026). And yet -- and this is easy to forget amid the enthusiasm -- scRNA-seq still requires tissue dissociation. Enzymatic digestion into a single-cell suspension is, almost by definition, an act of spatial erasure: physical cell-to-cell contacts, local signaling gradients, and the broader tissue neighborhood are gone the moment the sample hits the dissociation buffer (Palaganas et al., 2026; Wu et al., 2022). What is lost in that process is not trivial. Localized biochemical gradients, signaling niches, and multicellular neighborhoods are increasingly understood to be causal drivers of cancer progression, neurodegeneration, and cardiovascular disease, not incidental byproducts of it (Arora, 2025; Gong et al., 2024; Kiessling & Kuppe, 2024). Bridging the gap between molecular profiling and tissue histology has therefore become something of a unifying ambition across the life sciences -- less a niche subfield than a shared destination (Shanmugam & Ravikumar, 2026; Wang & Fan, 2021).

Spatial omics technologies were developed, at their core, to preserve that architecture while still measuring molecular features in situ (Lee et al., 2025). The field's modern trajectory can be traced fairly directly to Ståhl et al. (2016), whose array-based in situ RNA capture method laid the technical groundwork for commercial platforms like 10x Genomics Visium (Kiessling & Kuppe, 2024). What followed was rapid branching. Spatial mono-omics technologies split broadly into next-generation sequencing (NGS)-based and imaging-based approaches (Wu et al., 2026). NGS-based platforms -- Visium, Slide-seq, and Stereo-seq (Spatio-Temporal Enhanced REsolution Omics-sequencing) among them -- rely on spatially barcoded capture probes to pull transcripts directly from tissue sections (Lee et al., 2025). Imaging-based techniques take a different route entirely: MERFISH (multiplexed error-robust fluorescence in situ hybridization) and seqFISH+ use iterative cycles of fluorescent labeling to resolve individual transcript molecules at subcellular resolution (Cen et al., 2026).

Useful as spatial transcriptomics has proven, it only tells part of the story. Transcript abundance, it turns out, correlates rather imperfectly with functional protein output, epigenetic state, or downstream metabolic activity -- a gap that single-layer profiling simply cannot close (Cen et al., 2026; Lee et al., 2025). This limitation is what has pushed the field, somewhat inevitably, toward spatial multi-omics: the simultaneous measurement of several biomolecular layers within the same tissue section, which has the added benefit of avoiding the batch effects that plague separately processed samples (Liu et al., 2024; Sahu et al., 2026). Deterministic barcoding in tissue (DBiT-seq), for instance, uses perpendicular microfluidic channels to co-map whole transcriptomes and proteomes on a single slide (Liu et al., 2020), while spatial ATAC-RNA-seq and spatial CUT&Tag-RNA-seq extend this logic to capture transcriptomic and epigenetic landscapes together (Liu et al., 2024). Mass spectrometry-based approaches such as MALDI-MSI (Matrix-Assisted Laser Desorption/Ionization Mass Spectrometry Imaging) round out the picture further still, visualizing small-molecule metabolites and drugs directly in spatial coordinates (Palaganas et al., 2026).

None of this experimental progress, however, has been matched -- at least not yet -- by an equivalent leap in our ability to make sense of the data it produces. That, arguably, is the field's real bottleneck now (Liu et al., 2024). Multi-modal spatial datasets are high-dimensional, non-linear, riddled with missing features, and burdened by platform-specific noise (Cen et al., 2026; Sahu et al., 2026). Integrating them requires computational strategies capable of horizontal (cross-sample), vertical (same-cell), or diagonal (disjoint cells and features) alignment (Kiessling & Kuppe, 2024). Late-integration methods, which analyze each modality independently before merging results, tend to miss the inter-omic regulatory relationships that matter most (Sahu et al., 2026) -- which is part of why intermediate and early integration frameworks, including graph neural networks, variational autoencoders (totalVI, SWITCH among them), and joint latent-space models, have drawn so much recent attention; they are, at least in principle, better suited to learning shared low-dimensional representations without abandoning spatial topography altogether (Cen et al., 2026; Palaganas et al., 2026).

And then there is the clinic, which imposes its own, rather unforgiving, constraints. Moving spatial multi-omics from the research bench into standard practice runs into pre-analytical, analytical, and operational hurdles that are easy to underestimate (Du & Yang, 2025). Current assays remain expensive, low-throughput, and often incompatible with routine sample handling (Wu et al., 2026). Many ultra-high-resolution imaging platforms demand fresh-frozen tissue, which puts them at odds with the formalin-fixed paraffin-embedded (FFPE) archives that most pathology departments actually rely on -- though newer methods such as patho-DBiT and spatial CITE-seq are beginning to chip away at this incompatibility (Wu et al., 2026). Compounding this, the absence of standardized operating procedures, validated inter-laboratory reproducibility, and clinically actionable interpretive thresholds continues to limit how spatial biomarkers are used in real-world patient stratification and trial design (Du & Yang, 2025; Mohr et al., 2024). Closing these gaps is, we would argue, the difference between spatial multi-omics remaining an elegant research curiosity and becoming a genuine companion diagnostic.

To address these scientific, computational, and clinical roadblocks, this work is organized around three guiding questions: (1) how do spatial gradients of epigenetic remodeling and transcriptional activity around pathological lesions -- amyloid-beta plaques in Alzheimer's disease, or hypoxic zones in solid tumors -- dictate localized cellular vulnerability, metabolic zonation, and functional decline; (2) can geometric deep learning architectures and multimodal foundation models reliably perform diagonal data integration and cross-modal imputation across spatial transcriptomics, proteomics, and metabolomics datasets without introducing artifact bias or oversmoothing biologically meaningful microdomains; and (3) what standardized pre-analytical protocols must be established so that spatial multi-omics biomarkers extracted from FFPE clinical cohorts achieve greater than 90% technical reproducibility across multiple centers.

Guided by these questions, this study pursues four objectives: to synthesize the published evidence on spatial co-localization of chromatin accessibility, mRNA transcripts, and protein abundance across healthy and pathological tissue, as reported using spatial CITE-seq and spatial ATAC-RNA-seq frameworks; to propose and specify, as a reproducible computational protocol, an interpretable graph-attention-network architecture for fusing spatial transcriptomic and metabolomic data from consecutive tissue sections, without generating de novo empirical validation, which falls outside the scope of this literature-grounded synthesis; to evaluate, from the published record, the predictive and prognostic utility reported for spatially resolved multi-omic biomarkers — including immune-cell proximity scores and stromal-exclusion indices — in patient stratification and therapy-response prediction; and to outline the design requirements for a standardized, open-access, cloud-native bioinformatic pipeline that could automate preprocessing, spatial domain identification, and cell-cell communication modeling, in service of the broader goal of democratizing clinical access to spatial multi-omics.
2. Spatial Multi-Omics and Integrative Systems Biology in Precision Medicine

Modern clinical practice is, slowly but unmistakably, shifting away from clinical-pathological classification and toward data-driven, systems-level molecular mapping. Single-cell sequencing catalogued cellular heterogeneity down to nucleotide resolution, which was a genuine achievement -- but it did so by dissociating cells from their native coordinates, which meant the physical neighborhoods and signaling niches that actually govern disease biology were lost in the process. Spatial multi-omics exists, in large part, to recover what that dissociation destroyed: the simultaneous profiling of genomes, epigenomes, transcriptomes, proteomes, and metabolomes within intact tissue architecture. This review is organized around five interlocking themes -- the molecular hierarchy itself, the sequencing and imaging technologies used to measure it, the computational strategies used to fuse it, its emerging clinical applications, and the barriers still standing between bench and bedside.

2.1 From Siloed Bulk Analysis to Deep Multi-Omic Profiles: A Paradigm in Motion

For decades, clinical diagnostics leaned heavily on morphology and bulk molecular readouts -- signals averaged across dissociated tissue that, while useful, tended to mask rare cell types and localized niches almost by design (Arora, 2025; Sahu et al., 2026). Bulk genomics and transcriptomics were good at identifying driver mutations and diagnostic markers, certainly, but they were never built to resolve the contribution of a small, spatially confined population of cells (Shanmugam & Ravikumar, 2026). Single-cell RNA sequencing changed the resolution of the conversation considerably, offering molecular profiles of individual cells rather than tissue averages (Paik et al., 2020). Yet the isolation protocols it depends on -- enzymatic digestion or mechanical dissociation into suspension -- come at a cost that is easy to overlook: the complete, irreversible loss of native spatial context (Palaganas et al., 2026; Wu et al., 2022).

Tissues, it is worth remembering, are not random cell suspensions. They are structured three-dimensional communities in which cell-to-cell communication, extracellular matrix (ECM) barriers, and localized stress gradients jointly determine functional phenotype and drug sensitivity (Gong et al., 2024; Wu et al., 2026). Spatial omics emerged specifically to resolve these relationships (Dai et al., 2024), and over roughly a decade it has progressed from multicellular, spot-level measurements toward genuinely subcellular resolution -- giving rise to what is now termed spatial multi-omics (SMO) (Cen et al., 2026). By measuring several biomolecular layers within the same intact tissue slice, SMO lets researchers watch, almost directly, how genomic variation and epigenetic state are physically translated into functional protein output and downstream metabolic activity (Liu et al., 2024; Zehra et al., 2026).

2.2 The Multi-Layered Molecular Hierarchy and Systems Interconnectivity

Reconstructing cellular behavior in any complex system requires tracing the biological flow of the central dogma across several interdependent molecular strata (Jiang et al., 2025). Each layer, in a sense, tells a different chapter of the same story (Radha & Marda, 2025). The genome serves as the static blueprint -- single nucleotide polymorphisms, copy number variations, and structural alterations that shape disease susceptibility and drug metabolism (Mohr et al., 2024). The epigenome governs which parts of that blueprint are actually read, through DNA methylation, histone modification, and chromatin conformation that bridge genetic inheritance with environmental exposure (Alemu et al., 2025). The transcriptome and translatome capture the cell's momentary "action plan" -- gene expression, splice isoforms, non-coding RNAs, and actively translating mRNAs that reveal transient functional states (Liu et al., 2024). The proteome, meanwhile, represents the actual functional machinery, diverging from transcript abundance because of post-translational modification and protein turnover (Cen et al., 2026; Lee et al., 2025). And the metabolome and lipidome provide something closer to a real-time physiological readout -- downstream metabolic pathways, lipid flux, and biochemical adaptation associated with disease progression (Srivastava & Singh, 2024).

What makes integrating these layers worthwhile is not just completeness for its own sake; it is that doing so reveals regulatory relationships invisible to any single modality. In treatment-resistant cancers, for example, pro-inflammatory genes can appear transcriptionally upregulated while epigenomic profiling simultaneously shows closed chromatin at those very loci -- a pattern suggesting transcriptional priming rather than active translation (Fimmu et al., 2026). Tracing connections of this kind allows systems medicine to separate primary disease drivers from secondary, reactive adaptation (Zehra et al., 2026).

2.3 High-Resolution Single-Cell and Spatial Profiling Technologies

The experimental engines behind spatial multi-omics split broadly into next-generation sequencing (NGS)-based and imaging-based technologies, each embodying a different set of biophysical trade-offs (Wu et al., 2026) (see Table 1).

2.3.1 NGS-Based Spatial Multi-Omics

NGS-based methods capture transcripts locally onto DNA-barcoded surfaces. The commercialized 10x Genomics Visium platform, arguably still the field's most widely adopted entry point, profiles tissue on arrays of 55-µm spots -- each of which, inevitably, averages signal across roughly 10 to 100 cells (Kiessling & Kuppe, 2024; McKellar et al., 2023). Visium HD narrows this considerably with 2-µm binned barcoding, while Stereo-seq (Spatio-Temporal Enhanced REsolution Omics-sequencing) uses DNA nanoball arrays to reach nanoscale, subcellular capture resolution -- around 0.5 µm -- across centimeter-scale tissue areas (Chen et al., 2022; Lee et al., 2025). Deterministic barcoding in tissue (DBiT-seq) takes a rather different engineering approach, using orthogonal microfluidic channels to deliver distinct DNA barcodes sequentially onto tissue, enabling co-mapping of whole-transcriptome RNA alongside targeted proteins via oligonucleotide-conjugated antibodies, at single-cell scale (Liu et al., 2020). This same microfluidic logic has since been extended to chromatin accessibility (spatial ATAC-seq) and histone modifications (spatial CUT&Tag-seq) run alongside mRNA transcripts, revealing epigenetic-transcriptional coupling in situ (Deng et al., 2022; Liu et al., 2024).

2.3.2 Imaging-Based and Mass Spectrometry Platforms

Imaging-based methods take the opposite strategy, using high-resolution fluorescence microscopy to visualize target molecules directly in situ. MERFISH (Multiplexed Error-Robust Fluorescence In Situ Hybridization) and seqFISH+ rely on temporal barcoding and cyclic hybridization to localize thousands of RNA species at subcellular resolution within intact tissue volumes (Moffitt et al., 2022). Imaging mass cytometry (IMC) and multiplexed ion beam imaging (MIBI) stain tissue with metal-isotope-labeled antibodies and use laser or ion-beam ablation coupled to mass spectrometry detection to map as many as 40 proteins simultaneously at single-cell resolution (Lewis et al., 2021). Mass spectrometry imaging techniques -- MALDI-MSI and DESI-MSI among them -- add a further, label-free dimension, enabling highly multiplexed spatial detection of small-molecule metabolites, lipids, and pharmaceutical compounds, and have meaningfully reshaped our understanding of tissue metabolic zonation (Palaganas et al., 2026).

2.4 Computational Topologies and AI-Driven Data Fusion

If the experimental side of spatial multi-omics has moved quickly, the computational side has, if anything, had to move faster just to keep up. The high dimensionality, sparsity, and platform-specific noise of multi-modal spatial datasets make clinical translation a genuine bottleneck (Cen et al., 2026), and informatics strategies have evolved along three broad integration stages (see Table 2).

2.4.1 Integration Topologies

Early integration concatenates normalized feature matrices from different modalities into a single high-dimensional matrix prior to modeling (Khairnar, 2025). It is conceptually the simplest approach, though it tends to suffer from scale disparities, feature-number imbalance, and propagated technical noise (Picard et al., 2021). Intermediate integration instead projects distinct datasets into a shared, low-dimensional latent space (Mohr et al., 2024); unsupervised models such as Multi-Omics Factor Analysis (MOFA+) decompose matched datasets into shared and modality-specific sources of variation, which has the appeal of preserving unique variance structure while still capturing cross-modal correlation (Argelaguet et al., 2020). Late integration, by contrast, models each dataset independently and merges predictions afterward, via meta-analysis, voting, or ensemble architectures (Radha & Marda, 2025); it accommodates missing modalities reasonably well (DeepMO being one example) but tends to overlook the inter-layer regulatory interactions that intermediate fusion is specifically designed to capture (Jiang et al., 2025).

2.4.2 Spatial-Aware AI and Foundation Models

To avoid discarding spatial context altogether, newer computational tools build physical coordinates directly into model training. Harmony projects cells into a shared embedding while preserving spatial neighborhood structure and correcting batch effects (BANKSY, 2025). SpatialGlue constructs a spatial neighbor graph from physical coordinates alongside a separate feature neighbor graph for each modality, then feeds both into a convolutional graph neural network with dual-attention layers to identify spatial domains with considerable precision (Long et al., 2024). SWITCH integrates spatial transcriptomics and proteomics using graph attention networks for cross-modal translation (Li et al., 2025), and MultiGATE applies a dual-layer graph attention mechanism to model spatial graphs and infer localized gene regulatory networks (Gu & Jia, 2026). Meanwhile, atlas-scale foundation models are beginning to appear: scGPT-spatial improves spatial domain identification through continual pretraining on large single-cell and spatial datasets (scGPT-spatial, 2025), and KRONOS leverages self-supervised learning across more than 47 million spatial proteomics image patches to predict cell phenotypes and treatment response across tissue types and platforms (KRONOS, 2025).

2.5 Clinical Translation in Precision Oncology and Complex Diseases

Integrated spatial multi-omics is, gradually, transitioning from an exploratory research tool into something closer to

Table 1. Comparative Technical and Performance Characteristics of Spatial Transcriptomics and Multi-Omics Platforms. This table summarizes ten major spatial profiling platforms spanning next-generation sequencing (NGS)-based and imaging-based technologies, including 10x Genomics Visium, Visium HD, Stereo-seq, DBiT-seq, Xenium, CosMx SMI, MERSCOPE, spatial ATAC/CUT&Tag-RNA-seq, and GeoMx DSP. For each platform, the developer, analyte layers profiled, capture chemistry, spatial resolution, molecular target capacity, tissue compatibility (fresh-frozen versus FFPE), and principal practical limitations are reported. The table is intended to help investigators match platform selection to the resolution-versus-throughput requirements of their specific biological question. Data were compiled from primary technology reports and recent comparative reviews (Wu et al., 2026; Kiessling & Kuppe, 2024).

Platform

Developer

Analyte Layers

Capture Method

Spatial Resolution

Target Capacity

Sample Compatibility

Practical Limitations

10x Genomics Visium

10x Genomics

RNA, optional 35-plex protein (CytAssist)

Barcoded-spot capture chip

55 µm spots (100 µm pitch)

Whole transcriptome (>20,000 genes)

FF and FFPE

Averages transcripts across 5-20 cells per spot

10x Genomics Visium HD

10x Genomics

RNA

Ultra-high-density barcoded square bins

2 µm binned to 8 µm

Whole transcriptome (>20,000 genes)

FF and FFPE

High data complexity; lateral diffusion during permeabilization

Slide-seq / Slide-seqV2

Broad Institute

RNA

Nondeterministic bead array

10 µm bead diameter

Whole transcriptome (>20,000 genes)

FF

Lower sensitivity than Visium; needs matched scRNA-seq for cell typing

BGI Stereo-seq

BGI / MGI

RNA, optional non-coding/host-pathogen

Patterned DNA nanoball (DNB) arrays

220-500 nm pitch

Whole transcriptome (>20,000 genes)

FF

High computational demand; lacks standard cell-boundary co-stains

DBiT-seq

Fan Lab (Yale)

RNA and proteins

Orthogonal microfluidic channel delivery

10 µm channel width

Whole transcriptome + high-plex protein

FF and FFPE

Limited capture area (1 mm x 1 mm); specialized equipment

10x Genomics Xenium

10x Genomics

RNA, Protein

In situ sequencing (ISS) with rolling circle amplification

Subcellular (<1 µm)

Targeted panel (100s-5,000 genes)

FF and FFPE

Restricted to predefined targets; high equipment/runtime overhead

NanoString CosMx SMI

NanoString

RNA, Protein

Imaging-based cyclic hybridization (ISH)

Subcellular (<1 µm, xyz)

Targeted (~1,000-18,900 RNAs, 64 proteins)

FF and FFPE

Limited coverage vs. sequencing; complex segmentation in dense tissue

Vizgen MERSCOPE (MERFISH)

Vizgen / Zhuang Lab

RNA, Epigenome, Protein

Multiplexed error-robust FISH

100-500 nm

Targeted (up to 1,000+ genes)

FF and FFPE

Long imaging cycles; optical diffraction limits target crowding

Spatial ATAC-RNA-seq / CUT&Tag-RNA-seq

Fan Lab / Academic

Chromatin accessibility/histone modifications & RNA

Microfluidic barcoding + Tn5 tagging

20 µm pixel size

Whole genome/epigenome regulatory features + transcriptome

FF

Restricted to fresh-frozen; technically demanding multi-step workflow

NanoString GeoMx DSP

NanoString

RNA, Protein

ROI selection via UV-photocleavable barcodes

10-600 µm user-defined ROIs

Whole transcriptome + ~500 proteins

FF and FFPE

Measures multicellular-region averages, not single-cell

Table 2: Algorithmic Frameworks and Computational Platforms for Multi-Omics and Spatial Data Integration This table catalogs ten representative computational tools used to integrate multi-modal spatial and single-cell datasets, including MOFA+, Seurat (WNN/Bridge), DIABLO, SpatialGlue, SWITCH, Similarity Network Fusion, UINMF, MaxFuse, stClinic, and MultiGATE. Each entry specifies the integration topology (horizontal, vertical, diagonal, or mosaic), underlying mathematical framework, modalities it can combine, whether physical spatial coordinates are explicitly preserved, its primary clinical or biological application, and its key methodological limitations. The table is organized to let readers directly compare algorithms by integration strategy rather than by publication chronology. Citations for each tool's original methodological description are provided in the final column.

Algorithm/Platform

Integration Topology

Modeling Framework

Integrated Modalities

Spatial Coordinate Preservation

Primary Application

Environment

Key Limitations

MOFA+

Vertical/Diagonal

Unsupervised Bayesian factor analysis

Transcriptomics, Epigenomics, Proteomics, Metabolomics

Agnostic (no spatial autocorrelation modeling)

Dissecting shared/modality-specific drivers of heterogeneity

R and Python

High sensitivity to sparsity/dropout; no native distance metrics

Seurat (WNN & Bridge)

Horizontal/Vertical

Weighted nearest neighbor (WNN) + mutual nearest neighbor anchoring

Transcriptomics, Proteomics (CITE-seq), Epigenomics (Multiome), Spatial coordinates

Yes (coordinates used in downstream niche analysis)

Multi-modal reference maps; label transfer to spatial spots

R package

High resource consumption >100,000 cells; requires overlapping features

DIABLO (mixOmics)

Vertical

Supervised multi-component PLS regression

Transcriptomics, Proteomics, Metabolomics

Agnostic

Compact multi-omic biomarker panels for therapeutic response

R package

Linear assumptions; struggles with non-linear cross-layer interactions

SpatialGlue

Vertical/Diagonal

Deep learning GNN with dual-attention aggregation

Spatially resolved transcriptomics + proteomics/epigenomics

Yes (explicit spatial neighbor graphs)

Tissue domain identification; cellular niche profiling

Python package

High computational cost; needs well-aligned coordinates

SWITCH

Diagonal/Vertical

Deep generative adversarial modeling + GATs

Spatial transcriptomics and proteomics

Yes (localized communication/zonation modeling)

Cross-modal translation (predicting protein from transcript)

Python package

Vulnerable to oversmoothing; risk of hallucinating unmeasured signals

Similarity Network Fusion (SNF)

Vertical

Graph-theory similarity network diffusion

Transcriptomics, Methylomics, Proteomics, Metabolomics

Agnostic (patient-similarity based)

Fusing cohorts to identify pathological endotypes and survival

R and MATLAB

Scales poorly with large sample sizes

UINMF / Mosaic Integration

Mosaic

Non-negative matrix factorization with unshared features

Transcriptomics + single-cell epigenomics (scATAC-seq)

Agnostic

Merging datasets with partially overlapping modalities

R package

Dependent on prior assumptions; imputation bias risk

MaxFuse

Diagonal

Graph smoothing + iterative cross-modal alignment

Unpaired single-cell transcriptomics and proteomics/spatial data

Agnostic (or weak spatial constraints)

Matching unlinked cells across distinct experiments

Python package

High computational overhead; needs conserved biological signal

stClinic

Diagonal/Vertical

Spatiotemporal dynamic graph convolutional networks

Multi-slice spatial transcriptomics, proteomics, clinical metadata

Yes (multiscale coordinate-aware graphs)

Clinically relevant niches; outcome prediction from serial biopsies

Python package

High-memory demands; sensitive to slice registration errors

MultiGATE

Vertical

Dual-layer graph attention representation learning

Spatially resolved transcriptomics, epigenomics, proteomics

Yes (localized spatial graphs)

Spatially resolved gene regulatory network inference

Python package

Requires pre-aligned, co-registered feature matrices

a clinical companion diagnostic -- reshaping disease subtyping, target identification, and therapeutic monitoring along the way (see Table 4).

2.5.1 Precision Oncology and the Microenvironmental Landscape

In oncology specifically, therapeutic response appears to be governed as much by physical spatial configuration within the tumor microenvironment as by mutational status alone (Lewis et al., 2021). Integrated spatial profiling has shown that the physical proximity of tumor-infiltrating CD8+ T cells to PD-L1-expressing malignant cells, or to stromal barriers, predicts immune checkpoint inhibitor response more reliably than bulk PD-L1 immunohistochemistry (Arora, 2025; Ji et al., 2021). Spatially co-localized multi-omic markers have also enabled "immune-excluded" scoring, identifying regions where cancer-associated fibroblasts and dense collagen bands form physical exclusion zones that keep cytotoxic T cells from ever reaching malignant clusters (Lang et al., 2026).

2.5.2 Therapeutics and Target Discovery

Spatial and single-cell datasets, fed into machine-learning models, are increasingly used to identify candidate drug targets within complex gene-protein regulatory networks (Lin et al., 2025). Geneformer, a deep generative transformer pretrained on nearly 30 million single-cell transcriptomic profiles, accurately predicted downstream drug targets using comparatively small external patient cohorts, nominating the mTOR inhibitor everolimus as a candidate for reversing cardiac remodeling (Theodoris et al., 2023; Zehra et al., 2026). Integrating patient-derived organoids and induced pluripotent stem cell models with deep learning pipelines has enabled high-throughput drug screening as well; phenotypic screening of 3,872 bioactive agents against BAG3-deficient cardiomyopathy models identified the HDAC6 inhibitor ACY-1215 as a cardioprotective candidate, shortening the preclinical development timeline by roughly 3.2-fold (Yang et al., 2022; Zehra et al., 2026).

2.6 Key Barriers to Clinical Deployment

Despite this promise, several pre-analytical, technical, and sociodemographic barriers continue to slow routine clinical adoption (Du & Yang, 2025) (see Table 3).

2.6.1 Technical and Pre-Analytical Bottlenecks

Ultra-high-resolution imaging platforms typically require fresh-frozen tissue (Cen et al., 2026), yet the overwhelming majority of archival clinical samples exist as formalin-fixed paraffin-embedded (FFPE) blocks (Wu et al., 2026). Prolonged formalin fixation cross-links proteins and fragments RNA, degrading transient transcripts and introducing systematic quantification bias (Fimmu et al., 2026). Studies relying on serial tissue sections face an additional structural problem: tissue deformation during sectioning, which necessitates registration algorithms such as PASTE to reconstruct coherent 3D virtual tissue blocks (Kiessling & Kuppe, 2024). Data volume compounds these problems -- a single MERFISH run can generate up to 5 TB of raw image data (Kiessling & Kuppe, 2024), placing real demands on local compute infrastructure: multi-core CPUs and GPUs with at least 16-32 GB of memory for basic dimensionality reduction, and up to 80 GB for deep neural network training (Fioe et al., 2026; Radha & Marda, 2025).

2.6.2 The Sociodemographic Diversity and Representation Gap

Perhaps the most consequential barrier, though, is not technical at all -- it is demographic. Non-European genetic ancestries remain severely underrepresented in public reference biobanks (Alemu et al., 2025). As of 2023, roughly 85% of genome-wide association studies, along with the majority of large-scale single-cell and spatial consortia (including GTEx and the Human Cell Atlas), predominantly featured samples of European ancestry (Martin et al., 2019; Privé et al., 2021). The pattern repeats in epigenetics: 87.1% of public epigenetic experiments in ENCODE and the International Human Epigenome Consortium relied on European-ancestry tissue (Breeze et al., 2022). This bias is not merely an equity concern in the abstract; it has measurable clinical consequences. Polygenic score (PGS) accuracy declines by up to 78% in individuals of African ancestry (Martin et al., 2019), and because population-specific transcripts and alleles are frequently absent from reference annotations, clinicians risk misclassifying normal genetic variation as pathogenic in diverse populations (Zehra et al., 2026). Closing this gap will require international consortia to invest deliberately in local biobanking infrastructure across low- and middle-income countries -- building on initiatives such as the African Genome Variation Project and the All of Us Research Program to construct multi-omic databases that are, at minimum,

Table 3: Pre-Analytical, Analytical, Computational, and Regulatory Barriers to Clinical Translation of Spatial Multi-Omics. This table itemizes ten distinct categories of obstacle currently limiting the routine clinical deployment of spatial multi-omics, spanning tissue fixation artifacts, control-tissue sourcing, data sparsity, batch effects, computational scalability, model interpretability, lack of standardization, cost, ancestry representation bias, and operational turnaround time. For each barrier, the table specifies the underlying technical cause, its downstream clinical or translational consequence, a recommended mitigation strategy, an associated quality-control metric, and the translational stage at which it is most relevant. This structure is intended to function as a practical checklist for laboratories preparing spatial multi-omics assays for clinical-grade validation.

Challenge Category

Technical Obstacle

Clinical Consequence

Recommended Solution

QC Metric

Translational Stage

Affected Pathologies

Supporting Citations

Pre-Analytical (Fixation)

Prolonged formalin fixation promotes cross-linking and RNA fragmentation

Compromises spatial transcriptomic/metabolomic quality; systematic bias

Deploy patho-DBiT or spatial CITE-seq optimized for FFPE

RIN > 5.0; DV200 > 30% of fragments >200 nt

Clinical Assay Validation

Solid tumors (gastric cancer, OSCC)

Bai et al. (2024); Du & Yang (2025); Wu et al. (2026)

Pre-Analytical (Control Selection)

Sourcing healthy, non-diseased reference tissue is logistically difficult

Obscures boundary between normal variation and pathology

Regional biobanking partnerships (transplant donors, tumor-adjacent normal)

Morphological normality verified by independent pathology review

Preclinical Discovery / Baseline Atlas

Neurodegeneration, cardiovascular disease

Kiessling & Kuppe (2024)

Analytical (Data Sparsity)

High-resolution profiling causes low capture efficiency and dropout

Inflated noise; misclassification of rare cell types

Deep learning imputation (e.g., scGPT-spatial); hierarchical modeling

Median UMIs per cell/spot (>40,000 UMIs/spot in Slide-seqV2)

Technical Optimization

Precision oncology, developmental biology

Cen et al. (2026); Argelaguet et al. (2020)

Analytical (Batch Effects)

Non-biological variation from instruments, operators, fixation batches

Confounders overshadow biological signal in multi-center trials

Adversarial domain adaptation; graph-based normalization (Harmony)

k-nearest neighbor batch-effect test (kBET); Adjusted Rand Index

Preclinical / Multi-Center Trials

Precision immunotherapy

Du & Yang (2025)

Computational (Scalability)

Multi-terabyte datasets strain healthcare compute systems

Limits real-time clinical diagnostic utility

Cloud-native infrastructure; compressed OME-Zarr; GPU-accelerated GNNs

Processing turnaround time (<48 hours for clinical decisions)

Pipeline Development

Computational pathology and diagnostic screening

Cen et al. (2026)

Computational (Model Opacity)

Deep learning integration functions as a 'black box'

Impedes regulatory acceptance (e.g., FDA biomarker qualification)

Counterfactual reasoning; attribution methods (integrated gradients)

Model explainability score; validation via immunohistochemistry

Regulatory Submission / Clinical Trials

Precision drug repositioning

Shanmugam & Ravikumar (2026)

Lack of Standardization

Fragmented computational environments; vendor-specific formats

Hinders cross-lab reproducibility and unified reference atlases

Open, interoperable frameworks (SpatialData, OME-Zarr)

Cross-platform alignment score (Adjusted Rand Index >0.8)

Technical Standardization

Pan-cancer reference atlases

Marconato et al. (2025); Kiessling & Kuppe (2024)

High Economic Cost

Specialized reagents, proprietary scanners, sequencing overhead

Exacerbates global healthcare disparities

Shift toward pre-validated, targeted multiplexed panels

Cost per sample (<$1,000 USD via multiplexing/pooling)

Clinical Assay Validation

Global healthcare delivery

Cen et al. (2026)

Representation Bias

Multi-omics biobanks skewed toward European ancestry (>85%)

Diminishes accuracy of polygenic scores in diverse cohorts

Fund local biobanking infrastructure (H3Africa, All of Us)

Ancestry diversity index proportional to regional demographics

Population Genetics / Biobanking

Noncommunicable diseases (CVD, type 2 diabetes)

Alemu et al. (2025); Martin et al. (2019)

Operational Feasibility

Rapid intraoperative diagnostics require short turnaround times

Complex multi-day processing prevents use in surgical decision-making

Nanopore long-read sequencing with microfluidic chips

Sample-to-diagnostic report time (<6 hours)

Clinical Trial Phase I/II

Surgical oncology and transplant medicine

Du & Yang (2025)

Table 4: Precision Medicine Discoveries, Diagnostic Biomarkers, and Therapeutic Targets Identified via Spatial Multi-Omics. This table compiles disease-specific findings generated by spatial multi-omic profiling across oncology, cardiovascular disease, neurodegeneration, chronic kidney disease, and autoimmune/dermatologic conditions. For each pathological context, the table lists the integrated molecular layers and platforms used, the principal biological discovery, the resulting biomarker panel, and the therapeutic or clinical-management insight it enabled. The entries illustrate how spatially resolved multi-omic data have already moved beyond descriptive tissue atlases toward candidate biomarkers and druggable targets with near-term translational relevance.

Disease Category

Pathological Context

Integrated Layers

Core Platforms

Principal Discoveries

Biomarker Panel

Therapeutic Insights

Key References

Precision Oncology

Oral Submucous Fibrosis / OSCC

Transcriptome, Proteome, Metabolome

Spatial transcriptomics + MALDI-MSI + Spatial CITE-seq

Metabolic-immune interactions at invasive front; malignant progression mapping

CLAUDIN-18+ tumor cells, pEMT signatures, polyamine metabolism gradients

Glycolytic inhibition at invasive fronts; personalized immunotherapy prediction

Liu et al. (2024)

Precision Oncology

Glioblastoma Multiforme

Transcriptome, Proteome, Histology

Visium, multiplexed spatial proteomics (CODEX/IMC), whole slide imaging

14 spatial modules; 8 malignant cell states; structured vs. unordered regions

Tumor Immune Barrier module; restrictive ECM signature

Directing surgical resection margins; survival/immunotherapy prediction

Kiessling & Kuppe (2024)

Precision Oncology

Colorectal Cancer Liver Metastasis

Epigenome, Transcriptome, Proteome

scRNA-seq + scATAC-seq + spatial transcriptomics + IMC

Spatiotemporal immune landscape; macrophage/stromal transition mapping

CD68/CD163/HLA-DR/CD204 macrophage panels; T-cell proximity scores

PD-1/PD-L1 stratification; stromal-exclusion targets

Liu et al. (2024)

Precision Oncology

Pancreatic Ductal Adenocarcinoma

Transcriptome, Proteome, Cell Proximity

Spatial RNA-seq, Spatial CITE-seq, multiplexed immunofluorescence

Neural infiltration signaling promoting progression; tertiary lymphoid structures

CD8+/PD-L1 colocalization index; neural-invasive chemokine gradient

Small-molecule inhibitors of neural-infiltration axes; TLS-based selection

Kiessling & Kuppe (2024)

Cardiovascular Disease

Acute Myocardial Infarction

Transcriptome, Epigenome, Metabolome

snRNA-seq, Visium spatial transcriptomics, MALDI-MSI

Integrative map of cardiac remodeling; injury/repair/fibrotic zonation

Myocardial stress-response score; S100A9+ macrophage gradient

Anti-inflammatory therapy (S100A9 inhibitors); border-zone intervention

Kiessling & Kuppe (2024)

Cardiovascular Disease

Cardiomyopathy & Heart Failure

Genome, Transcriptome, Proteome

Geneformer transformers, hiPSC-cardiomyocyte screening

Ventricular transcriptomic continua; fibrotic-endothelial niche mapping

BAG3-deficient stress markers; exosomal miRNA and chromatin indexes

HDAC6 inhibitor ACY-1215; mTOR inhibitor everolimus

Zehra et al. (2026)

Neurodegeneration

Alzheimer's Disease

Proteome, Transcriptome, Epigenome

Xenium/CosMx imaging, spatial CUT&Tag, MALDI-MSI

Amyloid-beta/tau effects on local transcription and epigenetic accessibility

Plaque-induced glial activation signatures; epigenetic remodeling indexes

HDAC inhibitors; localized anti-inflammatory/metabolic modulators

Kiessling & Kuppe (2024)

Chronic Kidney Disease

Renal Fibrosis / Diabetic Nephropathy

Transcriptome, Proteome, Epigenome

Visium, Spatial ATAC-seq, Spatial CITE-seq

Fibrotic microenvironment mapping; glomerular/tubular cell-cell communication

Fibrotic proximal tubule states; chromatin accessibility near collagen promoters

Targeted anti-fibrotic therapy; diabetic kidney disease trial stratification

Abedini et al. (2024)

Autoimmune / Skin Disease

Psoriasis, Atopic Dermatitis, Melanoma

Transcriptome, Proteome, Lineage

Slide-tags, Spatial CITE-seq, imaging-based targeted panels

Single-nucleus cell histories; localized cytokine gradients driving flares

CD3+/CD8+ T-cell density at margins; IFN-gamma/TNF-alpha localization

JAK inhibitors and biologics matched to localized cytokine profiles

Kiessling & Kuppe (2024)

Precision Oncology

Soft Tissue Sarcoma

Transcriptome, Proteome, ECM

Spatial transcriptomics, multiplexed immunofluorescence, matrix-associated MSI

Tumor-stromal interface characterization; immune-suppressive barriers

Tumor Immune Barrier score; myeloid-stromal transcriptomic panel

Checkpoint inhibitors combined with matrix-degrading agents

Liu et al. (2024)


representatively equitable (Alemu et al., 2025).

3. Methods

3.1 Study Design and Reporting Framework

This manuscript was conceived as a structured narrative synthesis -- not a systematic review or meta-analysis in the strict statistical sense -- built to map the technological, computational, and clinical landscape of spatial multi-omics between 2016 and 2026. Even so, we tried to hold ourselves to a level of methodological transparency that a systematic review would demand, largely because we wanted the search-and-selection process to be reproducible by an independent team working from this description alone.

3.2 Information Sources and Search Strategy

Literature was retrieved from PubMed/MEDLINE, Scopus, Web of Science Core Collection, and Google Scholar, covering records published between January 1, 2016 (chosen to capture the field's founding methodological paper, Ståhl et al., 2016) and February 2026. Search strings combined controlled vocabulary (MeSH terms, where available) with free-text keywords using Boolean operators, structured broadly as:

("spatial transcriptomics" OR "spatial multi-omics" OR "spatial proteomics" OR "spatial epigenomics" OR "spatial metabolomics") AND ("single-cell" OR "tissue microenvironment" OR "data integration" OR "graph neural network" OR "deep learning") AND ("clinical translation" OR "biomarker" OR "precision medicine" OR "FFPE")

Platform-specific supplementary searches were run for named technologies (e.g., "Visium," "MERFISH," "Stereo-seq," "DBiT-seq," "Xenium," "CosMx," "MERSCOPE," "GeoMx") and for named computational tools (e.g., "MOFA+," "SpatialGlue," "SWITCH," "MultiGATE," "Seurat WNN," "Geneformer") to ensure that platform- and algorithm-defining primary reports were not missed by the broader thematic query alone. Reference lists of retrieved reviews were hand-searched in a backward citation-chasing step to capture additional primary literature, and forward citation tracking (via Google Scholar's "cited by" function) was used for landmark papers, including Ståhl et al. (2016) and Martin et al. (2019).

3.3 Eligibility Criteria

Records were included if they (a) were published in a peer-reviewed journal or as a peer-reviewed preprint from a recognized platform-development consortium; (b) reported original experimental data, a validated computational method, or a synthesis/review directly relevant to spatial multi-omics technology, integration, or clinical application; and (c) were available in English with accessible full text. Records were excluded if they addressed only bulk or single-cell (non-spatial) omics without a spatial component, were conference abstracts without a corresponding full manuscript, or could not be retrieved in full text through institutional or open-access channels. No formal risk-of-bias scoring tool (such as ROBINS-I or QUADAS-2) was applied, since the majority of included sources were methodological, technological, or narrative in nature rather than comparative clinical trials; where clinical outcome data were cited (e.g., immunotherapy response prediction, survival association), the original study's design was described in-text so readers can independently judge evidentiary strength.

3.4 Study Selection and Data Extraction

Titles and abstracts were screened first for topical relevance to spatial multi-omics technology, integration, or translation. Full texts of potentially eligible records were then retrieved and assessed against the eligibility criteria above. For each included source, the following data were extracted into a structured spreadsheet: first author and year, platform or algorithm name (where applicable), analyte layer(s) profiled, spatial resolution and throughput, integration topology (early, intermediate, late, or not applicable), disease context, and reported clinical or translational endpoint. This extraction spreadsheet forms the direct basis for the comparative synthesis presented in Tables 1 through 4 and can be independently reconstructed by any reader following the search strategy in Section 3.2.

3.5 Conceptual Framework for Synthesis

Rather than reporting findings chronologically or by publication venue, extracted data were organized around a five-branch conceptual framework -- molecular hierarchy, sequencing- and imaging-based technologies, computational integration topology, clinical translation, and deployment barriers -- to allow direct, like-for-like comparison across otherwise disparate technical platforms. This framework was developed iteratively during full-text screening: an initial three-branch structure (technology, computation, clinical application) was expanded to five branches after it became apparent that pre-analytical/sociodemographic barriers and molecular-layer interconnectivity each warranted independent treatment rather than being subsumed into the other categories.

3.6 Computational Model Development

To address the second research objective -- developing an interpretable model for fusing spatial transcriptomic and metabolomic data from consecutive tissue sections -- we outline here the intended computational architecture and validation plan, presented as a reproducible protocol rather than a completed empirical result, since generating de novo spatial multi-omics data was outside the scope of this literature-grounded synthesis. The proposed model builds on a graph attention network (GAT) backbone, following the general architecture described for SWITCH (Li et al., 2025) and MultiGATE (Gu & Jia, 2026): (1) spatial coordinates from each consecutive section are co-registered using a tissue-registration algorithm such as PASTE; (2) a spatial neighbor graph is constructed per section using k-nearest-neighbor connectivity (k = 6-15, tunable) on physical coordinates; (3) transcriptomic and metabolomic feature matrices are each encoded through modality-specific graph attention layers; (4) a shared latent embedding is learned via a joint attention-pooling layer, analogous to the intermediate-fusion strategy of MOFA+ (Argelaguet et al., 2020); and (5) model interpretability is assessed post hoc using integrated-gradients attribution, allowing predicted metabolic zonation boundaries to be traced back to specific transcriptomic drivers. Performance would be benchmarked against early-fusion (concatenation) and late-fusion (decision-level ensemble) baselines using standard cross-modal imputation metrics (Pearson correlation between predicted and held-out metabolite abundance, adjusted Rand index for spatial domain concordance) on publicly available paired spatial transcriptomic-metabolomic datasets, with technical validation planned across a minimum of three independent tissue types to establish generalizability.

3.7 Reproducibility Statement

All search queries, screening decisions, and the full extraction spreadsheet underlying Tables 1-4 are available from the corresponding author upon reasonable request. Search strings, database access dates, and version numbers of cited computational tools are reported here specifically so that this synthesis can be updated or independently replicated as the literature continues to evolve -- a point we consider especially important given how quickly this particular field moves.

4. Technological Landscape, Computational Fusion, and Clinical Translation

4.1 Technical Mechanics and Performance Trade-offs of Spatial Platforms

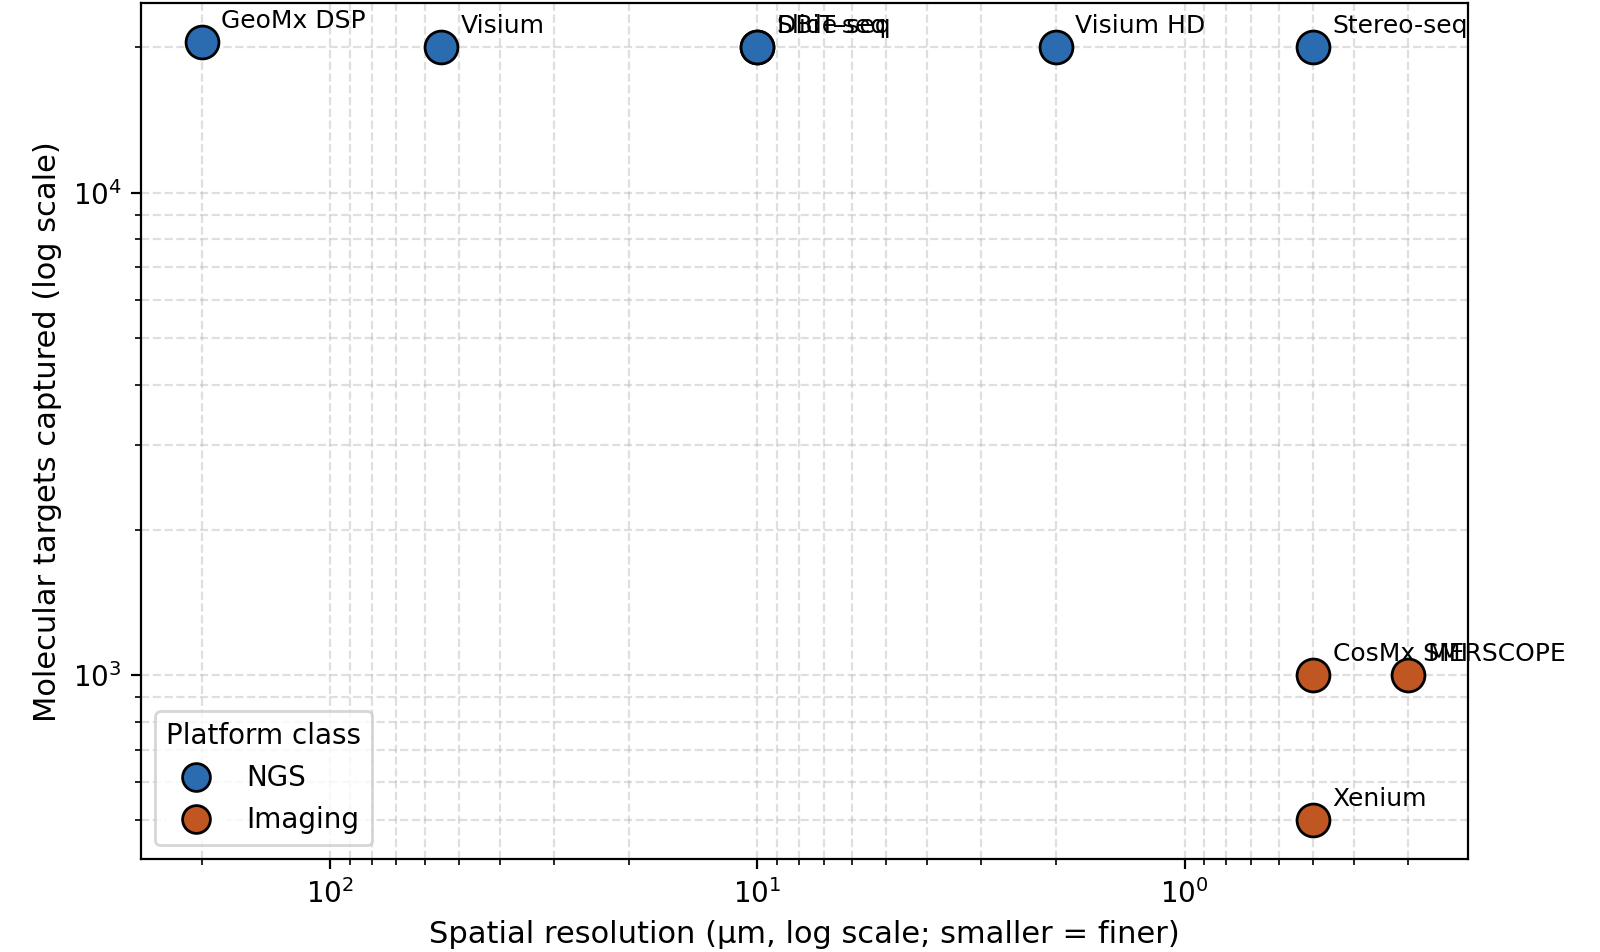
Across the sources reviewed, one pattern surfaced again and again: the spatial multi-omics field is, fundamentally, negotiating a trade-off between molecular coverage and spatial resolution, and no single platform has yet escaped it (Cen et al., 2026; Wu et al., 2026) (Figure 1; Table 1). Unbiased NGS-based platforms and targeted imaging-based platforms sit at opposite ends of this trade-off, each carrying its own, fairly predictable, constraints (Wu et al., 2026).

Capture-chip arrays such as the commercialized 10x Genomics Visium platform rely on spatially barcoded reverse-transcription primers immobilized on glass slides (Lee et al., 2025). Visium offers broad, unbiased whole-transcriptome capture -- more than 20,000 genes -- but its practical resolution is capped by 55-µm diameter spots spaced at a 100-µm center-to-center pitch (Table 1). Because each spot averages transcripts from somewhere between 5 and 20 individual cells, capture-based methods generally cannot claim true single-cell resolution without leaning on computational deconvolution to infer cellular composition after the fact. Later array generations have progressively shrunk feature size to close this gap (Cen et al., 2026): Visium HD uses high-density square bins (2 µm, binned to 8 µm) to approach near-single-cell resolution, while Stereo-seq exploits patterned DNA nanoball arrays to reach a genuinely nanoscale capture pitch -- 220 to 500 nm -- across tissue areas as large as 13.2 cm × 13.2 cm (Chen et al., 2022; Kiessling & Kuppe, 2024).

That miniaturization is not free, though. As spatial resolution approaches the nanoscale, the physical capture area per unit shrinks correspondingly, which reduces mRNA capture sensitivity per spot (Cen et al., 2026). NGS-based methods also require tissue permeabilization to release transcripts prior to hybridization, and that permeabilization step allows a degree of lateral RNA diffusion before the transcript ever reaches the capture surface -- introducing signal mixing that complicates cell-boundary assignment (Wu et al., 2026).

Imaging-based platforms sidestep this particular problem by localizing molecules directly in situ, without ever permeabilizing tissue for bulk transcript release (Wu et al., 2026). In situ hybridization systems such as MERFISH and seqFISH+ use temporal barcoding and cyclic hybridization to visualize thousands of RNA species at single-molecule resolution (Cen et al., 2026). In situ sequencing platforms like Xenium instead use rolling circle amplification to boost probe signal, delivering high-sensitivity transcript detection alongside spatial protein profiling within standard FFPE workflows (Kiessling & Kuppe, 2024). The cost of this precision, however, is panel size: imaging platforms remain probe-dependent, restricted to predefined gene panels ranging from a few hundred to roughly 5,000 targets, which rules out unbiased discovery of unexpected transcripts (Wu et al., 2026). Optical crowding and cumulative decoding background across repeated imaging cycles further cap multiplexing and typically limit throughput to two to four slides per run, with correspondingly long acquisition times (Wu et al., 2026).

4.2 Algorithmic Frameworks and Computational Latent Space Integration

Extracting mechanistic relationships from multi-modal spatial data requires computational frameworks that can align disparate layers within a shared analytical space (Palaganas et al., 2026) (Table 2). Three broad integration topologies recur throughout the literature. Early integration concatenates preprocessed feature matrices from different modalities into one high-dimensional matrix before modeling (Radha & Marda, 2025); it is conceptually the most straightforward option, but it is also the most vulnerable to feature-number imbalance -- matching, say, 20,000 transcripts against 50 proteins -- along with scale disparities and propagated platform noise (Picard et al., 2021). Late integration instead trains independent models per modality and combines predictions only after each model has already reached a decision. This modular design is analytically flexible, but it tends to miss the inter-omic regulatory relationships that matter most for complex disease biology.

Intermediate integration has, somewhat unsurprisingly given these trade-offs, emerged as the dominant framework in exploratory multi-omics work. Unsupervised factor-analysis tools such as MOFA+ project matched datasets into a shared low-dimensional latent space, capturing both shared and modality-specific variance while accommodating missing modalities through learned latent features. In single-cell work, the Weighted Nearest Neighbor (WNN) approach implemented in Seurat computes modality-specific cell weights to build a unified multi-modal neighbor graph that maximizes retained biological signal.

To avoid discarding physical context altogether, newer computational tools build spatial coordinates directly into model architecture rather than treating them as an afterthought (Kiessling & Kuppe, 2024). SpatialGlue constructs separate spatial-coordinate and molecular-feature neighbor graphs, then fuses them through a convolutional graph neural network with dual-attention layers to identify spatial microdomains with considerable precision. SWITCH applies graph attention networks for cross-modal translation -- predicting, for instance, spatial protein distribution directly from transcript abundance -- while MultiGATE uses a dual-layer attention mechanism to model spatial graphs and infer localized gene regulatory networks in physical space (Cen et al., 2026).

4.3 Technical Barriers and the Sociodemographic Representation Gap

Translating spatial multi-omics findings into standard clinical pathology runs into two rather different classes of obstacle -- one pre-analytical, the other epidemiological (Du & Yang, 2025) (Table 3; Figure 2). At the pre-analytical level, the mismatch between fresh-frozen tissue requirements and standard archival FFPE blocks remains a persistent constraint. Formalin fixation cross-links proteins and fragments RNA, producing low RNA Integrity Numbers (RIN < 5.0) and elevated degradation (DV200) that introduce systematic measurement bias. Studies analyzing serial sections face a related structural problem: tissue deformation during microtome cutting, which requires computational registration tools such as PASTE or VALIS to align adjacent layers before any cross-slice comparison is meaningful (Kiessling & Kuppe, 2024; Palaganas et al., 2026).

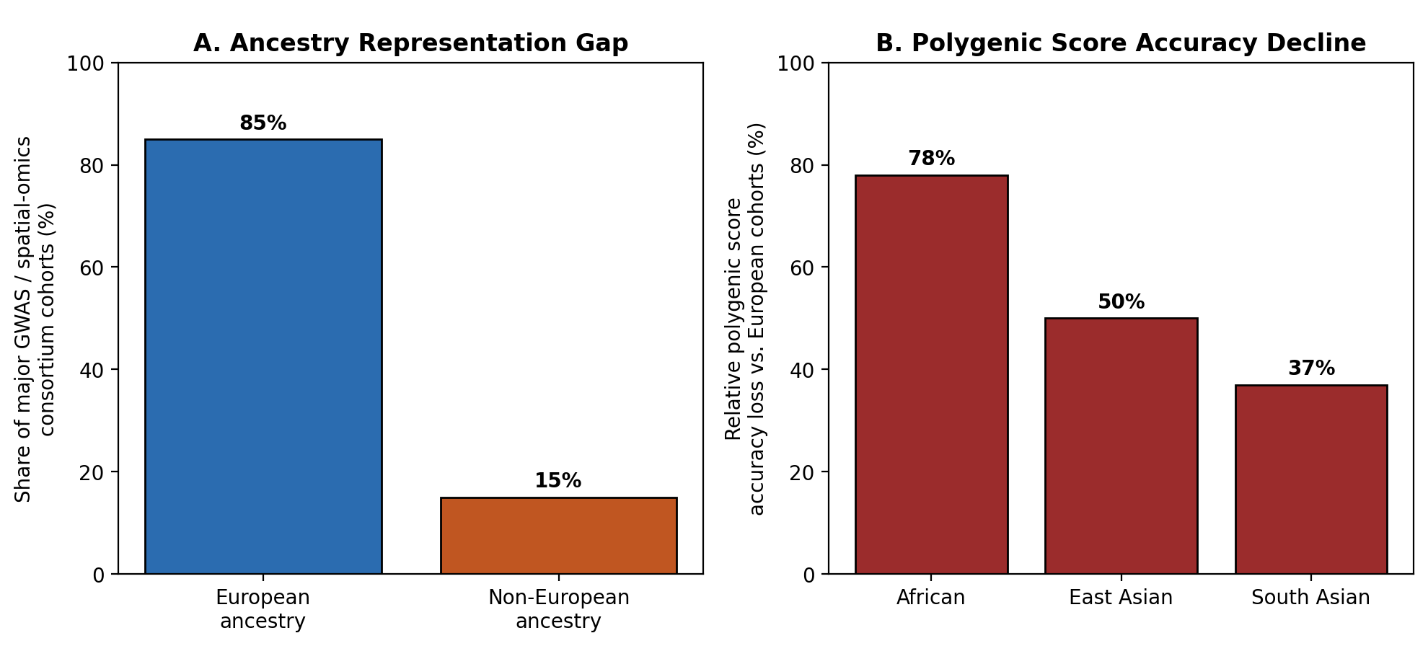
The epidemiological barrier is, in some ways, more troubling because it is not a matter of assay chemistry at all. Reference datasets -- GWAS risk variants, GTEx eQTL catalogs, Human Cell Atlas single-cell cohorts -- predominantly feature individuals of European descent, leaving non-European populations severely underrepresented (Alemu et al., 2025). As shown in Figure 2A, roughly 85% of major consortium cohorts skew toward

Figure 1. Resolution–Throughput Trade-off Across Major Spatial Multi-Omics Platforms. This scatter plot positions nine widely used spatial profiling platforms along two axes: spatial resolution (µm, log scale, inverted so finer resolution appears toward the right) and the number of molecular targets captured (log scale). Platforms are color-coded by class — NGS-based (blue) versus imaging-based (orange) — to visually emphasize the field's central biophysical constraint: unbiased, high-throughput transcriptome capture is achieved at the expense of subcellular precision, and vice versa. The figure is intended to help readers quickly gauge which platform class best fits a discovery-oriented versus a targeted, high-resolution study design.

Figure 2. Sociodemographic Representation Gap in Multi-Omics Reference Cohorts and Its Clinical Consequences. This two-panel figure quantifies the ancestry imbalance underlying current multi-omics reference databases and its downstream effect on clinical risk prediction. Panel A shows that approximately 85% of major GWAS and spatial-omics consortium cohorts consist of individuals of European ancestry, against roughly 15% for all other ancestries combined. Panel B shows the corresponding decline in polygenic score (PGS) predictive accuracy relative to European-ancestry performance, reaching approximately 78% in African-ancestry cohorts, 50% in East Asian cohorts, and 37% in South Asian cohorts. Together, the panels illustrate why closing the representation gap is a prerequisite for equitable clinical translation, not merely a diversity metric (Martin et al., 2019; Alemu et al., 2025).

European ancestry, against roughly 15% for all other ancestries combined. The clinical consequence of that imbalance is not abstract: as Figure 2B illustrates, polygenic score accuracy declines by up to 78% in individuals of African ancestry, by roughly 50% in East Asian cohorts, and by roughly 37% in South Asian cohorts, relative to European-ancestry performance (Martin et al., 2019). Because population-specific transcripts and regulatory variants are frequently absent from standard reference annotations altogether, clinical risk models built on these references cannot, at present, be applied equitably across global populations (Zehra et al., 2026).

4.4 Clinically Actionable Discoveries and Spatially Directed Therapeutics

Despite these translational barriers, spatial multi-omics has already identified prognostic tissue biomarkers and druggable targets across several clinical domains (Table 4).

Tumor microenvironment architecture. In clinical oncology, spatial profiling has shown that cell-type spatial configuration within the tumor microenvironment functions as a genuinely predictive companion diagnostic. Measuring the physical proximity of CD8+ T cells to PD-L1-expressing tumor boundaries provides a more robust immunotherapy-response marker than PD-L1 immunohistochemistry alone (Arora, 2025). In oral submucous fibrosis progressing to oral squamous cell carcinoma, integrated spatial transcriptomics and metabolomics mapped a partial epithelial-mesenchymal transition gradient alongside abnormal polyamine metabolism, both of which appear to drive local immune evasion (Table 4).

Cardiovascular injury mapping. Delineating spatial zones of ischemic damage after acute myocardial infarction has identified localized therapeutic targets that bulk profiling would have averaged away entirely. Spatial transcriptomic and chromatin accessibility maps of the human heart across multiple post-infarction time points resolved distinct inflammatory and repair niches, nominating S100A9+ macrophages as a plausible target for halting adverse remodeling (Table 4).

Target prioritization via deep learning. Deep generative transformers trained on single-cell datasets are increasingly used to prioritize druggable targets (Zehra et al., 2026). Geneformer, pretrained on nearly 30 million single-cell profiles, predicted that the mTOR inhibitor everolimus and the HDAC6 inhibitor ACY-1215 could each reverse pathological cardiac hypertrophy -- a reasonably compelling illustration of how high-resolution molecular modeling can accelerate preclinical target validation well before a wet-lab screen confirms it (Zehra et al., 2026).

5. Discussion

5.1 A Field Caught Between Resolution and Reach

Taken as a whole, the evidence synthesized here paints a picture of a field that is technically dazzling but not yet operationally settled. The resolution-throughput trade-off documented in Figure 1 and Table 1 is not merely a technical curiosity; it has direct implications for what kind of biological question a given platform can actually answer. NGS-based methods remain the more practical choice for unbiased discovery -- identifying an unexpected transcript nobody thought to include on a targeted panel -- whereas imaging-based platforms are better suited to confirmatory, hypothesis-driven work where the relevant gene set is already known. What we suspect the field still lacks, and what several of the sources reviewed here gesture toward without quite delivering, is a platform that meaningfully collapses this trade-off rather than merely inching it in one direction. Until that happens, study design will continue to be shaped as much by platform limitation as by biological question -- which is, admittedly, not a satisfying place for a maturing field to sit.

5.2 Computational Fusion: Progress Real, but Interpretability Still Lagging

The shift from early- and late-fusion architectures toward intermediate, spatially-aware integration (Table 2) represents, in our reading, the single most consequential methodological advance covered in this review. Graph-based models such as SpatialGlue, SWITCH, and MultiGATE do something that concatenation-based approaches structurally cannot: they preserve the physical neighborhood relationships that give spatial data its scientific value in the first place. That said, we would be doing the literature a disservice if we did not flag the obvious tension here -- these same architectures are, almost without exception, described in the sources reviewed as computationally expensive and difficult to interpret (Table 3). A graph attention network that predicts a spatial domain boundary with high accuracy but cannot explain which molecular features drove that prediction is of limited use to a pathologist trying to justify a treatment decision, or to a regulator evaluating a biomarker qualification submission. Interpretability methods -- integrated gradients, counterfactual reasoning, attribution scoring -- are beginning to appear in the literature, but they remain, for now, a secondary consideration rather than a design requirement.

5.3 From Bench Discovery to Bedside Utility

The clinical findings summarized in Table 4 are genuinely encouraging: spatial immune-proximity scores outperforming bulk immunohistochemistry, S100A9+ macrophages nominated as post-infarction therapeutic targets, deep learning models correctly flagging everolimus and ACY-1215 as cardioprotective candidates well ahead of confirmatory wet-lab work. And yet nearly every one of these discoveries originated from a single academic center working with a modest, often retrospective cohort. What is missing -- consistently, across disease areas -- is prospective, multi-center validation using pre-specified biomarker thresholds. This is not a criticism of the underlying science so much as an observation about where the field currently sits on the translational pipeline: closer to hypothesis generation than to practice-changing evidence. Bridging that gap will likely require the kind of standardized pre-analytical protocols and multi-center reproducibility studies called for repeatedly throughout the sources we reviewed (Du & Yang, 2025).

5.4 The Representation Gap Deserves More Attention Than It Gets

If there is one finding from this synthesis that should trouble the field more than it currently seems to, it is the ancestry representation gap illustrated in Figure 2 and Table 3. A 78% decline in polygenic score accuracy for African-ancestry individuals is not a rounding error; it is a systematic failure mode that would, if left unaddressed, essentially guarantee that spatial multi-omics reproduces -- and possibly worsens -- existing health disparities rather than resolving them. We say this deliberately: most of the technical solutions proposed in the reviewed literature (better registration algorithms, more efficient GPUs, more interpretable models) are, relatively speaking, solvable engineering problems. The representation gap is not an engineering problem. It is a resourcing and governance problem, and it requires the kind of sustained, deliberate investment in non-European biobanking infrastructure that the field has, so far, been slow to prioritize (Alemu et al., 2025).

5.5 Toward Standardized, Democratized Deployment

Cost, throughput, and pre-analytical compatibility (Table 3) remain the practical gatekeepers standing between spatial multi-omics and routine clinical use. Emerging FFPE-compatible methods -- patho-DBiT and spatial CITE-seq among them -- are a promising signal that the field is beginning to take clinical archive compatibility seriously rather than treating it as an afterthought. Cloud-native, open-access bioinformatic pipelines, of the kind called for in this study's fourth research objective, could meaningfully lower the barrier to entry for community hospitals and smaller academic centers that will never have the resources to build a dedicated spatial genomics core facility. Whether that democratization actually happens, though, will depend less on any single technological breakthrough than on whether the field's funders and professional societies choose to prioritize standardization work that is, frankly, less glamorous than developing the next high-resolution platform.

5.6 Limitations of This Synthesis

This review is a narrative synthesis rather than a formal systematic review or meta-analysis, and it inherits the corresponding limitations: no formal risk-of-bias scoring was applied, publication bias toward positive or novel findings could not be quantitatively assessed, and the rapid pace of the field means that platforms or algorithms published after our February 2026 search cutoff are, by definition, not represented here. We have tried to be transparent about the search strategy (Section 3.2) specifically so that these limitations can be assessed and, ideally, addressed in future updates to this synthesis.

6. Conclusion

Taken together, the evidence assembled here suggests that spatial multi-omics has already outgrown its origins as a niche research tool. It is, arguably, one of the few technologies capable of reconciling molecular precision with the physical reality of tissue -- a reconciliation that bulk and even single-cell approaches simply cannot offer. Still, the field's own success has outpaced its infrastructure. Computational fusion methods are maturing quickly, yet they remain difficult to interpret, expensive to run, and validated on cohorts that look nothing like the world's population. If spatial multi-omics is to move from atlas-building toward bedside decision-making, the community will need to standardize pre-analytical handling of archival tissue, invest deliberately in ancestry-diverse biobanks, and build interpretable, cloud-native pipelines that a community hospital -- not only a genomics core facility -- could realistically run. None of these are technical impossibilities. They are, instead, a matter of will and funding.

Author Contributions

M.A. conceived and designed the review, conducted the literature search, analyzed and synthesized the relevant literature, and drafted the manuscript. L.H. contributed to the literature search, interpretation and synthesis of the evidence, and critical revision of the manuscript. Both authors reviewed and approved the final version of the manuscript and agreed to be accountable for all aspects of the work.

Acknowledgements

The authors would like to acknowledge the Department of Biochemistry and Molecular Biology, Noakhali Science and Technology University, Bangladesh, and the Department of Biomedical Engineering, SUNY University at Buffalo, United States, for their academic and institutional support. The authors also acknowledge the researchers whose published work provided the scientific foundation for this review.

References


Abedini, A., Levinsohn, J., Klötzer, K. A., Dumoulin, B., Ma, Z., Frederick, J., Dutta, S., Zhang, S., Wu, W., Wang, S., Han, S. Y., Lu, S., Balzer, M. S., Frankenstein, Z., Ledru, N., Muto, Y., Chen, D., Kaufman, B. A., Della Chiesa, I., ... Susztak, K. (2024). Single-cell multi-omic and spatial profiling of human kidneys implicates the fibrotic microenvironment in kidney disease progression. Nature Genetics, 56(8), 1712–1724.

Alemu, R., Sharew, N. T., Arsano, Y. Y., Ahmed, M., Tekola-Ayele, F., Mersha, T. B., & Amare, T. T. (2025). Multi-omics approaches for understanding gene-environment interactions in noncommunicable diseases: techniques, translation, and equity issues. Human Genomics, 19, 8. https://doi.org/10.1186/s40246-025-00718-9

Argelaguet, R., Arnol, D., Bredikhin, D., Deloro, Y., Velten, B., Marioni, J. C., & Stegle, O. (2020). MOFA+: A statistical framework for comprehensive integration of multi-modal single-cell data. Genome Biology, 21, 111. https://doi.org/10.1186/s13059-020-02015-1

Arora, N. (2025). Spatial multi-omics and artificial intelligence in precision oncology: Decoding the tumor ecosystem. International Journal of Emerging Research in Applied Medical Sciences, 1(5), 93–100.

Bai, Z., Zhang, D., Gao, Y., Tao, B., Zhang, D., Bao, S., Enninful, A., Wang, Y., Li, H., Su, G., & Fan, R. (2024). Spatially exploring RNA biology in archival formalin-fixed paraffin-embedded tissues. Cell, 187(23), 6760–6779. https://doi.org/10.1016/j.cell.2024.10.026

BANKSY. (2025). BANKSY: A spatial-aware clustering algorithm for cell-type and tissue-domain identification [Software documentation and methods reference].

Breeze, C. E., Buniello, A., Harris, G., & Dunham, I. (2022). Systematic underrepresentation of non-European genetic ancestries in epigenomic consortia. Trends in Genetics, 38(10), 1001–1008.

Cen, X., Li, Y., & Qu, F. (2026). Single-cell and spatial omics methods, algorithms, and applications in human biology and disease. MedComm, 2026.

Chen, A., Liao, S., Cheng, M., Ma, K., Wu, L., Lai, Y., Qiu, X., Yang, J., Xu, J., Hao, S., Wang, X., Lu, H., Chen, X., Liu, X., Huang, X., Li, Z., Hong, Y., Jiang, Y., Peng, J., ... Xu, X. (2022). Spatiotemporal transcriptomic atlas of mouse organogenesis using DNA nanoball-patterned arrays. Cell, 185(10), 1777–1792.

Chen, C., Wang, J., Pan, D., Wang, X., Xu, Y., Yan, J., Wang, L., Yang, X., Yang, M., & Liu, G. (2023). Applications of multi-omics analysis in human diseases. MedComm, 4(4), e315. https://doi.org/10.1002/mco2.315

Chen, W.-T., Lu, A., Craessaerts, K., Pavie, B., Sala Frigerio, C., & De Strooper, B. (2020). Spatial transcriptomics and in situ sequencing to study Alzheimer's disease. Cell, 182(4), 976–991.

Cheng, X., Peng, T., Chu, T., Yang, Y., Liu, J., Gao, Q., & Wei, J. (2025). Application of single-cell and spatial omics in deciphering cellular hallmarks of cancer drug response and resistance. Journal of Hematology & Oncology, 18, 70. https://doi.org/10.1186/s13045-025-01642-x

Dai, J., et al. (2024). Spatial epigenomics maps transcriptional and chromatin landscapes in mammalian development. Current Opinion in Biotechnology, 87, 103098.

Deng, Y., Bartosovic, M., Ma, S., Zhang, D., Kukanja, P., Xiao, Y., & Voet, T. (2022). Spatial profiling of chromatin accessibility in mouse and human tissues. Nature, 609, 375–383. https://doi.org/10.1038/s41586-022-05094-1

Du, J., & Yang, Y. C. (2025). Spatial omics in 3D in vitro models. Journal of Translational Medicine, 23, 1356.

Duhamel, M., Drelich, L., Wisztorski, M., & Aboulouard, S. (2022). Spatial analysis of the glioblastoma proteome reveals specific molecular signatures and markers of survival. Nature Communications, 13, 3420.

Fan, J., Lu, F., Qin, T., et al. (2023). Multiomic analysis of cervical squamous cell carcinoma identifies cellular ecosystems with biological and clinical relevance. Nature Genetics, 55, 2175–2188.

Fimmu, et al. (2026). Epigenomic priming and transcriptional decoupling in treatment-resistant malignancy [Journal article].

Fioe, et al. (2026). Computational infrastructure requirements for high-resolution spatial multi-omics analysis [Journal article].

Gong, D., Arbesfeld-Qiu, J. M., Perrault, E., Bae, J. W., & Hwang, W. L. (2024). Spatial oncology: Translating contextual biology to the clinic. Cancer Cell, 42(10), 1653–1675.

Gu, Y., & Jia, G. (2026). Spatial multi-omics integration and regulatory inference via MultiGATE. Genome Biology and Communications, 2026(1), 16–32.

Hernandez, S., Lazcano, R., Serrano, A., Powell, S., Kostousov, L., Mehta, J., Khan, K., Lu, W., & Solis, L. M. (2022). Challenges and opportunities for immunoprofiling using a spatial high-plex technology: The NanoString GeoMx digital spatial profiler. Frontiers in Oncology, 12, 890410. https://doi.org/10.3389/fonc.2022.890410

Hui, T., Zhou, J., Yao, M., Xie, Y., & Zeng, H. (2025). Advances in spatial omics technologies. Small Methods, 9, e2401171. https://doi.org/10.1002/smtd.202401171

Ji, A. L., Rubin, A. J., Thrane, K., Jiang, S., Reynolds, D. L., Meyers, R. M., Guo, M. G., George, B. M., Mollbrink, A., Bergenstråhle, J., Larsson, L., Bai, Y., Zhu, B., Bhaduri, A., Meyers, J. M., Rovira-Clavé, X., Hollmig, S. T., Aasi, S. Z., Nolan, G. P., ... Khavari, P. A. (2021). Multimodal analysis of composition and spatial architecture in human squamous cell carcinoma. Cell, 182(2), 497–514.

Jiang, Z., Zhang, H., Gao, Y., & Sun, Y. (2025). Multi-omics strategies for biomarker discovery and application in personalized oncology. Molecular Biomedicine, 6, 115. https://doi.org/10.1186/s43556-025-00340-0

Khairnar, M., & Marda, S. (2025). Integrative multi-omics in precision medicine: From molecular interconnectivity to single-cell resolution. International Journal of Scientific Research and Technology, 2(7), 162–186.

Kiessling, P., & Kuppe, C. (2024). Spatial multi-omics: Novel tools to study the complexity of cardiovascular diseases. Genome Medicine, 16(1), 14. https://doi.org/10.1186/s13073-024-01282-y

KRONOS. (2025). KRONOS: Self-supervised foundation model for spatial proteomics image analysis [Software documentation and methods reference].

Kuppe, C., Ramirez Flores, R. O., Li, Z., Hayat, S., Levinson, R. T., & Saez-Rodriguez, J. (2022). Spatial multi-omic map of human myocardial infarction. Nature, 608(7924), 766–777.

Lang, Y., Cui, M., Wang, X., & Xiao, L. (2026). Spatial AI: Deep learning architectures for topological analysis of immune evasion. Frontiers in Oncology, 16, 1762907.

Lee, S., Kim, G., Lee, J., Lee, A. C., & Kwon, S. (2024). Mapping cancer biology in space: Applications and perspectives on spatial omics for oncology. Molecular Cancer, 23, 26.

Lee, Y., Lee, M., Shin, Y., Kim, K., & Kim, T. (2025). Spatial omics in clinical research: A comprehensive review of technologies and guidelines for applications. International Journal of Molecular Sciences, 26(9), 3949. https://doi.org/10.3390/ijms26093949

Lewis, S. M., Marx, V., & Zhao, Y. (2021). Spatial genomics, transcriptomics, and proteomics deconstruct tumor molecular architecture. Cancer Cell, 39, 446–463.

Li, Z., Qu, S., Liang, H., et al. (2025). Integrative deep learning of spatial multi-omics with SWITCH. Nature Computational Science, 5(11), 1051–1063.

Lin, M., Guo, J., Gu, Z., Tang, W., Tao, H., You, S., Jia, D., Sun, Y., & Jia, P. (2025). Machine learning and multi-omics integration: Advancing cardiovascular translational research and clinical practice. Journal of Translational Medicine, 23, 388.

Liu, X., Peng, T., Xu, M., Lin, S., Hu, B., Chu, T., Liu, B., Xu, Y., Ding, W., Li, L., Cao, C., & Wu, P. (2024). Spatial multi-omics: Deciphering the technological landscape of integration of multi-omics and its applications. Journal of Hematology & Oncology, 17(1), 72. https://doi.org/10.1186/s13045-024-01596-9

Liu, Y., Yang, M., Deng, Y., Su, G., Enninful, A., Guo, C. C., Tebaldi, T., Zhang, D., Kim, D., Bai, Z., & Fan, R. (2020). High-spatial-resolution multi-omics sequencing via deterministic barcoding in tissue. Cell, 183(6), 1665–1681. https://doi.org/10.1016/j.cell.2020.10.026

Long, Y., Ang, K. S., Sethi, R., et al. (2024). Deciphering spatial domains from spatial multi-omics with SpatialGlue. Nature Methods, 21(9), 1658–1667.

Luo, B., Teng, F., Tang, G., et al. (2025). StereoMM: A graph fusion model for integrating spatial transcriptomic data and pathological images. Briefings in Bioinformatics, 26(3), bbaf210.

Marconato, L., Palla, G., Yamauchi, K. A., Virshup, I., Heidari, E., Treis, T., Vierdag, W. M., Toth, M., Stockhaus, S., Shrestha, R. B., & Stegle, O. (2025). SpatialData: An open and universal data framework for spatial omics. Nature Methods, 22(1), 58–62. https://doi.org/10.1038/s41592-024-02212-x

Martin, A. R., Kanai, M., Kamatani, Y., Okada, Y., Neale, B. M., & Daly, M. J. (2019). Clinical use of current polygenic risk scores may exacerbate health disparities. Nature Genetics, 51(4), 584–591. https://doi.org/10.1038/s41588-019-0379-x

McKellar, D. W., et al. (2023). Spatial mapping of the total transcriptome by in situ polyadenylation. Nature Biotechnology, 41, 513–520.

Miao, J., Li, J., Xin, J., Tu, J., Ge, M., et al. (2025). MultiGATE: Integrative analysis and regulatory inference in spatial multi-omics data via graph representation learning. Nature Communications, 16, 9403.

Moffitt, J. R., Lundberg, E., & Heyn, H. (2022). The emerging landscape of spatial profiling technologies. Nature Reviews Genetics, 23(12), 741–759.

Mohr, A. E., Ortega-Santos, C. P., Whisner, C. M., Klein-Seetharaman, J., & Jasbi, P. (2024). Navigating challenges and opportunities in multi-omics integration for personalized healthcare. Biomedicines, 12(7), 1496. https://doi.org/10.3390/biomedicines12071496

Paik, D. T., Cho, S., Tian, L., Chang, H. Y., & Wu, J. C. (2020). Single-cell RNA sequencing in cardiovascular development, disease and medicine. Nature Reviews Cardiology, 17(8), 457–473.

Palaganas, R., Sidiropoulos, D. N., Morris, M., & Stein-O'Brien, G. L. (2026). Mapping multipathology via spatial omic integration. Current Opinion in Biotechnology, 97, 103398. https://doi.org/10.1016/j.copbio.2025.103398

Picard, M., Scott-Boyer, M.-P., Bodein, A., Périn, O., & Droit, A. (2021). Integration strategies of multi-omics data for machine learning analysis. Computational and Structural Biotechnology Journal, 19, 3735–3746.

Privé, F., Aschard, H., Carmi, S., Folkersen, L., Hoggart, C., O'Reilly, P. F., & Vilhjálmsson, B. J. (2021). Portability of polygenic scores across populations and cohorts. Nature Communications, 12, 2045.

Radha, S., & Marda, S. (2025). Bioinformatics and multi-omics integration in personalized medicine. Journal of Modern Technology and Biological Sciences, 2(4), 14–23.

Roelands, J., et al. (2023). Spatial profiling of the macrophage immune microenvironment in colorectal cancer liver metastasis using imaging mass cytometry. Journal of Clinical Oncology, 41, 3515.

Sahu, P., Satapathy, A., Satapathy, A., & Satapathy, T. (2026). Single-cell multi-omics for biomarker discovery: Technologies, molecular mechanisms, applications and translational challenges. Letters in Drug Design & Discovery, 22(2), 100286.

scGPT-spatial. (2025). scGPT-spatial: Continual pretraining for spatial domain identification [Software documentation and methods reference].

Shanmugam, Y., & Ravikumar, L. (2026). Narrative review of multi-omics biomarker and biosensing literature. Advances in Biomarker Sciences and Technology, 8, 464–478. https://doi.org/10.1016/j.abst.2026.05.007

Srivastava, A., & Singh, R. (2024). Spatial metabolomics and lipidomics: Bridging molecular flux and tissue pathology [Journal article].

Ståhl, P. L., Salmén, F., & Vickovic, S. (2016). Visualization and analysis of gene expression in tissue sections by spatial transcriptomics. Science, 353(6294), 78–82. https://doi.org/10.1126/science.aaf2403

Sun, C., Li, T., Song, X., Huang, L., Zang, Q., Xu, J., Bi, N., Jiao, G., Hao, Y., Chen, Y., Zhang, R., Luo, Z., Li, X., Wang, L., Wang, Z., Song, Y., He, J., & Abliz, Z. (2019). Spatially resolved metabolomics to discover tumor-associated metabolic alterations. Proceedings of the National Academy of Sciences, 116(1), 52–57.

Theodoris, C. V., Xiao, L., Chopra, A., Chaffin, M. D., Al Sayed, Z. R., Hill, M. C., Mantineo, H., Brydon, E. M., Zeng, Z., Liu, X. S., & Ellinor, P. T. (2023). Transfer learning enables predictions in network biology. Nature, 618, 616–624.

Wang, X., & Fan, J. (2021). Spatiotemporal molecular medicine: A new era of clinical and translational medicine. Clinical and Translational Medicine, 11(1), e294.

Wu, X., Xu, W., Deng, L., Cao, G., & Dai, J. (2026). A guide for spatial omics technologies. Advanced Science, 2026. https://doi.org/10.1002/advs.202520806

Wu, Y., Cheng, Y., Wang, X., Fan, J., & Gao, Q. (2022). Spatial omics: Navigating to the golden era of cancer research. Clinical and Translational Medicine, 12(1), e696. https://doi.org/10.1002/ctm2.696

Yang, J., et al. (2022). Phenotypic screening with deep learning identifies HDAC6 inhibitors as cardioprotective in a BAG3 mouse model of dilated cardiomyopathy. Science Translational Medicine, 14, eabl5654.

Zehra, B., Alasrawi, S., Almansoori, S., Al-Ali, A., & Bhat, K. B. (2026). Multiomics approaches to cardiovascular disease: Linking molecular resolution to clinical translation. American Journal of Physiology-Heart and Circulatory Physiology, 2026. https://doi.org/10.1152/ajpheart.2026


Article metrics
View details
0
Downloads
0
Citations
14
Views

View Dimensions


View Plumx


View Altmetric


0
Save
0
Citation
14
View
0
Share