Integrative Biomedical Research

Integrative Biomedical Research (Journal of Angiotherapy) | Online ISSN  3068-6326
463
Citations
2m
Views
801
Articles
Your new experience awaits. Try the new design now and help us make it even better
Switch to the new experience
Figures and Tables
REVIEWS   (Open Access)

Computational Design of Protein-Based Diagnostic Assays for Early Cancer Detection: Platforms, Algorithms, and the Road to Clinical Translation

Khaldoon Mustansir 1*

+ Author Affiliations

Integrative Biomedical Research 10 (2) 1-8 https://doi.org/10.25163/biomedical.10210970

Submitted: 18 August 2026 Revised: 08 October 2026  Published: 16 October 2026 


Abstract

Most cancers are still found late, when cure is the exception rather than the rule. Imaging-based screening and single serum markers such as PSA, CA 125, and CEA have helped, but their false-positive rates and weak sensitivity for localized disease leave a wide gap, and blood-based protein profiling offers one plausible way to narrow it. This review examines how computational design is reshaping protein diagnostics, from discovery to the regulatory desk. We describe the analytical platforms used to interrogate the circulating proteome, including data-dependent and data-independent mass spectrometry, proximity extension assays, aptamer arrays, functional protein microarrays, and extracellular vesicle isolation systems, weighing their sensitivity, dynamic range, and throughput against a plasma proteome that spans twelve or more orders of magnitude. We then follow the algorithmic chain that turns thousands of noisy measurements into a compact, locked decision rule: penalized regression, recursive feature elimination, ensemble and neural classifiers, decision fusion, explainable artificial intelligence, and resampling-based validation. Representative panels are synthesized for multi-cancer early detection and for lung, colorectal, esophageal, and liver cancers; several report areas under the curve above 0.95 and encouraging stage I sensitivity, although most derive from case–control designs that probably flatter real-world performance. Finally, we consider what tends to stall translation: pre-analytical variability, high-abundance protein masking, overfitting, incomplete TRIPOD and REMARK reporting, and the demands of FDA 510(k), De Novo, and premarket approval pathways. Computationally designed multi-protein panels look promising, but their clinical value will depend on prospective, population-based validation rather than further gains in retrospective accuracy.

Keywords: early cancer detection; liquid biopsy; plasma proteomics; multi-protein biomarker panel; machine learning; proximity extension assay; mass spectrometry; extracellular vesicles; multi-cancer early detection; regulatory science.

1. Introduction

Cancer kills, in large part, because it is found too late. By the time many malignancies announce themselves through symptoms, they have often spread beyond the point where surgery or other local treatment can reasonably promise a cure, and the therapeutic options that remain are more about control than eradication (Füzéry et al., 2013; Neagu et al., 2025). Early detection, by contrast, is perhaps the most consistently effective lever we have: tumors caught while still localized, or even pre-invasive, are associated with markedly better long-term survival than those treated after distant spread (Misek & Kim, 2011; Wulfkuhle et al., 2003). The difficulty, of course, lies in finding them.

Current screening programs lean heavily on imaging and, when something suspicious appears, on tissue biopsy. Both have earned their place, yet neither is quite fit for the task of catching small, asymptomatic disease across a whole population. Screening mammography returns false-positive results in roughly one in ten examinations, and low-dose computed tomography (LD-CT) for lung cancer has been reported to do so in as many as a third of cases (Held et al., 2025; Misek & Kim, 2011). Each false alarm carries a cost, whether measured in patient anxiety, avoidable invasive work-up, or simply money. Classical serum markers fare little better as stand-alone screening tools. Prostate-specific antigen (PSA), cancer antigen 125 (CA 125), and carcinoembryonic antigen (CEA) are useful in particular clinical settings, but when used alone for early-stage screening they lack the sensitivity and specificity required, and they rise all too readily in benign or inflammatory conditions (Bhawal et al., 2020; Ding et al., 2022; Neagu et al., 2025).

It is against this background that the so-called liquid biopsy has attracted so much attention. Rather than sampling a lesion directly, a liquid biopsy interrogates circulating biofluids, such as plasma, serum, urine, or the extracellular vesicles (EVs) suspended within them, in the hope of reading tumor-derived signals from a simple blood draw (Bhawal et al., 2020; Ding et al., 2022). Much of the early momentum in this field came from circulating nucleic acids. Proteins, however, offer something slightly different. They are the functional executors of both normal physiology and malignant behavior, so the circulating proteome may provide a more direct, real-time view of tumor–host interaction, early oncogenic signaling, and the systemic immune response than genomic material alone (Bhawal et al., 2020; Hanash et al., 2008; Neagu et al., 2025). That argument is attractive, though it is worth admitting that it has proved harder to exploit in practice than in principle.

Part of the difficulty is that no single protein seems capable of carrying the diagnostic load on its own. The field has therefore moved, gradually and with some false starts, from single-analyte measurements towards multi-protein panels whose composition and decision rules are worked out computationally (Ahamed et al., 2024; Held et al., 2025; Wulfkuhle et al., 2003). This shift was made possible by high-plex analytical platforms, notably mass spectrometry (MS) and affinity-based arrays, which can now measure hundreds to thousands of proteins from microlitre volumes (Ding et al., 2022; Huang & Zhu, 2017). Yet more measurements bring their own trouble. Blood protein concentrations span up to twelve orders of magnitude, a handful of abundant proteins mask the faint signals shed by early lesions, and the resulting datasets typically contain far more variables than patients, a setting in which spurious patterns are easy to find and hard to reproduce (Ahn et al., 2019; Bhawal et al., 2020; Budnik et al., 2024). Machine learning, feature selection, and careful validation have become indispensable to separating signal from noise (Neagu et al., 2025; Orive et al., 2024).

Even when a promising signature emerges, the road to the clinic is long. Thousands of candidate protein biomarkers have been published, but very few have reached routine practice, a gap often described as the biomarker "tar pit" (Boja et al., 2011; Füzéry et al., 2013). Inadequate study design, poorly matched controls, pre-analytical variability, and overfitting all contribute (Bhawal et al., 2020; Orive et al., 2024). Discovery platforms are also rarely suitable for high-throughput clinical laboratories, which is why a two-phase strategy, in which high-dimensional screening is followed by conversion into targeted, affordable assays, has become the norm (Füzéry et al., 2013; Huang & Zhu, 2017). Any test that survives this process must then demonstrate analytical and clinical performance within regulatory pathways such as the US Food and Drug Administration (FDA) 510(k) or premarket approval (PMA) routes (Boja et al., 2011; Füzéry et al., 2013).

This review attempts to draw these threads together. Our aims are fourfold. First, we evaluate the computational and machine-learning methods, from penalized regression and recursive feature elimination to ensemble, neural, and rule-based classifiers, that are used to assemble multi-protein diagnostic algorithms while limiting overfitting. Second, we compare the principal discovery and targeted platforms, including data-dependent and data-independent MS, parallel reaction monitoring, proximity extension assays, aptamer arrays, and EV-based methods, in terms of sensitivity, dynamic range, and throughput. Third, we synthesize the evidence for computationally derived panels in individual cancers (lung, colorectal, esophageal, and liver) and in multi-cancer early detection (MCED). Fourth, we consider the translational and regulatory hurdles, including analytical validation, pre-analytical standardization, TRIPOD and REMARK reporting, and FDA pathways, that ultimately decide whether any of this reaches patients. We do not claim to resolve these questions; we hope, rather, to make clearer where the evidence is solid and where it is still provisional.

2. Protein Biomarker Panels and Machine Learning for Multi-Cancer Early Detection from Liquid Biopsy

2.1 The Clinical Imperative and the Shift Towards Liquid Biopsy

There is broad agreement that intervening while a tumor is still confined to its site of origin gives patients a far better chance of long-term survival than treatment after metastasis (Ahn et al., 2019; Misek & Kim, 2011; Wulfkuhle et al., 2003). What is less settled is how best to identify these early tumors at scale. Conventional diagnostic pathways depend on imaging, whether film or digital mammography, magnetic resonance imaging, or LD-CT, and on invasive tissue sampling once a lesion has been seen (Held et al., 2025; Misek & Kim, 2011). These approaches work, but imperfectly. The false-positive rates mentioned above, around 10% for mammography and up to 33% for LD-CT, translate into unnecessary procedures, occasional physical harm, and considerable expense (Held et al., 2025; Misek & Kim, 2011). The traditional single-analyte serum markers, including PSA, CEA, CA 125, carbohydrate antigen 19-9 (CA 19-9), and cancer antigen 15-3 (CA 15-3), share a frustrating pattern: they are often elevated in non-malignant or inflammatory states and frequently remain normal in small, localized tumors, which is precisely where they would be most valuable (Ding et al., 2022; Misek & Kim, 2011; Neagu et al., 2025).

In response, clinical oncology has been moving, perhaps more slowly than its advocates would like, towards minimally invasive liquid biopsy (Ding et al., 2022; Neagu et al., 2025). The range of biofluids under study is wide. Plasma and serum dominate, but urine, nipple aspirate fluid, breast milk, and EVs have each been explored as windows onto systemic physiology and early tumorigenesis (Misek & Kim, 2011; Neagu et al., 2025; Wulfkuhle et al., 2003). Proteomic profiling of these fluids has a particular appeal because proteins capture aberrant signaling, tumor–host interactions, and immune responses as they happen, something static genomic DNA cannot fully do (Ahn et al., 2019; Bhawal et al., 2020; Held et al., 2025). It is therefore not surprising that computationally designed multi-protein panels are now seen as one of the more compelling frontiers for early detection, risk stratification, and tissue-of-origin (TOO) localization (Ahamed et al., 2024; Budnik et al., 2024; Wulfkuhle et al., 2003). The overall logic of this transition is summarized in Figure 1. Earlier reviews of plasma proteome mining were broadly optimistic as well, if more guarded about reproducibility (Hanash et al., 2008), and reports of novel serum protein candidates continue to accumulate (Byeon et al., 2024).

2.2 Analytical Platforms for High-Plex Discovery and Targeted Validation

The technologies used to discover and verify protein biomarkers have multiplied over the past two decades (Ding et al., 2022; Huang & Zhu, 2017). Mass spectrometry has been the backbone of untargeted discovery. Its trajectory runs from two-dimensional polyacrylamide gel electrophoresis through high-resolution liquid chromatography–tandem MS (LC-MS/MS), with data-dependent acquisition (DDA), data-independent acquisition (DIA, including SWATH-MS), and parallel reaction monitoring (PRM) each adding depth, reproducibility, or quantitative precision (Ahn et al., 2019; Che et al., 2021; Wulfkuhle et al., 2003). More recent instruments, such as the timsTOF Pro, couple trapped ion mobility spectrometry with parallel accumulation–serial fragmentation (prm-PASEF) and appear to allow faster, deeper, and more reproducible multiplexed quantification in complex biofluids (Brzhozovskiy et al., 2022; Neagu et al., 2025). Earlier platforms deserve mention, if only as cautionary tales. Surface-enhanced laser desorption/ionization time-of-flight (SELDI-TOF) ProteinChip arrays generated much excitement by detecting serum and nipple aspirate patterns, for example peaks at m/z 4276, 4292, and 8941 in breast cancer, but limited dynamic range and the difficulty of identifying the underlying proteins ultimately held them back (Misek & Kim, 2011; Tomizaki et al., 2010; Verma et al., 2001; Wulfkuhle et al., 2003).

Affinity-based technologies have, in parallel, transformed what is possible at high plex. Functional human proteome microarrays such as HuProt v3.0, which carries more than 20,240 full-length human proteins (roughly three-quarters of the proteome), allow unbiased screening of tumor-associated autoantibodies and serological immune responses (Huang & Zhu, 2017; Kijanka & Murphy, 2009). Slow off-rate modified aptamers (SOMAmers) take a different route, using chemically modified single-stranded nucleic acids with photocleavable linkers to quantify up to about 7,000 proteins simultaneously across a 4–5 log
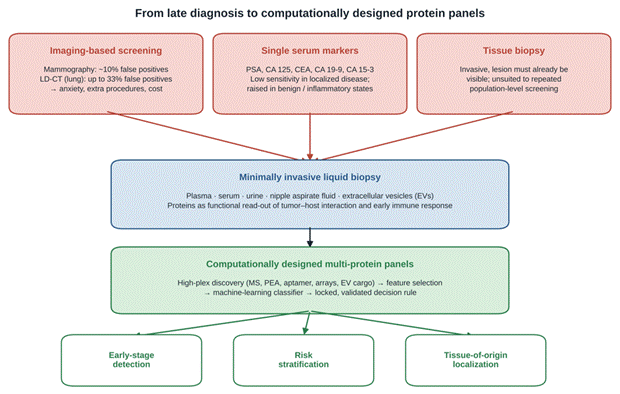
Figure 1. Clinical rationale for moving from conventional screening towards computationally designed protein panels in liquid biopsy. The upper row summarizes the main limitations of current approaches: false-positive imaging results (about 10% for mammography and up to 33% for low-dose CT), poor early-stage sensitivity and specificity of single serum markers, and the invasiveness of tissue biopsy. These limitations motivate minimally invasive sampling of biofluids and extracellular vesicles (middle), in which proteins act as a functional read-out of tumor–host interaction. High-plex measurement combined with feature selection and machine learning yields locked multi-protein decision rules (lower middle) that support three clinical outputs: early-stage detection, risk stratification, and tissue-of-origin localization. Content synthesized from Ding et al. (2022), Held et al. (2025), Misek and Kim (2011), and Neagu et al. (2025).
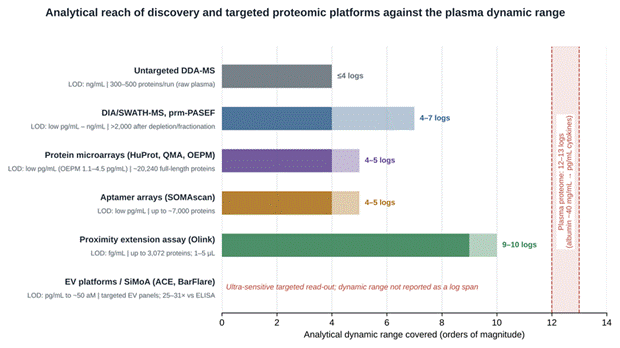
Figure 2. Analytical reach of discovery and targeted proteomic platforms relative to the dynamic range of the plasma proteome. Horizontal bars show the dynamic range reported for each platform family in orders of magnitude; darker segments mark the lower bound and lighter segments the upper bound of the reported range. Labels beneath each platform give the reported limit of detection (LOD) and approximate multiplexing capacity. The shaded band at 12–13 logs marks the concentration span of plasma proteins, from albumin (~40 mg/mL) to picogram-per-millilitre cytokines, illustrating why only wide-range or enrichment-based methods approach the low-abundance tier where early-detection markers appear to reside. EV and single-molecule platforms are shown without a bar because their performance is reported as LOD rather than as a log span. Data from Table 1 and the sources cited there; bars are not drawn to an absolute concentration scale.

dynamic range (Candia et al., 2022; Ding et al., 2022). Proximity extension assays (PEA, commercialized by Olink) rely on pairs of antibodies, each linked to a complementary DNA oligonucleotide; only when both antibodies bind the same target are the oligonucleotides close enough to hybridize and be extended by DNA polymerase, producing an amplicon that is read by quantitative PCR or next-generation sequencing (Ding et al., 2022; Klebes et al., 2024; Orive et al., 2024). This dual-recognition step largely eliminates the cross-reactivity that plagues conventional multiplex immunoassays, and PEA needs only 1–5 µL of sample to cover a 9–10 log dynamic range with femtogram-per-millilitre sensitivity (Ding et al., 2022; Orive et al., 2024; Petrera et al., 2021). When PEA, LC/MRM-MS, quantibody microarrays (QMA), and immunome protein arrays (IpA) were compared directly in clinical blood samples, the dual-recognition approaches (PEA and MRM-MS) seemed to offer better specificity and diagnostic performance (Bhardwaj et al., 2021). The relative reach of these platforms is illustrated in Figure 2 and detailed in Table 1.

Cell-free plasma proteins are not the only source of signal. Tumor-derived EVs and exosomes carry protein cargo that is, to some extent, shielded from proteolysis and may be enriched for tumor-specific content (Hinestrosa et al., 2022; Wang et al., 2026). Conventional differential ultracentrifugation, however, is slow (around four hours), can damage vesicles, and co-precipitates soluble proteins. Newer approaches, including alternating current electrokinetics (ACE, on the Verita platform) and the BarFlare microfluidic system, aim to isolate EVs rapidly and with higher purity directly from plasma (Hinestrosa et al., 2022; Wang et al., 2026). Single-molecule arrays (SiMoA) push detection limits further still, reaching attomolar concentrations for some serum proteins (Rissin et al., 2010). Whether such sensitivity will translate into routine clinical benefit remains, for now, an open question.

2.3 Biological Complexity, Dynamic Range, and Sample Preparation

For all these advances, blood remains a difficult matrix. Protein concentrations in plasma span some 12–13 orders of magnitude, from serum albumin at roughly 40.6 mg/mL down to cytokines and tissue-leakage proteins at low picogram-per-millilitre levels (Ahn et al., 2019; Bhawal et al., 2020; Ding et al., 2022). Albumin, immunoglobulins, and acute-phase reactants together account for more than 90% of total plasma protein mass, and they tend to swamp the scarce, tissue-specific proteins that early neoplastic lesions might leak into the circulation (Ahn et al., 2019; Che et al., 2021).

Laboratories have responded with increasingly elaborate sample preparation. In one colorectal cancer study, high-abundance protein depletion on MARS-14 columns was combined with a second, in-house immunodepletion step (API) and multidimensional peptide fractionation by strong cation exchange, strong anion exchange, high-pH reversed-phase, and size-exclusion chromatography; together these steps expanded coverage to more than 513 quantifiable plasma proteins spanning about ten orders of magnitude (Ahn et al., 2019). This kind of deep profiling also surfaced previously unreported low-abundance proteins, among them MEGF8, CRISP3, TRIM33, and ADAMDEC1, which participate in cell adhesion, extracellular matrix remodeling, and TGF-β signaling (Ahn et al., 2019). The cost, though, is a workflow that is labor-intensive and, perhaps inevitably, prone to co-depletion artifacts.

A somewhat counterintuitive message runs through this literature: the most informative early-detection markers may live in the lowest concentration tiers of the proteome (Budnik et al., 2024; Ding et al., 2022). In a 3,072-protein PEA study of 18 solid tumor types, nine of the ten proteins selected for the diagnostic panel required no sample dilution, which the authors interpreted as evidence that ultra-low-abundance proteins act as sensitive footprints of small, localized tumors, detectable before broader physiological disruption sets in (Budnik et al., 2024). That interpretation is plausible, though it rests on a single proof-of-concept cohort and would benefit from independent confirmation.

2.4 Computational Workflows, Feature Selection, and Machine-Learning Classifiers

High-plex profiling produces datasets in which the number of measured proteins (p) vastly exceeds the number of samples (n). In this p ≫ n setting, overfitting and false discovery are not occasional hazards but default outcomes unless they are actively guarded against (Ahn et al., 2019; Brito-Rocha et al., 2023). Robust diagnostic signatures therefore depend on a chain of feature selection, supervised classification, and cross-validation (Ahamed et al., 2024; Bhawal et al., 2020; Brito-Rocha et al., 2023), a workflow summarized in Figure 3.

Feature selection is the first, and arguably most
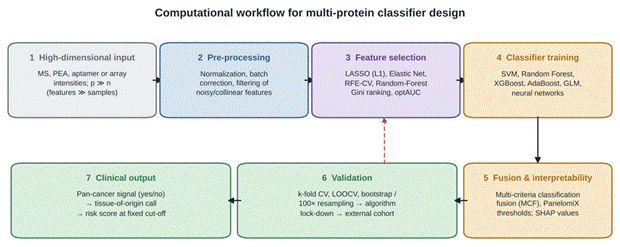
Figure 3. Computational workflow for the design and validation of multi-protein diagnostic classifiers. The workflow proceeds from high-dimensional proteomic input, in which features greatly outnumber samples (p ≫ n), through pre-processing, feature selection (LASSO, elastic net, recursive feature elimination with cross-validation, random-forest ranking, optAUC), and classifier training (support vector machines, ensembles, neural networks). Outputs may be combined by multi-criteria classification fusion and interpreted with SHAP values before resampling-based internal validation, algorithm lock-down, and external validation. The final clinical output is typically a two-step call, cancer signal present or absent followed by tissue-of-origin assignment, at a pre-specified cut-off. The dashed arrow indicates the return to feature selection when performance fails to hold on resampling or external data. Synthesized from Ahamed et al. (2024), Hinestrosa et al. (2022), Trivedi et al. (2020), and Wang et al. (2026).
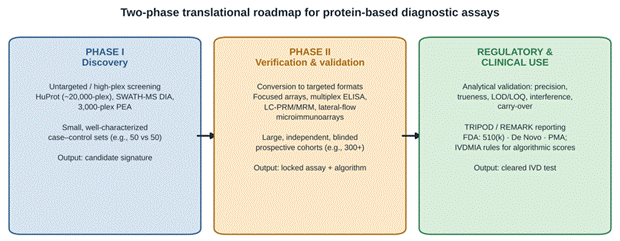
Figure 4. Two-phase translational roadmap and regulatory gateways for protein-based cancer diagnostic assays. In Phase I, untargeted or high-plex platforms (HuProt arrays, SWATH-MS, 3,000-plex PEA) screen small, well-characterized case–control sets to nominate a candidate signature. In Phase II, the candidates are transferred to targeted, affordable formats (focused arrays, multiplex ELISA, LC-PRM/MRM, lateral-flow microimmunoarrays) and validated in large, independent, blinded prospective cohorts, yielding a locked assay and algorithm. The regulatory stage requires analytical validation, TRIPOD- and REMARK-compliant reporting, and an FDA pathway (510(k), De Novo, or PMA), with in vitro diagnostic multivariate index assay rules applying to algorithmic scores. The lower band lists cross-cutting threats that contribute to the biomarker "tar pit". Adapted from Boja et al. (2011), Füzéry et al. (2013), Huang and Zhu (2017), and Pepe et al. (2001).

consequential, link. Penalized regression methods such as the least absolute shrinkage and selection operator (LASSO), which applies an L1 penalty that shrinks unhelpful coefficients to exactly zero, and the elastic net, which combines L1 and L2 penalties, enforce sparsity and discard collinear variables (Ahamed et al., 2024; Budnik et al., 2024; El-Khoury et al., 2020; Tibshirani, 1996). Tree-based ranking offers a complementary, non-linear view. Random-forest Gini impurity reduction and recursive feature elimination with cross-validation (RFE-CV) evaluate feature importance across resampled subsets and can be tuned to maximize the partial area under the receiver operating characteristic curve (pAUC) in the high-specificity region that matters most for screening (Hinestrosa et al., 2022; Trivedi et al., 2020). Non-parametric approaches that optimize the AUC directly (optAUC) have also been used to assemble compact panels (Ahamed et al., 2024).

The selected proteins are then combined into a predictive model. Support vector machines (SVM), random forests, extreme gradient boosting (XGBoost), adaptive boosting (AdaBoost), generalized linear models, and artificial neural networks have all been applied to separate cancer cases from controls, each with its own balance of flexibility and interpretability (Ahamed et al., 2024; Ahn et al., 2019; Brito-Rocha et al., 2023; Wang et al., 2026). One interesting development is multi-criteria decision-making classification fusion (MCF), which pools the outputs of several strong base models, for instance gradient boosting, XGBoost, and AdaBoost, in a manner its developers liken to a multidisciplinary tumor board, reducing dependence on any single algorithm (Wang et al., 2026). Explainable artificial intelligence has followed close behind. Shapley additive explanations (SHAP) quantify how much each feature contributes to an individual prediction and in which direction, turning what would otherwise be a "black box" into something a clinician can at least interrogate (Wang et al., 2026).

These computational tools underpin the current generation of MCED tests, which aim both to detect a cancer signal and to localize its TOO (Brito-Rocha et al., 2023; Budnik et al., 2024; Held et al., 2025; Hinestrosa et al., 2022). A 16-parameter panel combining extracellular protein kinase A (xPKA) activity, secondary kinase activities, and cancer-associated IgG and IgM autoantibodies reportedly achieved 100% sensitivity for stage I cancers across five organs (breast, lung, colorectal, ovary, and pancreas), with 97% specificity and 98% TOO accuracy (Held et al., 2025). A sex-specific 10-protein PEA panel detected 18 solid tumor types with an AUC of about 0.98, and a companion 150-protein panel assigned TOO in more than 80% of cases (Budnik et al., 2024). A 13-protein EV panel obtained through ACE isolation detected stage I–II pancreatic, ovarian, and bladder cancers with 71.2% sensitivity at 99.5% specificity (AUC 0.95) (Hinestrosa et al., 2022). Perhaps most striking, in longitudinal cohorts an MCF model built on EV proteins flagged individuals who later developed esophageal squamous cell carcinoma (ESCC) a median of 34.9 months before clinical diagnosis (Wang et al., 2026). These figures are impressive. Whether they hold up in unselected screening populations is another matter, to which we return in the Discussion.

2.5 Methodological Standardization, Translational Bottlenecks, and Regulation

The disconnect between discovery and clinical adoption has been remarked upon for at least two decades (Boja et al., 2011; Misek & Kim, 2011; Wulfkuhle et al., 2003). The obstacles are familiar: pre-analytical inconsistencies in centrifugation, hemolysis, and freeze–thaw cycles; co-depletion artifacts introduced during removal of abundant proteins; biological heterogeneity; and overfitting in small, unrepresentative cohorts (Ahn et al., 2019; Bhawal et al., 2020; Orive et al., 2024). Large consortium efforts and phased frameworks for biomarker development, which distinguish preclinical exploration from clinical assay development, retrospective longitudinal studies, prospective screening, and finally population-level impact, were proposed precisely to impose order on this process (Pepe et al., 2001).

In practice, a two-phase development pathway is now widely recommended (Huang & Zhu, 2017). During discovery (Phase I), untargeted, proteome-wide platforms such as HuProt arrays with around 20,000 features, SWATH-MS DIA, or high-plex PEA are used to screen small, well-characterized case–control sets for candidate signatures (Huang & Zhu, 2017). During validation and translation (Phase II), the candidates are moved onto targeted, high-throughput, lower-cost formats, such as focused microarrays, multiplex enzyme-linked immunosorbent assays (ELISA), targeted LC-PRM, or point-of-care lateral-flow microimmunoarrays, and tested in large, blinded, prospective cohorts (Che et al., 2021; Huang & Zhu, 2017; Yonet-Tanyeri et al., 2022). This roadmap, together with its regulatory end-points, is depicted in Figure 4.

Transparent reporting is the other pillar. The TRIPOD statement (Transparent Reporting of a multivariable prediction model for Individual Prognosis Or Diagnosis) and the REMARK recommendations (REporting recommendations for tumor MARKer prognostic studies) set out what investigators should disclose so that others can judge, and ideally reproduce, their models (Collins et al., 2015; Moons et al., 2015; Sauerbrei et al., 2018). Finally, converting a computationally designed assay into a cleared in vitro diagnostic (IVD) device demands comprehensive analytical validation, covering precision, trueness, limit of detection, and cross-reactivity, together with evidence of clinical utility submitted through the FDA 510(k), De Novo, or PMA pathways (Boja et al., 2011; Held et al., 2025; Orive et al., 2024). Earlier blood-based colorectal cancer panels (Fung et al., 2015) are a reminder of how much additional validation usually separates an encouraging discovery result from a test that can be offered to patients.

3. Methods

3.1 Review Design

This work was conducted as a structured narrative (state-of-the-art) review. A narrative design was chosen deliberately over a formal systematic review with meta-analysis, because the evidence base is unusually heterogeneous: it mixes analytical platform evaluations, single-cancer and multi-cancer diagnostic studies, methodological work on machine learning, and regulatory guidance documents, and these do not lend themselves to pooled quantitative estimates. We nevertheless tried to borrow as much discipline as possible from systematic methods, including a pre-specified search strategy, explicit eligibility criteria, duplicate screening, and a standardized extraction form, so that the process could be followed and, if needed, repeated by others.

3.2 Information Sources and Search Strategy

PubMed/MEDLINE, Scopus, and Web of Science Core Collection were searched from January 2000 to June 2026. The lower limit was chosen because it marks the introduction of the LASSO estimator (Tibshirani, 1996), which, with its successors, underpins much of the computational work reviewed here; earlier landmark papers were captured through citation tracking. The search combined controlled vocabulary (MeSH terms in PubMed) and free-text terms covering four concept blocks, joined by the Boolean operator AND:

  • Disease and purpose: ("neoplasms"[MeSH] OR cancer* OR tumor* OR tumour* OR malignan*) AND ("early detection of cancer"[MeSH] OR "early detection" OR screening OR "early diagnosis" OR "multi-cancer")

  • Analyte and specimen: (protein* OR proteom* OR "protein biomarker*" OR autoantibod* OR "extracellular vesicle*" OR exosom*) AND (plasma OR serum OR blood OR "liquid biopsy" OR urine)

  • Platform: ("mass spectrometry" OR "data-independent acquisition" OR SWATH OR "parallel reaction monitoring" OR "proximity extension" OR Olink OR SOMAscan OR aptamer* OR "protein microarray*" OR HuProt OR "single molecule array*")

  • Computational design: ("machine learning" OR "artificial intelligence" OR LASSO OR "elastic net" OR "random forest" OR "support vector" OR XGBoost OR "neural network*" OR "feature selection" OR classifier* OR "prediction model*")

The search strings were adapted to the syntax of each database. Reference lists of all included articles and of key reviews were then screened by hand (backward citation chasing), and articles citing the included studies were identified through database citation tools (forward citation chasing). Reporting guidelines and regulatory frameworks relevant to diagnostic prediction models, specifically TRIPOD and REMARK and the phased model of biomarker development, were identified purposively, since they are not primary diagnostic studies but are needed to appraise them (Collins et al., 2015; Moons et al., 2015; Pepe et al., 2001; Sauerbrei et al., 2018).

3.3 Eligibility Criteria

Studies were eligible if they met all of the following conditions: (a) they involved human biofluids (plasma, serum, urine, nipple aspirate fluid, or EVs derived from these fluids); (b) the analyte was protein-based, including protein abundance, enzymatic activity, or tumor-associated autoantibodies; (c) the stated purpose was early detection, screening, diagnosis, risk stratification, or TOO assignment of solid cancers; and (d) they either reported diagnostic performance for a multi-protein panel derived with an explicit statistical or machine-learning procedure, or evaluated the analytical characteristics of a platform used for that purpose. Narrative and methodological reviews, consensus statements, and regulatory analyses were retained as contextual sources when they addressed platform performance, study design, or translation.

Studies were excluded if they (a) analyzed tissue only, without a circulating counterpart; (b) relied exclusively on nucleic acid markers (for example, cell-free DNA methylation) without a protein component; (c) were conference abstracts, editorials, or preprints without sufficient methodological detail; or (d) were not available in English. Studies whose primary end-point was prognostic were not included as diagnostic evidence but were occasionally retained to illustrate a platform or workflow (Che et al., 2021).

3.4 Study Selection

Records retrieved from all sources were exported to a reference manager  and duplicates were removed automatically and then checked manually. Two reviewers independently screened titles and abstracts against the eligibility criteria, after which the full texts of potentially relevant records were assessed by the same two reviewers. Disagreements were resolved by discussion and, where necessary, by a third reviewer. The numbers of records identified, screened, excluded (with reasons), and finally included should be reported here and, In the end, 38 sources were cited in this review, of which the diagnostic panel studies summarized in Table 2 formed the core quantitative evidence.

3.5 Data Extraction

Data were extracted into a piloted, standardized spreadsheet by one reviewer and verified by a second. For diagnostic panel studies, the following items were recorded: first author and year; cancer type(s) and clinical indication; specimen type; analytical platform; number of candidate features screened and number retained in the final panel; panel composition; feature-selection method; classifier type; validation strategy (apparent, internal resampling such as k-fold cross-validation, leave-one-out cross-validation, or bootstrapping, or external validation in an independent cohort); cohort size and case–control composition; stage distribution; and performance metrics, namely AUC with confidence interval, sensitivity, specificity, sensitivity at a fixed specificity, positive and negative predictive values, TOO accuracy, and, where reported, preclinical lead time. For platform studies, we extracted the assay principle, target class, plex, dynamic range, limit of detection, sample volume, throughput, and principal limitations. For computational studies, we extracted the algorithm, its mathematical principle, its intended role in the workflow, and the measures taken to limit overfitting. For translational and regulatory sources, we extracted the requirement or guideline, the challenge it addresses, and the recommended mitigation. Performance figures were recorded exactly as published; we did not recalculate metrics or impute missing values, and where only ranges were reported, ranges are presented.

3.6 Evidence Classification and Appraisal

Because a formal risk-of-bias score would have been difficult to apply consistently across such different study types, we appraised the diagnostic studies against three anchors. First, each study was placed within the five-phase framework of biomarker development proposed by Pepe et al. (2001), from preclinical exploration (Phase 1) to prospective screening and population impact (Phases 4–5). Second, the reporting of each prediction model was checked against core TRIPOD items, particularly whether discrimination and calibration were both reported, whether the validation was internal or external, and whether the model was locked before testing (Collins et al., 2015; Moons et al., 2015). Third, we noted design features known to inflate apparent accuracy, including case–control sampling with healthy rather than clinically relevant controls, reuse of training samples for testing, small sample size relative to the number of candidate features, and absence of an independent validation cohort (Bhawal et al., 2020; Orive et al., 2024; Sauerbrei et al., 2018). These judgments were made by two reviewers, with disagreements resolved by consensus.

3.7 Synthesis

The extracted evidence was synthesized narratively and organized into four pre-defined domains: (i) analytical platforms (Table 1 and Figure 2); (ii) multi-protein diagnostic panels by cancer type (Table 2); (iii) computational modeling, feature selection, and validation frameworks (Table 3 and Figure 3); and (iv) translational, reporting, and regulatory requirements (Table 4 and Figure 4). No meta-analysis was attempted, given the heterogeneity in populations, platforms, reference standards, and outcome definitions. Where studies reported sensitivity at a fixed specificity, that operating point is stated explicitly, since it is not interchangeable with sensitivity at the Youden-optimal threshold.

4. Synthesis of Findings: Platforms, Panels, Algorithms, and Translational Readiness

Taken together, the studies reviewed here suggest that pairing computational design with high-plex proteomic profiling can produce diagnostic signatures that perform well, sometimes remarkably well, in localized (stage I–II) disease, at least within the cohorts in which they were developed. The findings fall naturally into four domains, which we take in turn: the analytical performance of the platforms themselves, the diagnostic efficacy of the resulting panels, the computational methods used to build them, and the degree to which they meet translational and regulatory expectations.

4.1 Comparative Performance of High-Plex Proteomic and Liquid Biopsy Platforms

No single platform dominates on every axis; instead, each seems to trade dynamic range, throughput, target coverage, and sensitivity against one another (Table 1; Figure 2) (Ding et al., 2022; Petrera et al., 2021; Xing et al., 2023).

4.1.1 Mass spectrometry

Untargeted DDA remains valuable for de novo discovery, but undersampling and a limited dynamic range in blood restrict how deep it can reach (Ahn et al., 2019; Ding et al., 2022). DIA, including SWATH-MS combined with hybrid spectral libraries, appears to improve matters considerably, quantifying several hundred to more than a thousand plasma or serum proteins with coefficients of variation that are typically below about 20% (Ahn et al., 2019; Xing et al., 2023). Adding ion mobility, as in timsTOF prm-PASEF, permits multiplexed absolute quantification across a 4–7 log dynamic range with performance close to that of triple-quadrupole multiple reaction monitoring (MRM) (Brzhozovskiy et al., 2022). The main penalty is the sample preparation: depletion and fractionation remain laborious, and throughput is still well below that of affinity arrays (Table 1).

4.1.2 Proximity extension assays

PEA reaches femtogram-per-millilitre sensitivity over a 9–10 log dynamic range from just 1–5 µL of unfractionated plasma or serum (Ding et al., 2022; Orive et al., 2024). Its requirement for dual antibody recognition before signal generation essentially removes non-specific cross-reactivity (Petrera et al., 2021). In a head-to-head comparison in colorectal cancer, PEA showed good agreement with LC/MRM-MS for overlapping targets such as IGFBP2, MMP9, and PON3, whereas planar QMA and IpA platforms agreed less well and discriminated cases from controls less effectively, possibly because of protein misfolding or non-specific binding on the array surface (Bhardwaj et al., 2021). PEA does, however, report relative rather than absolute quantities (normalized protein expression on a log2 scale) and is confined to targets for which validated antibody pairs exist (Table 1).

4.1.3 Functional proteome and aptamer arrays

HuProt v3.0, with 20,240 immobilized full-length proteins, and optically enhanced protein microarrays (limits of detection of 1.1–4.5 pg/mL) enable high-throughput screening for serological autoantibodies, for example IgG and IgM against p53, HRas, and ETHE1 (Huang & Zhu, 2017; Tomizaki et al., 2010). Because the humoral response amplifies the signal of a scarce tumor antigen, these arrays may pick up early disease before the antigen itself is measurable in blood (Huang & Zhu, 2017; Kijanka & Murphy, 2009). SOMAscan offers the broadest targeted coverage, at about 7,000 proteins, though its proprietary reagents and some cross-reactivity with protein homologues need to be borne in mind (Candia et al., 2022).

4.1.4 Extracellular vesicle platforms

EV protein cargo is protected from proteolytic degradation, which makes it attractive in principle (Hinestrosa et al., 2022). In practice, ultracentrifugation takes about four hours and contaminates preparations with soluble IgG and albumin aggregates. ACE isolates intact EVs in under two hours without immunoaffinity reagents and reduces background IgG (Hinestrosa et al., 2022). BarFlare combines anti-CD63 capture, biotinylated detection probes, gold-nanoparticle "Transformer" amplification, and magnetic "Enricher" concentration; compared with standard ELISA it improved sensitivity roughly 25-fold for squamous cell carcinoma antigen (SCC; limit of detection 6.91 vs. 174.52 pg/mL) and 31-fold for matrix metalloproteinase-13 (MMP13; 2.99 vs. 93.00 pg/mL) (Wang et al., 2026). SiMoA, for its part, extends detection to approximately 50 aM (Rissin et al., 2010).

4.2 Diagnostic Efficacy of Multi-Protein Panels

Across published cohorts, multi-analyte signatures

Table 1. Comparative characteristics of high-plex proteomic and liquid biopsy platforms used for cancer biomarker discovery and diagnostic assay development. The table compares the five principal platform families reviewed, describing for each the analytical principle, the target class together with reported dynamic range and sensitivity, typical sample input, and the main advantages and limitations relevant to early cancer detection. Dynamic ranges are expressed in orders of magnitude (logs) and sensitivities as limits of detection (LOD), exactly as reported in the cited sources; values are platform-level approximations and vary with assay configuration and matrix. Abbreviations: ACE, alternating current electrokinetics; DDA, data-dependent acquisition; DIA, data-independent acquisition; EV, extracellular vesicle; HAP, high-abundance protein; LC-MS/MS, liquid chromatography–tandem mass spectrometry; NPX, normalized protein expression; OEPM, optically enhanced protein microarray; PEA, proximity extension assay; prm-PASEF, parallel reaction monitoring–parallel accumulation–serial fragmentation; PTM, post-translational modification; SiMoA, single-molecule array.

Platform

Analytical principle

Target class, dynamic range, and sensitivity

Sample input

Key advantages

Major limitations

References

Mass spectrometry (DDA, DIA/SWATH-MS, timsTOF prm-PASEF)

LC-MS/MS with data-dependent or data-independent acquisition; trapped ion mobility with parallel accumulation–serial fragmentation for targeted PRM/MRM quantification

Untargeted global proteome to targeted single proteins; 4–7 logs in blood; low pg/mL to ng/mL; ~300–500 proteins per run in raw plasma, >2,000 after depletion and fractionation

Microlitre volumes of plasma, serum, urine, or aspirates

De novo discovery; resolution of isoforms and PTMs; absolute quantification with isotope-labelled standards (MRM/PRM)

HAP masking; multi-step depletion and fractionation; lower throughput than affinity arrays; possible co-depletion artifacts

Ahn et al. (2019); Brzhozovskiy et al. (2022); Ding et al. (2022); Neagu et al. (2025); Xing et al. (2023)

Proximity extension assay (Olink)

Matched antibody pairs conjugated to complementary DNA oligonucleotides; dual binding enables hybridization and polymerase extension; amplicon read by qPCR or next-generation sequencing (up to 3,072-plex)

Targeted panels of up to 3,072 proteins; 9–10 logs; fg/mL to low pg/mL

1–5 µL plasma or serum

Dual recognition removes cross-reactivity; high sensitivity for low-abundance proteins without HAP depletion; minimal sample volume

Restricted to available antibody pairs; higher reagent cost; relative quantification (NPX, log2 scale)

Budnik et al. (2024); Ding et al. (2022); Orive et al. (2024); Petrera et al. (2021)

Functional proteome and antibody microarrays (HuProt, QMA, IpA, OEPM)

Recombinant full-length human proteins (HuProt v3.0, 20,240 proteins, ~75% of the proteome) or capture antibodies immobilized on slides; detection by fluorescence, metal-enhanced fluorescence, or plasmonics

Proteome-wide autoantibodies or serum proteins; 4–5 logs; low pg/mL (OEPM LOD 1.1–4.5 pg/mL)

20–50 µL serum or plasma (diluted ~1,000-fold for autoantibody profiling)

Broad coverage for serological and autoantibody screening; profiling of functional interactions and PTMs

Narrower dynamic range than PEA; possible misfolding of immobilized proteins; inter-batch variability requiring stringent normalization

Bhardwaj et al. (2021); Huang & Zhu (2017); Kijanka & Murphy (2009); Tomizaki et al. (2010)

Extracellular vesicle isolation and ultrasensitive read-out (ACE, BarFlare, SiMoA)

Rapid EV purification by ACE (Verita) or BarFlare (anti-CD63 capture, gold-nanoparticle Transformer probes, magnetic Enricher concentration); single-molecule arrays for digital read-out

EV membrane and luminal proteins; BarFlare LOD 6.91 pg/mL (SCC) and 2.99 pg/mL (MMP13) vs. 93–175 pg/mL by ELISA; SiMoA ~50 aM

Small plasma or serum volumes

~2 h processing (ACE) vs. ~4 h ultracentrifugation; avoids soluble protein and IgG co-precipitation; 25–31-fold sensitivity gain over ELISA

Requires specialized microfluidic or magnetic hardware; targeted panels only; EV methods not yet standardized

Hinestrosa et al. (2022); Rissin et al. (2010); Wang et al. (2026)

Aptamer-based proteomics (SOMAscan)

Slow off-rate modified aptamers with photocleavable linkers; target binding, ultraviolet release, and hybridization-array quantification

Up to ~7,000 proteins; 4–5 logs; low pg/mL

<50 µL serum or plasma

Very high multiplexing; high affinity; chemically stable reagents

Non-specific binding or cross-reactivity with homologues; proprietary reagent pipeline

Candia et al. (2022); Ding et al. (2022)

Table 2. Representative computationally derived multi-protein diagnostic panels for multi-cancer and organ-specific early cancer detection. Each row summarizes one panel, giving its composition, specimen and analytical platform, the feature-selection and classification approach, and the diagnostic performance reported by the original authors. Performance metrics are reproduced as published and refer to the cohorts and operating points stated; they are not directly comparable across studies because populations, control groups, stage mix, and validation strategies differ. Most panels were developed in case–control designs and correspond to Phase 1–2 of biomarker development, so real-world screening performance is likely to be lower. Abbreviations: ACE, alternating current electrokinetics; AUC, area under the receiver operating characteristic curve; CI, confidence interval; EV, extracellular vesicle; LC-PRM, liquid chromatography–parallel reaction monitoring; MCED, multi-cancer early detection; MCF, multi-criteria classification fusion; PEA, proximity extension assay; PPV, positive predictive value; RFE, recursive feature elimination; TOO, tissue of origin.

Cancer type / indication

Panel composition

Specimen and platform

Computational model

Reported diagnostic performance

Reference

MCED: 18 solid tumors

Sex-specific 10-protein detection panel plus 150-protein TOO localization panel

Plasma; Olink 3,072-plex PEA

L1-penalized (LASSO) logistic regression on 100 bootstrap samples with leave-one-out cross-validation

AUC 0.980 (men) and 0.983 (women); stage I sensitivity 93% (men) and 84% (women) at 99% specificity; TOO accuracy >80%

Budnik et al. (2024)

MCED: breast, lung, colorectal, ovarian, pancreatic

16 parameters: extracellular PKA (xPKA) activity, secondary kinase activities, cancer-associated IgG and IgM autoantibodies

Serum; enzymatic kinase assays and multiplex autoantibody immunoassay

Supervised rule-based classification with cross-reactivity (crossover) resolution logic

100% overall sensitivity; 100% stage I sensitivity (14/14 breast, 31/31 lung); 97% specificity; 98% TOO accuracy (141 cases, 119 controls)

Held et al. (2025)

MCED: EV-based (pancreatic, ovarian, bladder)

13 EV-associated proteins (including CA 19-9 and CA 125)

Plasma EVs isolated by ACE (Verita); multiplex magnetic-bead immunoassay

Logistic regression with RFE and 100× resampling cross-validation

AUC 0.95 (95% CI 0.92–0.97); stage I–II sensitivity 71.2% at 99.5% specificity (n = 323)

Hinestrosa et al. (2022)

Lung cancer: early detection

6 proteins: FLNA, TUBA4A, GSTO1, PRDX6, ARHGDIB, CDH13

Plasma; targeted LC-PRM mass spectrometry

LASSO variable selection with extensive bootstrap resampling; PanelomiX threshold selection

Discovery: AUC 0.999, PPV 0.992, sensitivity 0.992, specificity 0.989; independent validation: sensitivity 83.3–93.8%, specificity 85.7–91.8%

El-Khoury et al. (2020)

Colorectal cancer: stage I–IV

5 proteins (SAA2, APCS, APOA4, F2, AMBP) from a 37-protein candidate panel

Plasma; SWATH-MS DIA after MARS-14 and in-house IgY (API) ultradepletion

Multidimensional scaling plus shallow artificial neural network (10 hidden neurons)

Accuracy 94.0% (5-protein panel) and 99.6% (37-protein panel) vs. healthy controls

Ahn et al. (2019)

Esophageal squamous cell carcinoma

5 variables: EV SCC, EV MMP13, serum SCC, age, sex

Plasma EVs; BarFlare ultrasensitive platform

MCF integrating gradient boosting, XGBoost, and AdaBoost; SHAP interpretation

AUC 0.960–0.987 in prospective multicenter validation (n = 855); longitudinal cohort (n = 176): AUC 0.864, sensitivity 73.3%, specificity 82.2%, median lead time 34.9 months

Wang et al. (2026)

Hepatocellular carcinoma

4 proteins (P4): HABP2, CD163, AFP, PIVKA-II

Serum; DIA-MS discovery with targeted PRM verification

Multivariable panel modeling against cirrhosis and healthy controls

AUC ~0.98–0.99 across cohorts; outperformed AFP plus PIVKA-II

Xing et al. (2023)


consistently outperformed the single markers they were compared against (Table 2) (Ahamed et al., 2024; Budnik et al., 2024; Held et al., 2025). That said, the studies differ so much in design that direct ranking of panels would be misleading.

4.2.1 Multi-cancer early detection

Three MCED approaches stand out. The first, a sex-specific 10-protein PEA panel developed in 440 individuals with 18 early-stage solid tumors and controls, achieved AUCs of 0.980 in men and 0.983 in women; at a fixed 99% specificity, stage I sensitivity was 93% in men and 84% in women, and a 150-protein localization panel assigned TOO correctly in more than 80% of cases (Budnik et al., 2024). Nine of the ten detection proteins sat in the ultra-low-abundance tier and required no dilution, which is consistent with the idea that small tumors leave faint but specific traces in plasma (Budnik et al., 2024). The second, a 16-parameter panel of xPKA activity, secondary kinase activities, and IgG/IgM autoantibodies evaluated in 141 cancer cases and 119 healthy controls, reported 100% sensitivity across all five cancer types, including 14 of 14 stage I breast and 31 of 31 stage I lung cancers, at 97% specificity and 98% TOO accuracy (Held et al., 2025). The third, a 13-protein EV panel measured after ACE isolation in 323 participants with pancreatic, ovarian, or bladder cancer and controls, reached an AUC of 0.95 (95% CI 0.92–0.97) and 71.2% sensitivity for stage I–II disease at 99.5% specificity (Hinestrosa et al., 2022). The last of these is, we think, the more realistic picture of what a high-specificity screening test might achieve.

4.2.2 Lung cancer

A six-protein panel (FLNA, TUBA4A, GSTO1, PRDX6, ARHGDIB, and CDH13) quantified by targeted LC-PRM reached an AUC of 0.999, with positive and negative predictive values of 0.992 and 0.989 in the discovery set; in independent validation, sensitivity fell to 83.3–93.8% and specificity to 85.7–91.8% (El-Khoury et al., 2020). The drop is instructive in itself. In PEA-based plasma profiling, a nine-protein panel built with optAUC discriminated non-small cell lung cancer, including early stages, from non-cancer controls (Ahamed et al., 2024). Autoantibody screening on HuProt arrays yielded a three-protein panel (p53, ETHE1, and HRas) with a more modest 50.7% sensitivity at 90.7% specificity for early lung adenocarcinoma and small cell lung cancer (Huang & Zhu, 2017). A model combining plasma proteins with clinical variables has also been proposed for risk classification of indeterminate pulmonary nodules (Trivedi et al., 2020).

4.2.3 Colorectal cancer

Deep profiling with MARS-14 depletion, secondary IgY-based ultradepletion, and SWATH-MS produced a five-protein signature (SAA2, APCS, APOA4, F2, and AMBP) derived from a 37-protein candidate panel (Ahn et al., 2019). Classification accuracy for stage I–IV colorectal cancer against healthy controls was 94.0% for the five-protein panel and 99.6% for the 37-protein panel, and four of the five key proteins came exclusively from the deep-depletion fractions (Ahn et al., 2019). Earlier immunoassay-based panels pursued the same goal by a different route (Fung et al., 2015).

4.2.4 Esophageal squamous cell carcinoma

On the BarFlare platform, an MCF model integrating EV SCC, EV MMP13, serum SCC, age, and sex achieved AUCs of 0.960–0.987 across prospective multicenter validation cohorts (n = 855) (Wang et al., 2026). In population-based longitudinal cohorts (n = 176), the same score identified people who would later develop ESCC a median of 34.9 months (range 0.4–72.5) before clinical diagnosis, with an AUC of 0.864, sensitivity of 73.3%, and specificity of 82.2% (Wang et al., 2026). The lead-time result is arguably the most clinically meaningful in the whole set, even though its accuracy is lower than the headline cross-sectional figures.

4.2.5 Hepatocellular carcinoma

A four-protein panel (HABP2, CD163, AFP, and PIVKA-II) identified through DIA-MS and verified by targeted PRM distinguished hepatocellular carcinoma from liver cirrhosis and healthy individuals, with AUCs of approximately 0.98–0.99 across cohorts, outperforming AFP and PIVKA-II in combination (Xing et al., 2023). Serum KLKB1, identified with a similar DIA-to-PRM workflow, has been examined mainly as a prognostic marker (Che et al., 2021).

4.3 Computational Feature Selection, Classification, and Explainable AI

The p ≫ n problem shaped every computational study we examined (Table 3; Figure 3) (Bhawal et al., 2020; Brito-Rocha et al., 2023).

4.3.1 Feature selection and dimensionality reduction

Table 3. Computational modeling, feature-selection, classification, and validation frameworks used to design multi-protein diagnostic assays. The table groups the computational methods encountered in the reviewed studies by their role in the classifier-development workflow (see Figure 3), from penalized regression and recursive feature elimination through supervised classifiers, decision fusion, and explainable artificial intelligence to resampling-based validation. For each category, the operating principle, typical application to high-dimensional proteomic data (p ≫ n), and the main way in which it limits overfitting are described. These methods are complementary rather than competing, and most published panels combine several of them. Abbreviations: AUC, area under the curve; CV, cross-validation; LASSO, least absolute shrinkage and selection operator; LOOCV, leave-one-out cross-validation; MCF, multi-criteria classification fusion; pAUC, partial AUC; RFE, recursive feature elimination; SHAP, Shapley additive explanations; SVM, support vector machine.

Category

Method / tool

Operating principle

Application in proteomics

Advantages and overfitting control

References

Penalized regression

LASSO (L1) and elastic net (L1 + L2)

Penalizes the absolute size of regression coefficients, shrinking non-informative coefficients to exactly zero

Dimensionality reduction when proteins vastly outnumber samples in high-plex PEA or MS data

Removes collinear variables; yields sparse panels; directly restrains overfitting

Budnik et al. (2024); El-Khoury et al. (2020); Tibshirani (1996)

Recursive feature elimination and tree ranking

RFE-CV; random-forest Gini impurity

Iteratively fits models, ranks features by importance, and removes the weakest step by step

Selecting minimal subsets that maximize pAUC in the high-specificity region (0.75–1.00)

Captures non-linear relevance; handles correlated proteins; optimizes clinical cut-offs

Hinestrosa et al. (2022); Trivedi et al. (2020)

Supervised classifiers

SVM, random forest, XGBoost, AdaBoost, neural networks

Separates classes with optimal hyperplanes, boosted decision trees, or multilayer network weights

Combining multi-protein measurements into a continuous probability or risk score

High accuracy for non-linear patterns; tuned with internal k-fold CV

Ahn et al. (2019); Neagu et al. (2025); Trivedi et al. (2020); Wang et al. (2026)

Decision fusion

MCF; PanelomiX

Integrates weighted outputs of several top base classifiers, or searches for optimal combinations of marker thresholds

Fusing models to mimic multidisciplinary consensus; rule-based panel construction

Reduces single-model bias; higher F1 score, accuracy, and sensitivity in ESCC

El-Khoury et al. (2020); Wang et al. (2026)

Explainable AI

SHAP

Game-theoretic attribution of each feature's contribution and direction to an individual prediction

Interpreting black-box classifiers for clinical decision support

Makes models auditable; helps detect reliance on artifacts

Wang et al. (2026)

Resampling and validation

k-fold CV (5- or 10-fold), LOOCV, 100× resampling, bootstrapping; locked external validation

Repeatedly splits data into training (~67–80%) and held-out test (~20–33%) sets

Internal validation and tuning before algorithm lock-down

Limits data leakage and optimism; external cohorts establish generalizability

Bhawal et al. (2020); Collins et al. (2015); Hinestrosa et al. (2022

Table 4. Translational bottlenecks, reporting standards, and regulatory requirements for bringing protein-based diagnostic assays into clinical use

The table maps the main barriers encountered between biomarker discovery and clinical implementation onto the requirement or guideline that addresses each one and the mitigation strategies recommended in the literature. Rows follow the translational sequence shown in Figure 4, from pre-analytical control and transparent reporting, through the two-phase discovery-to-targeted-assay pipeline, to US Food and Drug Administration (FDA) device classification and the specific expectations for algorithm-based multivariate tests. Regulatory descriptions are summarized from the cited sources and should be checked against current agency guidance for any specific submission. Abbreviations: CDRH, Center for Devices and Radiological Health; HAP, high-abundance protein; IVDMIA, in vitro diagnostic multivariate index assay; PMA, premarket approval; SOP, standard operating procedure.

Domain

Requirement or guideline

Technical and clinical challenge

Recommended mitigation

References

Pre-analytical standardization

Control of pre-analytical variables and HAP masking

Plasma proteome spans 12–13 logs; albumin and immunoglobulins exceed 90% of protein mass; processing delay, hemolysis, and freeze–thaw cycles add noise

Fixed SOPs (processing within ~4 h, storage at −80 °C, no repeated thawing); immunodepletion (MARS-14, API) or dual-recognition and EV-based assays that bypass HAP masking

Ahn et al. (2019); Bhawal et al. (2020); Orive et al. (2024); Xing et al. (2023)

Reporting standards

TRIPOD and REMARK

Under-powered studies, missing calibration, and reuse of training samples for validation produce optimistic estimates

Report discrimination and calibration; lock the model before testing; validate in independent prospective cohorts

Collins et al. (2015); Moons et al. (2015); Orive et al. (2024); Sauerbrei et al. (2018)

Two-phase biomarker pipeline

Phase I discovery to Phase II targeted assay

High-plex discovery platforms (3,000-plex PEA, SWATH-MS) are too costly and complex for routine laboratories

Unbiased discovery in small cohorts, then conversion to multiplex ELISA, LC-PRM, or lateral-flow formats validated in large blinded cohorts; staging by the five-phase framework

Füzéry et al. (2013); Huang & Zhu (2017); Pepe et al. (2001); Yonet-Tanyeri et al. (2022)

FDA device classification

Risk-based classification (Class I–III) under CDRH

Whether a novel multiplex test needs 510(k) clearance or PMA depends on risk and intended use

510(k) for substantial equivalence to a Class II predicate; De Novo for novel moderate-risk tests; PMA for high-risk screening claims

Boja et al. (2011); Füzéry et al. (2013)

Algorithmic regulation

IVDMIA and software requirements

Multi-protein algorithms generate patient-specific scores that clinicians cannot derive or verify independently

Early pre-submission engagement; lock algorithm, software, and cut-offs before pivotal analytical and clinical validation

Boja et al. (2011); Füzéry et al. (2013)

LASSO and the elastic net were the most common choices for enforcing sparse, non-redundant panels (Budnik et al., 2024; El-Khoury et al., 2020; Tibshirani, 1996). RFE with five-fold cross-validation, repeated over 100 resamples, was used to maximize pAUC within the 0.75–1.00 specificity window, which directly targets false-positive reduction (Hinestrosa et al., 2022). Random-forest Gini ranking prioritized protein features such as TIMP1 and ProSB alongside clinical variables, including nodule size and age, before SVM training (Trivedi et al., 2020).

4.3.2 Classifiers and decision fusion

Individual base learners (SVM, XGBoost, AdaBoost, gradient boosting, random forest, and neural networks) all delivered strong apparent performance (Ahn et al., 2019; Neagu et al., 2025; Wang et al., 2026). In the ESCC work, fusing the three best base models (gradient boosting, XGBoost, and AdaBoost) through MCF gave significantly higher F1 scores, accuracy, and sensitivity than any single model (Wang et al., 2026). PanelomiX-style threshold optimization offered a simpler, rule-based alternative (El-Khoury et al., 2020).

4.3.3 Explainability

SHAP analysis in the EV-based ESCC model showed that EV SCC made the largest cumulative contribution to the risk score, followed by EV MMP13 and serum SCC (Wang et al., 2026). This ordering is biologically sensible, which is reassuring, though agreement with prior expectations is not the same as proof of causality.

4.3.4 Validation and data augmentation

Internal validation by k-fold cross-validation, leave-one-out cross-validation, or 100-fold resampling was nearly universal (Budnik et al., 2024; Hinestrosa et al., 2022). To cope with small cohorts, one deep-profiling study generated about 5,000 synthetic patient profiles by adding Gaussian noise of up to ten times the standard deviation of real technical replicates; the neural network trained on these data achieved 94% test accuracy and correctly classified all held-out patient samples (Ahn et al., 2019). Such augmentation is ingenious, but it cannot introduce biological variability that was absent from the original samples, so external validation remains indispensable.

4.4 Translational Standardization, Reporting Quality, and Regulatory Compliance

The final domain concerns what happens after a panel looks good on paper (Table 4; Figure 4) (Boja et al., 2011; Füzéry et al., 2013).

4.4.1 Pre-analytical and analytical standardization

Processing blood within about four hours, storing samples at −80 °C, and avoiding repeated freeze–thaw cycles were repeatedly identified as essential for protein stability (Bhawal et al., 2020; Orive et al., 2024). Analytical validation should establish precision (reported targets in the reviewed literature were intra-assay coefficients of variation below roughly 7–9% and inter-assay coefficients below 9–20%, depending on the platform), linearity, limits of detection and quantitation, analytical specificity, and freedom from carry-over (Boja et al., 2011; Orive et al., 2024).

4.4.2 Reporting standards

Adherence to TRIPOD and REMARK was, as far as could be judged from the published reports, uneven. Both TRIPOD and REMARK treat these items as core requirements rather than optional extras (Collins et al., 2015; Moons et al., 2015; Sauerbrei et al., 2018). Mapping the panels in Table 2 onto the phased framework of Pepe et al. (2001) places almost all of them in Phases 1–2, with only the longitudinal ESCC cohort approaching Phase 3 (Wang et al., 2026).

4.4.3 Two-phase pipeline and regulatory pathways

Successful development generally followed the two-phase route described above, moving from high-plex discovery in small cohorts to targeted, low-cost assays validated in large, blinded prospective cohorts (Huang & Zhu, 2017; Yonet-Tanyeri et al., 2022). Under the FDA Center for Devices and Radiological Health, protein-based multiplex assays are classified by risk and intended use (Boja et al., 2011; Füzéry et al., 2013). Moderate-risk tests with a suitable predicate may be cleared through 510(k) as Class II devices by showing substantial equivalence. Novel moderate-risk tests without a predicate may use De Novo classification. High-risk screening claims generally require PMA as Class III devices, supported by prospective clinical evidence of safety and effectiveness. Multiplex tests that combine several measurements through a non-transparent algorithm into a single patient-specific score fall under the in vitro diagnostic multivariate index assay (IVDMIA) category, and regulators expect both the algorithm and its clinical cut-offs to be locked before pivotal validation (Boja et al., 2011; Füzéry et al., 2013).

5. Toward a Network-Informed Taxonomy of Long COVID—Promise, Limits, and Next Steps

5.1 Principal Findings in Context

This review set out to ask whether network medicine could offer a more useful way of describing long COVID than a single diagnostic code. On balance, we think the answer is a cautious yes. Three lines of evidence, developed largely independently, point in a similar direction. Molecular studies suggest that SARS-CoV-2 perturbs a connected module of the human interactome and that downstream signals reach tissue-specific neighborhoods in lung, vasculature, gut, and brain (Gordon et al., 2020; Morselli Gysi et al., 2021; Pavel et al., 2021; Zhou et al., 2020b, 2021). Clinical data mining shows that people coded with long COVID fall into recognizable endotypes (Pfaff et al., 2023). And network pharmacology offers a principled, if still largely untested, way of matching drugs to perturbed sub-networks (Fiscon et al., 2021; Zhou et al., 2020a). The convergence is suggestive (Figure 1). Whether it is more than suggestive is a separate question.

5.2 Linking Molecular Modules to Clinical Endotypes

One of the more appealing features of the network view is that it lets us imagine explicit links between molecular modules and the clinical clusters identified in EHR data (Figures 2 and 3). The neurological and cognitive endotype described by Pfaff et al. (2023) fits reasonably well with the neurovascular and microglial signals reported by Zhou et al. (2021), in which endothelial and inflammatory mechanisms rather than neuronal infection seem to dominate. The gastrointestinal endotype, more common in younger patients, sits alongside evidence of enterocyte ACE2–TMPRSS2 co-expression and proximity to inflammatory bowel disease modules (Zhou et al., 2020b). The cardiopulmonary endotype could, in principle, reflect the pro-angiogenic and thrombo-inflammatory hubs identified by Pavel et al. (2021).

We want to be careful here, though. These correspondences are drawn across studies, populations, and data types; none of the included studies measured molecular modules and clinical endotypes in the same patients. The mapping is, for now, a hypothesis—a well-motivated one, perhaps, but a hypothesis all the same (Table 1; Table 2).

5.3 What the Repurposing Evidence Does and Does Not Show

The computational repurposing literature is impressive in scale, and the consensus results reported by Morselli Gysi et al. (2021) are genuinely encouraging. Yet almost all of these pipelines were designed to find antiviral or anti-inflammatory activity in acute infection (Table 3). It is not obvious that a drug able to suppress viral replication in a cell line will relieve post-exertional malaise or cognitive fatigue many months later. The finding that most active “network drugs” act on host neighbors rather than viral proteins is, we would argue, the more transferable lesson: if long COVID is sustained by host sub-network dysfunction, then host-directed modulation is where attention should go (Morselli Gysi et al., 2021; Zhou et al., 2021).

Combination strategies deserve similar nuance. The Complementary Exposure framework is mathematically elegant, but for long COVID the proposed pairs remain in silico (Hsieh et al., 2021; Zhou et al., 2020a) (Table 4; Figure 4). Several of the candidate agents—dactinomycin, mercaptopurine, etoposide—carry substantial toxicity, and their risk–benefit balance in a chronic, non-fatal condition would need very careful thought. Agents with gentler profiles that recur across analyses, melatonin being one example, may be more realistic first candidates for trials, though recurrence across related methods should not be mistaken for independent validation.

5.4 Methodological Considerations

Several limitations cut across the literature. The first is the acute-to-chronic gap already mentioned: much of the omic evidence was generated in acute or hospitalized COVID-19, and extrapolation to post-acute disease is inferential. The second concerns the interactome itself. Reference networks are incomplete and biased toward well-studied proteins, which can inflate the apparent centrality of familiar genes (Barabási et al., 2011; Conte et al., 2020). Results can shift depending on which interactome, distance metric, or null model is chosen (Santos et al., 2022; Stolfi et al., 2020).

Clinical phenotyping has its own vulnerabilities. EHR-derived clusters depend on coding practices, which vary between institutions and over time, and U09.9 was introduced only in late 2021, so earlier cases are under-captured (Pfaff et al., 2023). Unsupervised methods will always return clusters; whether those clusters are stable, reproducible in other health systems, and biologically meaningful has to be shown rather than assumed (Benito-León et al., 2021; Ilbeigipour et al., 2022). Crowdsourced data from social media are especially prone to selection and reporting biases, as Koss and Bohnet-Joschko (2022) acknowledged. Finally, our own review has limitations. It is narrative rather than meta-analytic, it is restricted to English-language sources, and the rapid pace of long COVID research means that relevant work will have appeared since our search.

5.5 Implications for Research and Practice

If an endotype-based taxonomy is to become useful at the bedside, a few things probably need to happen. Prospective cohorts should collect multi-omic samples—ideally including single-cell data from blood and, where feasible, cerebrospinal fluid—alongside structured and narrative clinical data from the same patients over time. That would allow the cross-study correspondences proposed in Section 5.2 to be tested directly. Computable phenotypes should be validated externally, across health systems and countries, and linked to patient-reported outcomes (Coste et al., 2025; Pfaff et al., 2023). Therapeutic candidates prioritized by network methods should then enter platform or adaptive trials stratified by endotype, and their results should feed into living evidence syntheses such as the network meta-analysis described by Zeraatkar et al. (2025). Open, well-documented tools—NeDRex, CovMulNet19, CoREx—lower the barrier for others to reproduce and extend this work (Sadegh et al., 2021; Santos et al., 2022; Verstraete et al., 2020).

For clinicians, the immediate message is more modest. It may already be helpful to think of a patient with long COVID as belonging, provisionally, to one of several patterns rather than to a single entity; this can shape which investigations are ordered and which specialists are involved. But network-predicted drugs should not, at this stage, be used outside trials.

5.6 Future Directions

Looking further ahead, integrating longitudinal omics with graph neural networks and knowledge graphs may eventually make it possible to assign individual patients to endotypes and to track whether they move between them over time (Hsieh et al., 2021; Santos et al., 2022). The same framework might also prove useful for other post-infectious syndromes, which have historically suffered from the same diagnostic vagueness. That prospect is, admittedly, speculative. It is nonetheless one of the stronger arguments for investing in the infrastructure now.

5. Discussion: Promise, Pitfalls, and the Path to Clinically Useful Protein Diagnostics

5.1 Principal Findings

Three broad conclusions emerge from this review. First, the analytical toolkit has matured to the point where measuring thousands of circulating proteins, including very scarce ones, from a few microlitres of blood is no longer the main obstacle (Table 1; Figure 2) (Ding et al., 2022; Petrera et al., 2021). Second, computationally designed multi-protein panels repeatedly outperform single markers, and several report AUCs above 0.95 together with encouraging stage I sensitivity (Table 2) (Budnik et al., 2024; Held et al., 2025; Hinestrosa et al., 2022). Third, and perhaps most importantly, the gap between these results and routine clinical use is now less a question of technology or algorithms than of study design, standardization, and regulatory evidence (Table 4; Figure 4) (Boja et al., 2011; Füzéry et al., 2013). We would put it more bluntly: the field probably does not need more retrospective discovery studies so much as fewer, larger, and better-designed validation studies.

5.2 Why Low-Abundance Signals Matter, and What That Means for Platform Choice

The observation that the most discriminating early-detection proteins tend to sit in the lowest concentration tiers of plasma (Budnik et al., 2024) has practical consequences. It suggests that platforms with a wide dynamic range and high sensitivity, such as PEA, deep-depletion MS, or EV-enriched assays, are likely to be favored for discovery, whereas conventional ELISA and untargeted DDA-MS may simply miss the relevant signal (Figure 2) (Ahn et al., 2019; Ding et al., 2022). At the same time, deep-depletion workflows bring their own risks. Removing abundant proteins can co-deplete bound low-abundance species, and every added fractionation step introduces another source of technical variation (Ahn et al., 2019; Bhawal et al., 2020). Dual-recognition affinity assays and EV isolation appear to sidestep some of these problems (Hinestrosa et al., 2022; Petrera et al., 2021), but they are restricted to predefined targets and, in the case of PEA, to relative rather than absolute quantification. There is no free lunch here. Combining orthogonal platforms, using MS to confirm affinity-based findings or vice versa, seems a sensible, if more expensive, way forward (Bhardwaj et al., 2021; Petrera et al., 2021).

EV-based assays deserve particular comment. The ESCC lead-time data (Wang et al., 2026) and the stage I–II pancreatic, ovarian, and bladder results (Hinestrosa et al., 2022) hint that vesicle cargo may carry an earlier or cleaner tumor signal than bulk plasma. Still, EV isolation methods are not yet standardized, and sensitivity gains of 25–31-fold over ELISA, while striking, were demonstrated for a small number of targets on a single platform (Wang et al., 2026). Broader replication would help.

5.3 Algorithms: Accuracy Versus Generalizability

Almost every algorithmic family reviewed, from LASSO to gradient-boosted ensembles and neural networks, can produce excellent apparent accuracy (Table 3) (Ahamed et al., 2024; Ahn et al., 2019; Wang et al., 2026). That is partly the problem. In p ≫ n datasets, a sufficiently flexible model will almost always find a separating rule, and internal cross-validation, though necessary, does not fully protect against optimism when feature selection, normalization, or hyper-parameter tuning leak information across folds (Bhawal et al., 2020; Brito-Rocha et al., 2023). The lung cancer panel whose AUC fell from 0.999 in discovery to sensitivities and specificities in the mid-80s to low-90s on independent validation is a clear example of what typically happens next (El-Khoury et al., 2020). Synthetic data augmentation can stabilize training (Ahn et al., 2019), but it cannot supply the biological and pre-analytical heterogeneity that only new cohorts provide.

Decision fusion and explainability tools such as MCF and SHAP are welcome developments (Wang et al., 2026). Fusion may reduce variance and model-specific bias, and SHAP makes it easier to check whether a model relies on biologically plausible features rather than batch artifacts. We would caution, though, that interpretability is not validation. A model can be transparent and still be wrong in a new population. On balance, simpler sparse models with locked coefficients may be easier to transfer to targeted clinical assays and to defend before regulators than complex ensembles, unless the latter offer a clear, externally confirmed gain (Boja et al., 2011; Füzéry et al., 2013).

5.4 Interpreting Headline Accuracy: Spectrum, Controls, and Prevalence

Many of the panels in Table 2 were developed in case–control designs comparing patients with known cancer against healthy volunteers. Such designs are efficient for discovery, which is why the phased framework places them early in development (Pepe et al., 2001), but they almost certainly overestimate performance in screening. Real-world screening populations include people with inflammatory disease, benign tumors, and other comorbidities, exactly the conditions that confound single markers such as CA 125 and CEA (Ding et al., 2022; Misek & Kim, 2011). The 100% stage I sensitivity reported for the 16-parameter panel (Held et al., 2025), for instance, is remarkable, but it was obtained in a relatively small set of cases and healthy controls and will need confirmation in a population that resembles the intended-use setting.

Prevalence matters too. To give a purely illustrative calculation, a test with 90% sensitivity and 97% specificity applied to a population with 1% cancer prevalence would have a positive predictive value of only about 23%; raising specificity to 99% would roughly double it, to about 48%. This is why MCED developers typically fix specificity at 99% or higher and report sensitivity at that operating point (Budnik et al., 2024; Hinestrosa et al., 2022), and why such operating points should be pre-specified rather than chosen after the fact. It also explains why the more modest but prospectively derived ESCC lead-time figures (AUC 0.864; sensitivity 73.3%; specificity 82.2%) may be more informative about real-world value than near-perfect cross-sectional AUCs (Wang et al., 2026).

5.5 Translational and Regulatory Implications

The two-phase pipeline (Figure 4) remains the most practical route from discovery to clinic (Füzéry et al., 2013; Huang & Zhu, 2017). Its weak point is the transfer itself. Proteins quantified by PEA or DIA-MS do not always behave identically when re-measured by ELISA, PRM, or lateral-flow formats, so the panel and its algorithm may need recalibration, and recalibration effectively creates a new model that must be validated again (Che et al., 2021; Yonet-Tanyeri et al., 2022). Pre-analytical standard operating procedures should be fixed before, not after, validation cohorts are collected (Bhawal et al., 2020; Orive et al., 2024).

On the regulatory side, multi-protein algorithms that output a single risk score are likely to be treated as IVDMIAs, which means the algorithm, its software, and its decision thresholds must be locked before pivotal studies (Boja et al., 2011; Füzéry et al., 2013). Early engagement with regulators through pre-submission meetings seems advisable, particularly for MCED tests, where intended use, the downstream diagnostic pathway after a positive result, and the handling of TOO predictions all raise questions that existing predicates do not answer. Full reporting according to TRIPOD and REMARK would make these submissions, and the underlying science, much easier to evaluate (Collins et al., 2015; Moons et al., 2015; Sauerbrei et al., 2018).

5.6 Strengths and Limitations of This Review

This review brings together analytical, computational, clinical, and regulatory evidence that is usually discussed separately, and it uses explicit criteria to appraise development phase and reporting quality. Several limitations should be acknowledged. As a narrative synthesis, it is more vulnerable to selection bias than a systematic review, and we did not perform a meta-analysis or formal risk-of-bias scoring. Performance figures were taken as published and are not directly comparable across studies that used different populations, platforms, operating points, and validation strategies. Publication bias probably favors positive results, especially in a commercially active field where several of the reviewed tests are associated with companies developing them. Finally, the evidence is moving quickly, and some of the most recent studies (Held et al., 2025; Wang et al., 2026) have yet to be independently replicated.

5.7 Future Directions

Several priorities seem clear to us. Prospective, intended-use cohorts that include benign and inflammatory conditions as controls are needed to estimate real-world sensitivity, specificity, and predictive values. Pre-registration of panels, algorithms, and cut-offs before validation would reduce analytic flexibility. Harmonized pre-analytical protocols and shared reference materials would allow platforms to be compared fairly (Boja et al., 2011; Orive et al., 2024). Integration of protein panels with other analytes, such as cell-free DNA, and with clinical risk factors may well improve performance (Brito-Rocha et al., 2023; Trivedi et al., 2020), though it will also complicate validation. Lastly, randomized or well-controlled screening studies will ultimately be required to show that earlier detection actually reduces cancer-specific mortality, rather than simply advancing the date of diagnosis.

6. Conclusion

Computationally designed multi-protein panels have, in a fairly short time, moved from an attractive idea to a credible candidate for early cancer detection. High-plex platforms can now reach the scarce proteins that early tumors appear to shed, and modern feature selection and machine learning can condense thousands of measurements into compact, interpretable decision rules. Several panels report excellent discrimination, and at least one has shown that it can flag cancer years before clinical diagnosis. Yet much of this evidence comes from case–control cohorts and internal validation, which probably overstate what will be seen in screening practice. Translation will depend less on further gains in retrospective accuracy than on standardized pre-analytical handling, transparent TRIPOD- and REMARK-compliant reporting, faithful conversion to targeted assays, and prospective validation in intended-use populations within appropriate regulatory pathways. If those conditions are met, protein-based liquid biopsy could become a genuinely useful partner to existing screening programs.


References


Barabási, A.-L., Gulbahce, N., & Loscalzo, J. (2011). Network medicine: A network-based approach to human disease. Nature Reviews Genetics, 12(1), 56–68.

Benito-León, J., Gómez-Isla, T., & Hernández-Gallego, J. (2021). Using unsupervised machine learning to identify age- and sex-independent severity subgroups among patients with COVID-19: Observational longitudinal study. Journal of Medical Internet Research, 23(5), e25988.

Conte, F., Fiscon, G., Licursi, V., Bizzarri, D., D’Antò, T., Farina, L., & Paci, P. (2020). A paradigm shift in medicine: A comprehensive review of network-based approaches. Biochimica et Biophysica Acta (BBA) - Gene Regulatory Mechanisms, 1863(6), 194416.

Coste, J., Delpierre, C., Robineau, O., Rushyizekera, M., Richard, J.-B., Alleaume, C., Gallay, A., Tebeka, S., Steichen, O., Lemogne, C., & Makovski, T. T. (2025). A multidimensional network of factors associated with long COVID in the French population. Communications Medicine, 5, 846.

Fiscon, G., Conte, F., Farina, L., & Paci, P. (2021). SAveRUNNER: A network-based algorithm for drug repurposing and its application to COVID-19. PLOS Computational Biology, 17(2), e1008686.

Gordon, D. E., Jang, G. M., Bouhaddou, M., Xu, J., Obernier, K., White, K. M., O’Meara, M. J., Rezelj, V. V., Guo, J. Z., Swaney, D. L., Tummino, T. A., Huettenhain, R., Kaake, R. M., Richards, A. L., Tutuncuoglu, B., Foussard, H., Batra, J., Haas, K. M., Modak, M., ... Krogan, N. J. (2020). A SARS-CoV-2 protein interaction map reveals targets for drug repurposing. Nature, 583(7816), 459–468.

Halamka, J., Cerrato, P., & Perlman, A. (2020). Redesigning COVID-19 care with network medicine and machine learning. Mayo Clinic Proceedings: Innovations, Quality & Outcomes, 4(6), 762–769.

Hsieh, K., Wang, Y., Chen, L., Zhao, Z., Savitz, S., Jiang, X., Tang, J., & Kim, Y. (2021). Drug repurposing for COVID-19 using graph neural network and harmonizing multiple evidence. Scientific Reports, 11, 2353.

Ilbeigipour, S., Albadvi, A., & Noughabi, E. A. (2022). Cluster-based analysis of COVID-19 cases using self-organizing map neural network and K-means methods to improve medical decision-making. Informatics in Medicine Unlocked, 32, 101005.

Jamshidi, M. B., Lalbakhsh, A., Talla, J., Peroutka, Z., Hadj-Alouane, F., Roshani, S., ... & Sprogis, A. (2020). Artificial intelligence and COVID-19: Deep learning approaches for diagnosis and treatment. IEEE Access, 8, 109581–109591.

Koss, C., & Bohnet-Joschko, S. (2022). Generating hypotheses on drug repurposing from discussions among long-haulers on Reddit: Social media mining study. JMIR Formative Research, 6(10), e39582.

Li, X., Yu, J., Zhang, Z., Ren, J., Peluffo, A. E., Zhang, W., Zhao, Y., Wu, J., Yan, K., Cohen, D., & Wang, W. (2021). Network bioinformatics approach helps to predict 30 repurposable drugs against COVID-19. Medicine in Drug Discovery, 10, 100090.

Messina, F., Giombini, E., Agrati, C., Vairo, F., Ascoli Bartoli, T., Al Moghazi, S., Piacentini, M., Locatelli, F., Kobinger, G., Maeurer, M., Zumla, A., Capobianchi, M. R., Lauria, F. N., & Ippolito, G. (2020). COVID-19: Viral–host interactome analyzed by network based-approach model to study pathogenesis of SARS-CoV-2 infection. Journal of Translational Medicine, 18, 233.

Morselli Gysi, D., do Valle, Í., Zitnik, M., Ameli, A., Gan, X., Varol, O., Ghiassian, S. D., Patten, J. J., Davey, R. A., Loscalzo, J., & Barabási, A.-L. (2021). Network medicine framework for identifying drug-repurposing opportunities for COVID-19. Proceedings of the National Academy of Sciences, 118(19), e2025581118.

Pavel, A., del Giudice, G., Federico, A., Di Lieto, A., Kinaret, P. A. S., Serra, A., & Greco, D. (2021). Integrated network analysis reveals new genes suggesting COVID-19 chronic effects and treatment. Briefings in Bioinformatics, 22(2), 1430–1441.

Pfaff, E. R., Madlock-Brown, C., Baratta, J. M., Bhatia, A., Davis, H., Girvin, A., Hill, E., Kelly, E., Kostka, K., Loomba, J., McMurry, J. A., Wong, R., Bennett, T. D., Moffitt, R., Chute, C. G., & Haendel, M. (2023). Coding long COVID: Characterizing a new disease through an ICD-10 lens. BMC Medicine, 21(1), 58.

Sadegh, S., Skelton, J., Anastasi, E., Bernett, J., Blumenthal, D. B., Galindez, G., Salgado-Albarrán, M., Lazareva, O., Flanagan, K., Cockell, S., Nogales, C., Casas, A. I., Schmidt, H. H. H. W., Baumbach, J., Wipat, A., & Kacprowski, T. (2021). Network medicine for disease module identification and drug repurposing with the NeDRex platform. Nature Communications, 12, 6848.

Santos, S. S., Torres, M., Galeano, D., Sánchez, M. M., Cernuzzi, L., & Paccanaro, A. (2022). Machine learning and network medicine approaches for drug repositioning for COVID-19. Patterns, 3(1), 100396.

Stolfi, P., Manni, L., Soligo, M., Vergni, D., & Tieri, P. (2020). Designing a network proximity-based drug repurposing strategy for COVID-19. Frontiers in Cell and Developmental Biology, 8, 545089.

Sun, X., Jiang, J., Wang, Y., & Liu, S. (2020). On coronavirus disease 2019 (COVID-19) through a combination of data mining and network pharmacology analysis. European Journal of Integrative Medicine, 40, 101242.

Tomazou, M., Bourdakou, M. M., Minadakis, G., Zachariou, M., Oulas, A., Karatzas, E., Loizidou, E. M., Kakouri, A. C., Christodoulou, C. C., Savva, K., Zanti, M., Onisiforou, A., Afxenti, S., Richter, J., Christodoulou, C. G., Kyprianou, T., Kolios, G., Dietis, N., & Spyrou, G. M. (2021). Multi-omics data integration and network-based analysis drives a multiplex drug repurposing approach to a shortlist of candidate drugs against COVID-19. Briefings in Bioinformatics, 22(6), bbab114.

Verstraete, N., Jurman, G., Bertagnolli, G., Ghavasieh, A., Pancaldi, V., & De Domenico, M. (2020). CovMulNet19, integrating proteins, diseases, drugs, and symptoms: A network medicine approach to COVID-19. Network and Systems Medicine, 1(1), 181–191.

Zeraatkar, D., Ling, M., Kirsh, S., Jassal, T., Pitre, T., Chakraborty, S., Turner, T., Turkstra, L., McIntyre, R. S., Izcovich, A., Mbuagbaw, L., Agoritsas, T., Flottorp, S. A., Garner, P., Couban, R. J., & Busse, J. W. (2025). Interventions for the management of post-COVID-19 condition (long COVID): Protocol for a living systematic review and network meta-analysis. BMJ Open, 15(2), e086407.

Zhou, Y., Hou, Y., Shen, J., Huang, Y., Martin, W., & Cheng, F. (2020a). Network-based drug repurposing for novel coronavirus 2019-nCoV/SARS-CoV-2. Cell Discovery, 6(1), 14.

Zhou, Y., Hou, Y., Shen, J., Mehra, R., Kallianpur, A., Culver, D. A., Gack, M. U., Farha, S., Zein, J., Comhair, S., Fiocchi, C., Stappenbeck, T., Chan, T., Eng, C., Jung, J. U., Jehi, L., Erzurum, S., & Cheng, F. (2020b). A network medicine approach to investigation and population-based validation of disease manifestations and drug repurposing for COVID-19. PLOS Biology, 18(11), e3000970.

Zhou, Y., Xu, J., Hou, Y., Leverenz, J. B., Kallianpur, A., Mehra, R., Liu, Y., Yu, H., Pieper, A. A., Jehi, L., & Cheng, F. (2021). Network medicine links SARS-CoV-2/COVID-19 infection to brain microvascular injury and neuroinflammation in dementia-like cognitive impairment. Alzheimer's Research & Therapy, 13(1), 110.


Article metrics
View details
0
Downloads
0
Citations
93
Views

View Dimensions


View Plumx


View Altmetric


0
Save
0
Citation
93
View
0
Share