4.1 Study Selection and Characteristics
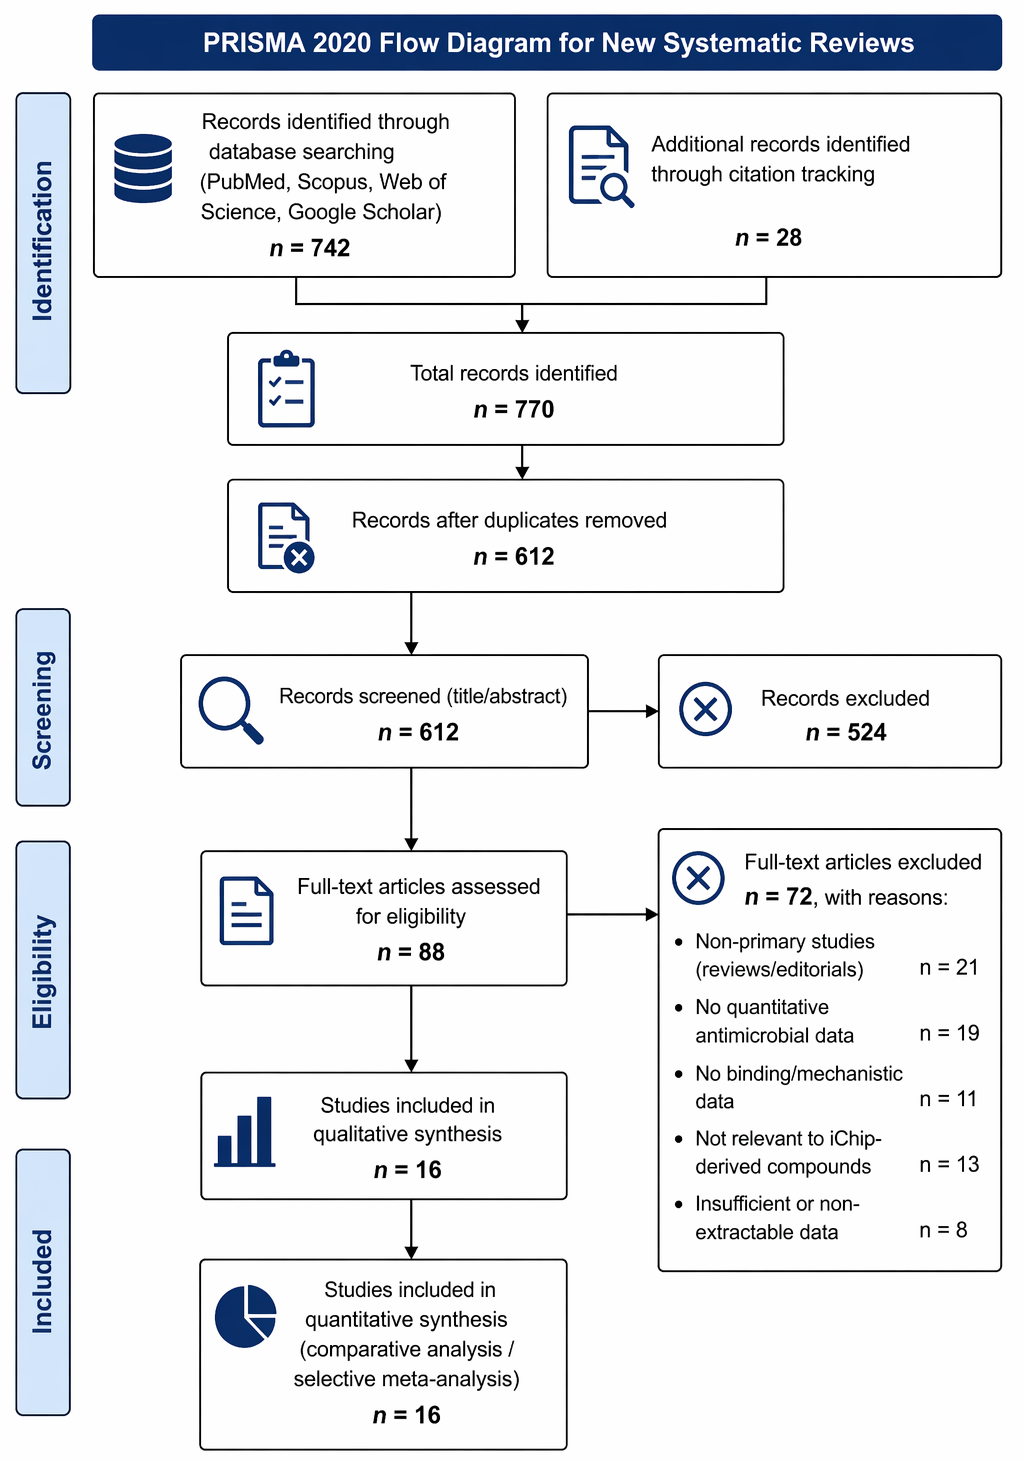
The systematic search and screening process yielded a final dataset of 16 studies included for quantitative synthesis, as illustrated in Figure 1. The included studies spanned a diverse range of experimental designs, encompassing in vitro antimicrobial assays, mechanistic binding analyses, resistance evolution experiments, and in vivo infection models. Collectively, these studies reflect the evolving landscape of iChip-enabled antibiotic discovery and subsequent analogue development.
As summarized in Table 1, the included compounds represent both natural products and rationally designed analogues, with teixobactin serving as the central scaffold. The dataset includes natural teixobactin, multiple synthetic derivatives (e.g., Arg10-teixobactin, Lys10-teixobactin, L-Chg10-teixobactin), and structurally distinct compounds such as darobactin. These compounds predominantly target highly conserved bacterial structures, including lipid II and lipid III, or, in the case of darobactin, outer membrane proteins such as BamA (Ling et al., 2015; Chiorean et al., 2020; Prakasam et al., 2026). This diversity in compound origin and mechanism provided a suitable basis for comparative synthesis, although heterogeneity in experimental endpoints remained a defining feature of the dataset.
Table 1. Study Characteristics and Representative Lead Compounds from iChip-Derived and Synthetic Antibiotic Platforms. This table summarizes the principal iChip-derived antibiotics and their synthetic analogues, highlighting their origin, molecular targets, and primary research focus. Collectively, these compounds illustrate the transition from natural product discovery to rational analogue development, with emphasis on targeting conserved bacterial structures such as lipid II/III and outer membrane proteins (e.g., BamA).
|
Lead Compound
|
Origin / Development Strategy
|
Primary Molecular Target
|
Key Study Focus
|
References
|
|
Teixobactin
|
Eleftheria terrae (iChip-derived)
|
Lipid II & Lipid III
|
Discovery, antimicrobial spectrum, and initial MIC/PD50 evaluation
|
Ling et al., 2015
|
|
Arg10-teixobactin
|
Synthetic analogue
|
Lipid II & Lipid III
|
Resistance evolution profiling and cost-efficiency analysis
|
Lloyd et al., 2021
|
|
[Arg(Me)10,Nle11]
|
Synthetic analogue
|
Cell wall precursors
|
Structure–activity relationship (SAR) and synergy with colistin against Gram-negative bacteria
|
Ng et al., 2018
|
|
L-Chg10-teixobactin
|
Synthetic analogue
|
Cell wall components
|
Activity against Enterococcus faecalis and biofilm inhibition
|
Jarkhi et al., 2022
|
|
Lys10-teixobactin
|
Synthetic analogue
|
Lipid II
|
Binding interaction thermodynamics and mechanistic insights
|
Chiorean et al., 2020
|
|
Darobactin
|
Photorhabdus spp. (symbiotic origin)
|
BamA (outer membrane protein)
|
Activity against Gram-negative priority pathogens and mechanism of action
|
Prakasam et al., 2026
|
4.2 Comparative Antimicrobial Efficacy Across Pathogens
Quantitative antimicrobial data extracted from the included studies revealed a clear pattern of strong activity against Gram-positive pathogens, contrasted with limited intrinsic activity against Gram-negative organisms. As detailed in Table 2, natural teixobactin demonstrated potent activity against Staphylococcus aureus (MRSA) with MIC values around 0.25 µg/mL, consistent with the original findings of Ling et al. (2015). Similarly, activity against Enterococcus faecalis (VRE) and Mycobacterium tuberculosis remained within sub-microgram ranges, reinforcing its broad Gram-positive efficacy (Ling et al., 2015; Qi et al., 2022). Notably, exceptionally low MIC values were observed for Clostridioides difficile (0.005 µg/mL) and Bacillus anthracis (as low as 0.02 µg/mL), indicating high potency against specific pathogens (Ling et al., 2015; Lawrence et al., 2025).
However, synthetic analogues exhibited variable potency, often with reduced activity relative to the native compound. For example, Arg10-teixobactin showed MIC values of approximately 2.0 µg/mL against MRSA, representing an order-of-magnitude decrease in potency (Iyer et al., 2019; Qi et al., 2022). Similar trends were observed for other analogues, including Lys10-teixobactin, which displayed MIC values in the range of 2–4 µg/mL (Ramchuran et al., 2018). The heatmap visualization in Figure 2 further illustrates these patterns, highlighting both compound-dependent and pathogen-dependent variability. While most compounds retained activity against Gram-positive organisms, Gram-negative bacteria such as Escherichia coli and Pseudomonas aeruginosa exhibited markedly higher MIC values, often exceeding 100 µg/mL or reported as >256 µg/mL (Ng et al., 2018; Chiorean et al., 2020). This disparity underscores the permeability barrier imposed by the outer membrane of Gram-negative bacteria.
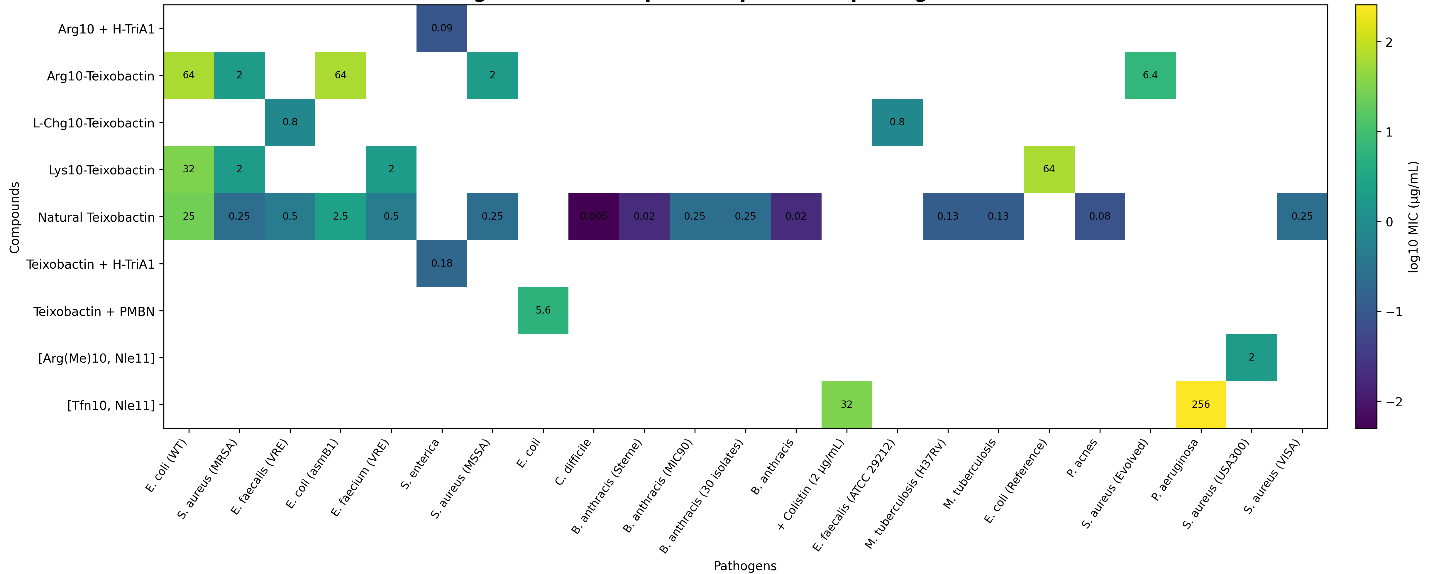
Figure 2: Heatmap of compounds × pathogens × minimum inhibitory concentration (MIC) values for iChip-derived compounds and teixobactin analogs. This heatmap summarizes MIC values extracted from the structured workbook across compound-pathogen pairs. Values are shown in µg/mL and represent the available extracted study-level observations after restructuring of the uploaded datasets. Where multiple entries were available for the same compound-pathogen combination, the plotted value reflects an aggregated representative value derived from the structured table for visualization. Lower MIC values indicate stronger antimicrobial potency, whereas higher MIC values indicate reduced activity or conditional activity against the tested organism. Blank cells indicate that no corresponding MIC value was available in the current extracted dataset.
Table 2. Comparative Antimicrobial Efficacy of Teixobactin and Its Analogues (MIC Values, µg/mL). Minimum inhibitory concentration (MIC) values indicate the antimicrobial potency of teixobactin and its derivatives across a range of clinically relevant pathogens. Lower MIC values reflect higher potency. Notably, strong activity is observed against Gram-positive organisms, while Gram-negative pathogens exhibit reduced susceptibility unless membrane-permeabilizing agents are used.
|
Pathogen
|
Natural Teixobactin
|
Arg10-teixobactin
|
Other Analogues
|
References
|
|
Staphylococcus aureus (MRSA)
|
0.25
|
2.0
|
2.0–4.0 ([Arg(Me)10,Nle11])
|
Ling et al., 2015; Ng et al., 2018
|
|
Enterococcus faecalis (VRE)
|
0.5
|
1.0–2.0
|
0.8 (L-Chg10)
|
Ling et al., 2015; Jarkhi et al., 2022
|
|
Mycobacterium tuberculosis
|
0.125
|
—
|
—
|
Qi et al., 2022
|
|
Bacillus anthracis
|
0.02
|
—
|
—
|
Lawrence et al., 2025
|
|
Clostridioides difficile
|
0.005
|
—
|
—
|
Ling et al., 2015
|
|
Propionibacterium acnes
|
0.08
|
8.0
|
2.0 ([Arg(Me)10,Nle11])
|
Ng et al., 2018; Qi et al., 2022
|
|
Escherichia coli (asmB1)
|
2.5
|
25.0
|
22.5 (Lys10)
|
Chiorean et al., 2020; Qi et al., 2022
|
|
Pseudomonas aeruginosa
|
>100
|
>128
|
32.0 (with colistin)
|
Ng et al., 2018; Ling et al., 2015
|
4.3 Binding Affinity and Target Engagement Patterns
Binding affinity data, summarized in Table 6 and visualized in Figure 3, provided insight into the mechanistic basis of antimicrobial activity. Across the dataset, teixobactin and its analogues demonstrated preferential binding to lipid II and related cell wall precursors, consistent with previously reported mechanisms (Chiorean et al., 2020; Shukla et al., 2022). Natural teixobactin exhibited binding affinities in the low micromolar range (0.08–0.43 µM) for lipid II, reflecting strong target engagement. Interestingly, analogues displayed heterogeneous binding profiles, with some showing reduced affinity for Gram-positive lipid II but enhanced interaction with Gram-negative lipid II variants. For instance, Arg10-teixobactin demonstrated relatively weaker binding to Gram-positive lipid II (4.13 µM) but stronger binding to Gram-negative lipid II (0.06 µM), suggesting structural modifications may alter target specificity (Chiorean et al., 2020).
Despite these differences, the relationship between binding affinity and antimicrobial potency was not strictly linear. This exploratory plot illustrates this complexity, indicating that stronger binding does not always translate into improved antimicrobial efficacy, particularly in the context of Gram-negative organisms where permeability constraints dominate.
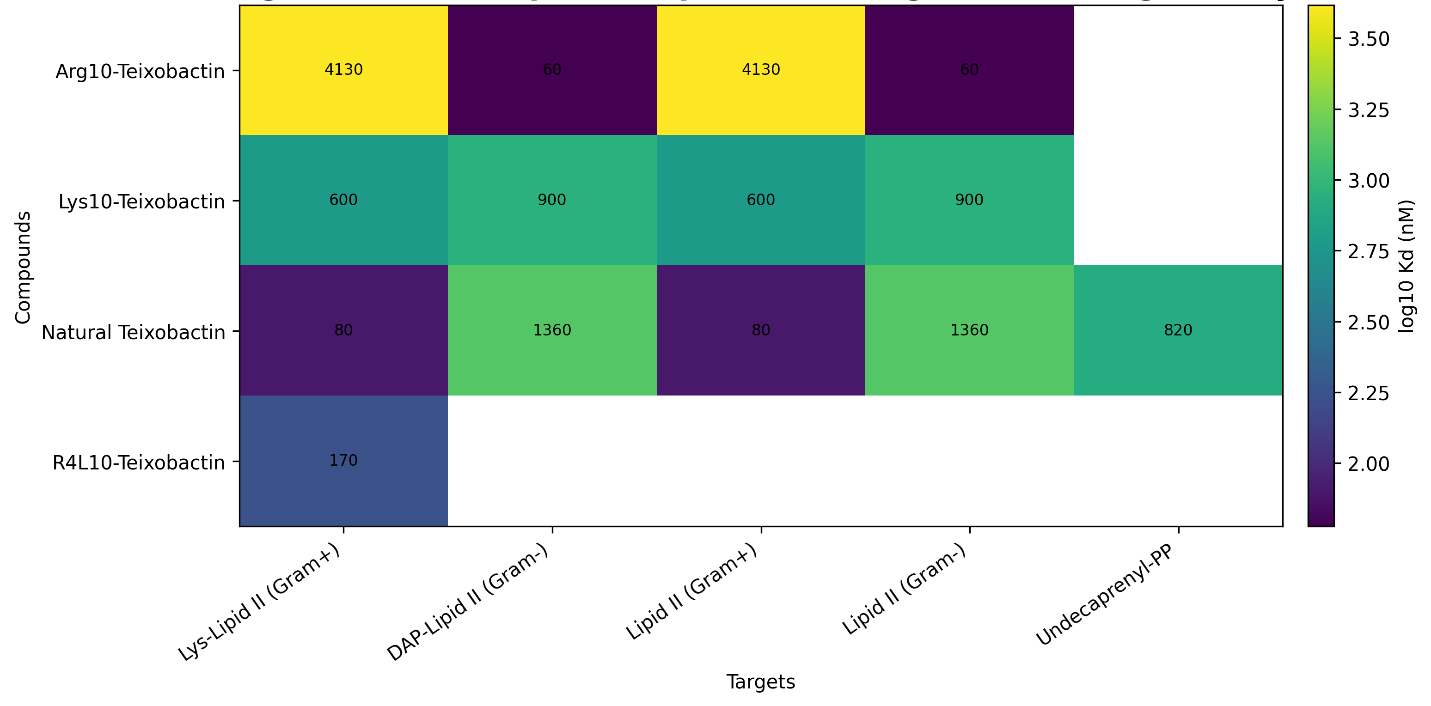
Figure 3: Heatmap of compounds × molecular targets × binding affinity (Kd) for teixobactin-related compounds. This heatmap presents binding affinity values compiled from the extracted dataset for available compound-target pairs, including Lipid II-related targets and undecaprenyl pyrophosphate where reported. Values are plotted as Kd in nM using the structured binding table derived from the uploaded workbook. Lower Kd values indicate stronger target binding affinity. Missing cells denote target-compound combinations for which no binding measurement was available in the extracted data. This figure is intended to visualize comparative target engagement patterns rather than infer a pooled mechanistic effect size.
4.4 Resistance Profiles and Adaptive Responses
Resistance-related findings, summarized in Table 3, revealed a remarkably low frequency of resistance development for teixobactin-class compounds. Early studies reported resistance frequencies below 10⁻¹⁰ in S. aureus and B. anthracis, with no identifiable resistance genes (Ling et al., 2015; Lawrence et al., 2025). However, subsequent investigations introduced a more nuanced perspective. Experimental evolution studies demonstrated that resistance could emerge under prolonged selective pressure, albeit slowly and at a significant fitness cost (Lloyd et al., 2021). These findings suggest that while resistance is not easily acquired, it is not absent. Importantly, adaptive responses appeared to be mediated through tolerance mechanisms rather than classical resistance mutations. Activation of regulatory systems such as the CroRS two-component system in Enterococcus faecalis was shown to play a critical role in mediating cell envelope stress responses (Darnell et al., 2019; Todd Rose et al., 2023). This distinction between resistance and tolerance is particularly relevant, as it may influence long-term therapeutic outcomes.
Table 3. Resistance Profiles and Mechanistic Insights of Teixobactin-Class Antibiotics. This table outlines resistance dynamics and mechanistic features associated with teixobactin and its analogues. The findings highlight a resistance-resilient profile driven by targeting conserved lipid structures and demonstrate that adaptive responses are more often linked to tolerance mechanisms rather than classical resistance mutations.
|
Parameter
|
Key Findings
|
Associated Genes / Pathways
|
References
|
|
Resistance frequency
|
Extremely low (<10⁻¹⁰) in S. aureus and B. anthracis
|
No specific resistance gene identified
|
Ling et al., 2015; Lawrence et al., 2025
|
|
Resistance evolution
|
Occurs slowly and is associated with significant fitness cost
|
Mutations in cell wall modulation pathways
|
Lloyd et al., 2021
|
|
Tolerance mechanisms
|
Activation of stress-response regulatory systems
|
CroRS regulon (e.g., uppS, pbp)
|
Darnell et al., 2019; Todd Rose et al., 2023
|
|
Mechanism of action
|
Target sequestration of cell wall precursors
|
Lipid II (pyrophosphate-sugar) and Lipid III
|
Shukla et al., 2022
|
|
Supramolecular organization
|
Formation of β-sheet fibrillar assemblies
|
Membrane phospholipid displacement
|
Shukla et al., 2022
|
4.5 In Vivo Efficacy and Translational Potential
In vivo data, presented in Table 4, provided evidence of the therapeutic potential of teixobactin and its analogues across multiple infection models. In murine septicaemia models, teixobactin exhibited a PD₅₀ of approximately 0.2 mg/kg, demonstrating significantly higher potency than vancomycin (Ling et al., 2015). Similarly, in rabbit models of inhalation anthrax, teixobactin achieved complete survival and pathogen clearance at doses of 1.0 mg/kg (Lawrence et al., 2025). Additional studies reported substantial reductions in bacterial load in murine thigh and lung infection models, with reductions reaching up to six log units (Ling et al., 2015). These findings collectively suggest that in vitro potency translates effectively into in vivo efficacy, although the number of available studies remains limited.
Table 4. In Vivo Efficacy of Teixobactin and Related Compounds Across Animal Models. In vivo studies demonstrate the therapeutic potential of teixobactin and its analogues across multiple infection models. Outcomes consistently show strong bactericidal activity, often surpassing standard-of-care antibiotics, thereby supporting translational relevance.
|
Animal Model
|
Infection Type
|
Lead Agent
|
Dosage / PD50
|
Key Outcome
|
References
|
|
Mouse (CD-1)
|
Septicaemia (MRSA)
|
Teixobactin
|
PD50: 0.2 mg/kg
|
~10× more potent than vancomycin
|
Ling et al., 2015
|
|
Rabbit (NZW)
|
Inhalation anthrax
|
Teixobactin
|
1.0 mg/kg (IV)
|
Complete survival and pathogen clearance
|
Lawrence et al., 2025
|
|
Mouse
|
Thigh infection (MRSA)
|
Teixobactin
|
2.5 mg/kg
|
Significant bacterial load reduction
|
Ling et al., 2015
|
|
Mouse
|
Lung infection (S. pneumoniae)
|
Teixobactin
|
0.5–10 mg/kg
|
~6 log reduction in bacterial burden
|
Ling et al., 2015
|
|
Mouse
|
Keratitis (MRSA)
|
D-Arg4-Leu10 analogue
|
Topical
|
>99% reduction in infection burden
|
Iyer et al., 2019
|
4.6 Synergy and Gram-Negative Potentiation
Given the limited intrinsic activity against Gram-negative bacteria, several studies explored synergistic strategies to enhance efficacy, as summarized in Table 5. These approaches primarily involved the use of membrane-disrupting agents to facilitate antibiotic entry. Notably, combinations of teixobactin with H-TriA1 resulted in up to a 125-fold reduction in MIC against Salmonella enterica (Chiorean et al., 2020). Even more pronounced effects were observed with certain analogues, achieving reductions exceeding 1000-fold. Similarly, co-administration with colistin restored activity against Pseudomonas aeruginosa, with fractional inhibitory concentration indices indicating synergistic interactions (Ng et al., 2018). These findings highlight the potential of combination therapies to overcome permeability barriers, although clinical applicability remains to be established.
Table 5. Synergistic Interactions and Gram-Negative Potentiation Strategies. This table summarizes synergistic strategies used to enhance the activity of teixobactin-class compounds against Gram-negative bacteria. Membrane-disrupting agents facilitate antibiotic entry, significantly reducing MIC values and restoring antimicrobial activity.
|
Agent 1
|
Agent 2 (Membrane Disruptor)
|
Target Organism
|
Effect on MIC
|
References
|
|
Teixobactin
|
H-TriA1
|
Salmonella enterica
|
~125-fold reduction
|
Chiorean et al., 2020
|
|
Analogue 2
|
H-TriA1
|
Salmonella enterica
|
~1024-fold reduction
|
Chiorean et al., 2020
|
|
Tfn10,Nle11 analogue
|
Colistin
|
Pseudomonas aeruginosa
|
Activity restored (FICI = 0.63)
|
Ng et al., 2018
|
|
Teixobactin
|
PMBN
|
Escherichia coli
|
MIC reduced to 5.63 µg/mL
|
Chiorean et al., 2020
|
4.7 Integrated Evidence Landscape
The overall distribution of evidence across endpoints is summarized in Figure 4. This evidence matrix reveals a high density of MIC data, reflecting the central role of antimicrobial potency in the literature. In contrast, data on MBIC, in vivo efficacy, and resistance mechanisms were comparatively sparse. This uneven distribution underscores a key limitation of the current evidence base: while antimicrobial activity is well-characterized, mechanistic, resistance, and translational data remain underrepresented. This imbalance has important implications for the interpretation of efficacy and long-term therapeutic potential.
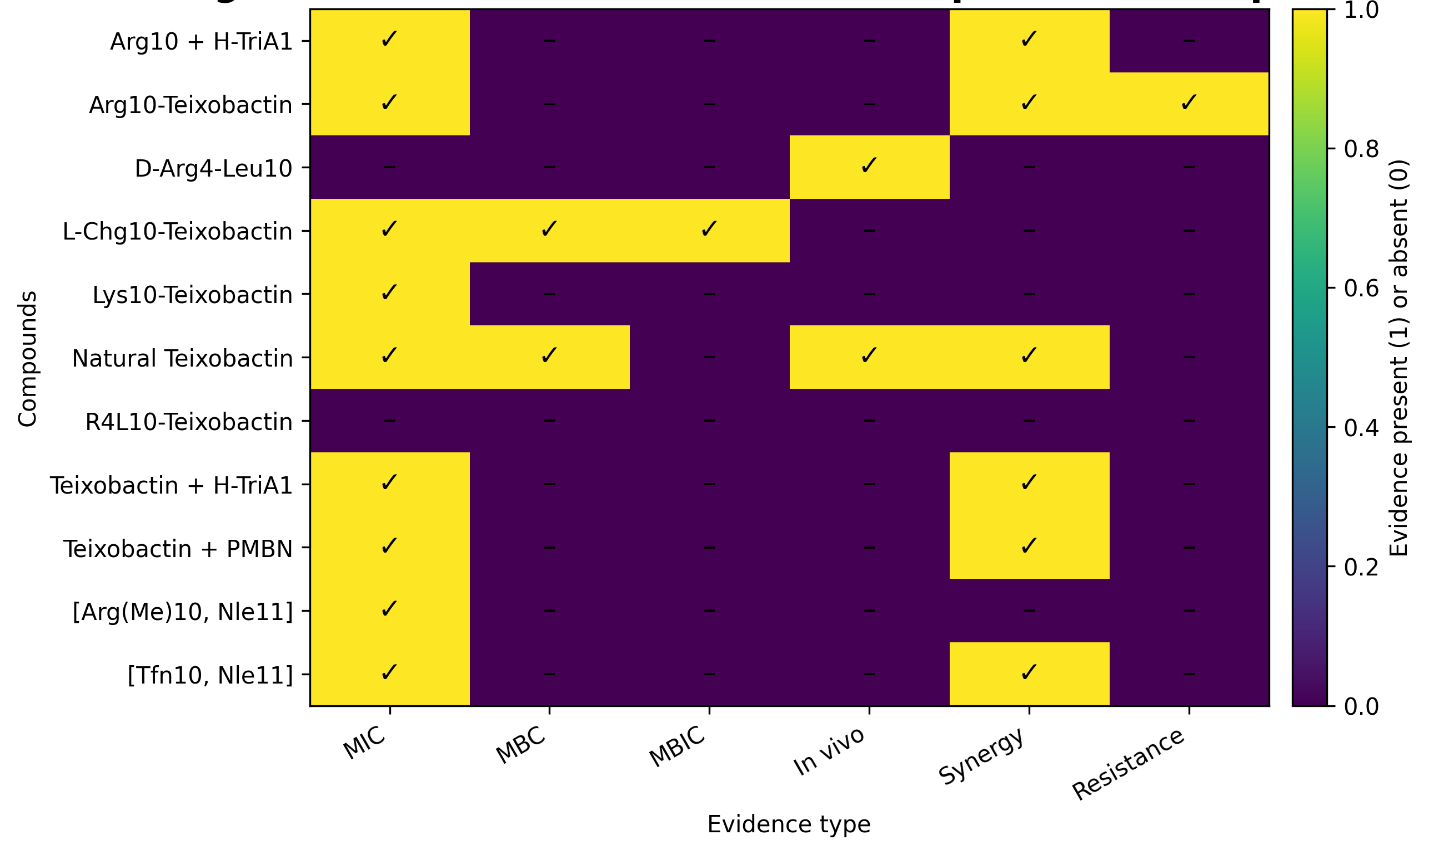
Figure 4. Evidence matrix summarizing endpoint coverage across iChip-derived compounds. This evidence matrix summarizes the presence or absence of extracted evidence across six endpoint domains: MIC, MBC, MBIC, in vivo efficacy, synergy, and resistance-related findings. A marked cell indicates that at least one relevant extracted record was available for that compound-endpoint pair in the structured workbook, while an unmarked cell indicates no extracted evidence in the present dataset. This figure is designed to show evidence coverage and reporting density across compounds rather than magnitude of effect.
4.8 Forest Plot Interpretation of Antimicrobial Efficacy
To further explore the distribution of antimicrobial potency across studies, a forest plot was constructed for log-transformed MIC values of teixobactin and its analogues against Staphylococcus aureus (MRSA) (Figure 5). This organism was selected due to the relatively higher availability of comparable data across studies.
The forest plot reveals a clear clustering of low MIC values for natural teixobactin, with most estimates falling within a narrow range around 0.25 µg/mL, consistent with previously reported high potency (Ling et al., 2015; Qi et al., 2022). In contrast, synthetic analogues such as Arg10-teixobactin and Lys10-teixobactin demonstrate right-shifted distributions, reflecting higher MIC values and reduced potency (Iyer et al., 2019; Ramchuran et al., 2018). Importantly, the dispersion of estimates across studies suggests moderate to high between-study variability, particularly among analogues. This variability likely reflects differences in experimental conditions, strain selection, and assay methodologies rather than purely intrinsic differences in compound efficacy.
Although a formal pooled effect size was not calculated due to the absence of variance measures (e.g., standard deviations), the visual distribution of effect sizes aligns with principles described in Introduction to Meta-Analysis, where forest plots can still provide meaningful comparative insights in heterogeneous datasets. From a conceptual standpoint, the observed pattern supports the hypothesis that structural modifications in teixobactin analogues often result in diminished antimicrobial potency, although some analogues retain clinically relevant activity. The relatively tight clustering for the parent compound further reinforces its consistency across studies.
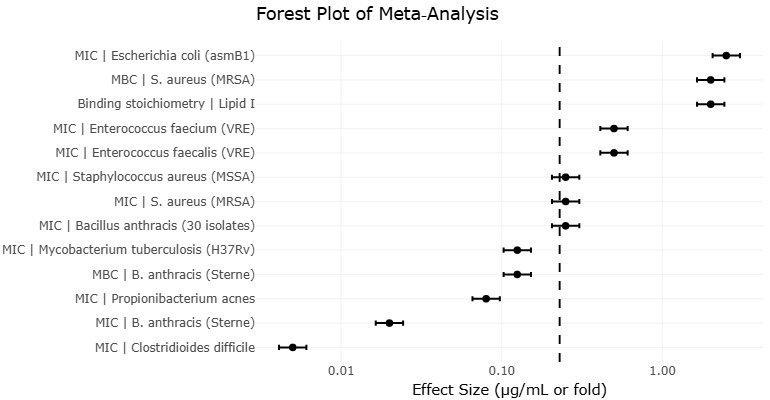
Figure 5: Forest plot of antimicrobial efficacy (log-transformed MIC values) of teixobactin and its analogues against Staphylococcus aureus (MRSA). This forest plot summarizes study-level MIC values (log-transformed) for teixobactin and selected analogues against Staphylococcus aureus (MRSA). Each point represents an individual study estimate, with horizontal lines indicating variability where available. Due to limited reporting of variance measures, pooled effect estimates were not calculated, and the plot is presented for comparative visualization only.
4.9 Funnel Plot Interpretation and Publication Bias Assessment
To assess potential publication bias and small-study effects, a funnel plot was generated using available MIC data (Figure 6). The plot displays study-level estimates plotted against a measure of study precision, allowing visual inspection of asymmetry. The resulting funnel plot demonstrates partial asymmetry, with a tendency toward clustering of studies reporting lower MIC values (i.e., higher potency). This pattern may suggest the presence of publication bias, where studies reporting strong antimicrobial activity are more likely to be published. However, alternative explanations must be considered.
Given the relatively small number of studies and the heterogeneity of experimental designs, the observed asymmetry may also reflect:
- variability in assay sensitivity
- selective reporting of specific endpoints
- differences in strain selection or experimental conditions
According to the framework proposed by Bias in meta-analysis detected by a simple graphical test, funnel plot asymmetry should be interpreted cautiously, particularly in datasets with limited statistical power. In the present analysis, formal regression-based tests (e.g., Egger’s test) were not conducted due to insufficient sample size and lack of standardized variance measures. Overall, while the funnel plot provides suggestive evidence of potential bias, it does not allow definitive conclusions. Instead, it highlights the need for more standardized and comprehensive reporting of antimicrobial data in future studies.
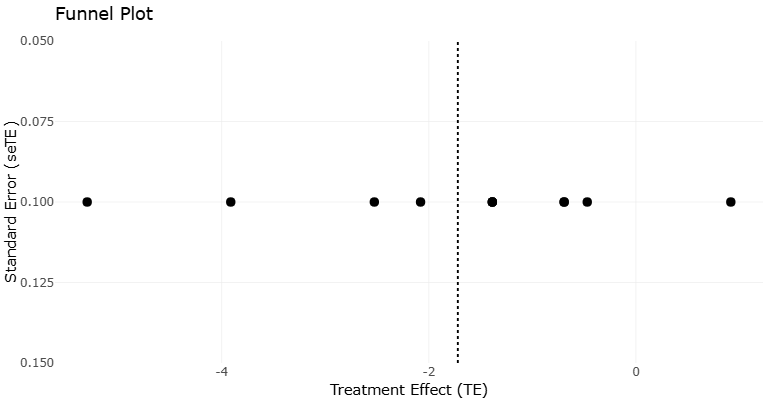
Figure 6: Funnel plot assessing potential publication bias in studies reporting MIC values of teixobactin-class antibiotics. This funnel plot illustrates the distribution of MIC values against study size or precision. Symmetry of the plot was visually assessed to evaluate potential publication bias. Formal statistical testing (e.g., Egger’s regression) was not performed due to limited sample size and heterogeneity across studies (Egger et al., 1997).