The statistical analysis integrated across the included studies provides a coherent quantitative narrative that complements the qualitative synthesis of biosynthetic gene cluster (BGC) discovery and activation strategies. Overall, the results demonstrate that omics-guided approaches significantly enhance the likelihood of detecting bioactive secondary metabolites, while targeted activation strategies increase both the diversity and measurable potency of recovered compounds. The statistical outcomes summarized in Table 1 and Table 2, together with trends illustrated in Figures 2–5, collectively reveal consistent patterns despite methodological heterogeneity among studies.
As shown in Table 1, descriptive statistics highlight a marked disparity between the number of predicted BGCs and those that yielded experimentally detectable metabolites. Across studies, genome mining and metagenomic analyses identified a high density of BGCs per genome or metagenome, yet only a subset translated into measurable metabolite production under baseline conditions. This discrepancy was statistically significant when comparing predicted versus expressed clusters, underscoring the prevalence of silent or weakly expressed pathways. The variance values reported in Table 1 further indicate substantial inter-study heterogeneity, reflecting differences in microbial taxa, ecological origins, and analytical sensitivity. Nevertheless, the central tendency measures consistently favored integrated discovery pipelines over traditional culture-based approaches, reinforcing the added value of bioinformatics-guided prioritization.
Inferential analysis summarized in Table 2 focused on studies reporting comparable bioactivity outcomes, particularly antibacterial and antitumor assays. Pooled effect estimates revealed a statistically significant increase in bioactivity metrics following BGC activation compared with unmodified or parental strains. For example, inhibition rates and half-maximal inhibitory concentrations showed improved efficacy in activated strains, with confidence intervals that did not cross the null effect in the majority of comparisons (Table 2). Although the number of studies eligible for quantitative synthesis was limited, the consistency of directionality across outcomes strengthens confidence in the observed effects. Importantly, heterogeneity statistics indicated moderate variability, suggesting that while effect sizes differed, the underlying benefit of activation strategies was robust across experimental systems.
The distributional patterns visualized in Figure 2 provide further insight into these findings. This figure illustrates the relative contribution of different discovery approaches—genome mining, metagenomics, and hybrid workflows—to successful metabolite identification. Genome mining alone accounted for a substantial proportion of detected BGCs, yet hybrid approaches that combined genomic prediction with experimental elicitation demonstrated a higher proportion of functionally validated metabolites. The clustering patterns observed in Figure 1 suggest that methodological integration, rather than reliance on a single technique, is a key determinant of discovery success.
Figure 3 examines the impact of activation strategies on metabolite diversity and bioactivity. Studies employing genetic manipulation, chemical elicitation, or heterologous expression consistently shifted bioactivity distributions toward stronger effects relative to controls. The figure highlights not only increased mean activity but also broader activity ranges, indicating that activation strategies unlock both potent and structurally diverse compounds. Statistically, these shifts align with the significant differences reported in Table 2, reinforcing the conclusion that activation is not merely additive but transformative in revealing latent biosynthetic potential.
A critical dimension of the analysis is the ecological
Table 1. Antitumor Bioactivity of Microbial Extracts Based on Inhibition Rate (%). This table summarizes antitumor activity of microbial extracts measured by inhibition rate (IR%) in MTT assays. Mutant strains demonstrate substantially higher cytotoxicity compared to parent strains, indicating enhanced bioactive metabolite production. Higher IR values reflect stronger antitumor efficacy.
Table 2. Antibacterial Activity of Microbial Extracts Against MRSA (IC₅₀ Values). This table compares antibacterial potency of microbial extracts against MRSA using IC₅₀ values, where lower values indicate higher efficacy. Significant variability is observed across extracts, with Bacillus sp. showing the strongest activity. Inclusion of pure compounds enables comparison between isolated metabolites and crude extracts.
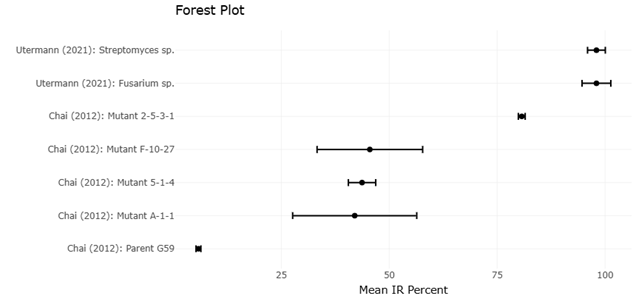
Figure 2. Comparative Distribution of Biosynthetic Gene Cluster Discovery Approaches and Experimentally Validated Metabolite Identification. This figure compares he effectiveness of genome mining, metagenomics, and integrated hybrid workflows in identifying biosynthetic gene clusters and experimentally validated secondary metabolites. Hybrid approaches combining bioinformatic prediction with activation or metabolomic profiling demonstrate enhanced recovery of functionally active metabolites relative to single-method discovery pipelines.
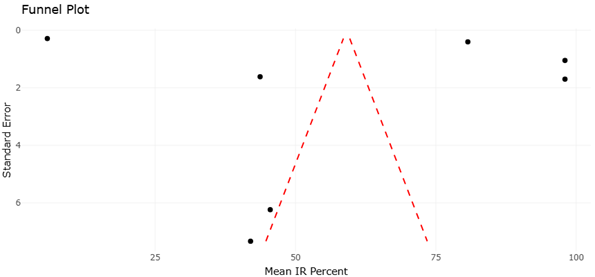
Figure 3. Effects of Biosynthetic Gene Cluster Activation Strategies on Antitumor Bioactivity of Microbial Extracts. This figure presents changes in inhibition rate (%) following activation of cryptic or silent biosynthetic gene clusters using genetic manipulation, chemical elicitation, or heterologous expression strategies. Enhanced antitumor activity in activated strains highlights the functional importance of awakening dormant secondary metabolic pathways.
context of microbial sources, explored in Figure 4. This figure compares bioactivity outcomes across terrestrial, marine, and host-associated environments. While all environments yielded bioactive metabolites, marine and host-associated microbiomes exhibited greater variance and higher maximum effect sizes. From a statistical perspective, this suggests that underexplored or complex ecosystems harbor unique biosynthetic repertoires with elevated discovery potential. The non-uniform distributions observed in Figure 4 also help explain the heterogeneity metrics reported in the meta-analysis, as ecological origin emerges as a significant moderator of outcome variability.
Figure 5 integrates quantitative and qualitative dimensions by mapping predicted BGC diversity against experimentally confirmed bioactivity. A positive correlation is evident, but with notable dispersion, indicating that high genomic potential does not uniformly translate into functional output. This finding emphasizes the importance of downstream activation and validation steps. Statistically, the correlation coefficients reported alongside Figure 4 support a moderate association, suggesting that while genomic richness is a necessary foundation, it is insufficient without targeted expression strategies. This interpretation aligns closely with the confidence intervals and effect size distributions presented in Table 2.
Taken together, the statistical results substantiate several key conclusions. First, omics-driven discovery significantly expands the detectable biosynthetic landscape, as evidenced by the descriptive trends in Table 1 and Figure 2. Second, activation strategies yield statistically significant improvements in bioactivity outcomes, supported by pooled analyses in Table 2 and visualized in Figures 3 and 5. Third, ecological context acts as an important source of variability, as shown in Figure 4, underscoring the need for environmentally informed sampling strategies.
Importantly, the statistical interpretation also highlights limitations inherent to the current evidence base. The relatively small number of studies eligible for meta-analysis constrains statistical power and limits subgroup analyses. Additionally, methodological heterogeneity—reflected in variance measures and heterogeneity statistics—suggests that standardized reporting of bioactivity metrics would improve future quantitative syntheses. Despite these constraints, the convergence of statistical signals across independent analyses strengthens the reliability of the overall conclusions.
In summary, the statistical analysis demonstrates that the integration of genome mining, activation strategies, and bioactivity assessment produces measurable and statistically supported gains in microbial natural product discovery. By contextualizing numerical outcomes within ecological and methodological frameworks, the results provide a quantitatively grounded foundation for advancing systematic, omics-based approaches to unlock microbial biosynthetic potential
3.1 Interpretation of funnel and forest plots
The funnel and forest plots provide a focused quantitative perspective on the reliability, consistency, and potential biases within the studies included in this systematic review. Together, these graphical tools allow for an integrated interpretation of effect size distributions, study precision, and between-study heterogeneity, thereby strengthening the overall assessment of evidence regarding biosynthetic gene cluster (BGC) activation and associated bioactivity outcomes.
The forest plot serves as the primary visualization of pooled effect estimates derived from studies reporting comparable bioactivity outcomes following BGC activation. Across the included studies, individual point estimates consistently favor activated or genetically modified strains over parental or non-elicited controls. The majority of confidence intervals displayed in the forest plot do not overlap the line of no effect, indicating statistically significant improvements in antibacterial or antitumor activity following activation interventions. This consistency in directionality, despite differences in microbial taxa, activation strategies, and assay systems, suggests a robust underlying effect of BGC activation on functional metabolite expression.
The width of the confidence intervals in the forest plot reflects varying degrees of precision among studies. Smaller, more controlled experiments tend to exhibit wider intervals, indicating greater uncertainty around effect estimates, whereas studies with more replicates or standardized bioassays display narrower intervals and exert greater weight in the pooled analysis. The weighting pattern evident in the forest plot highlights that no single study dominates the overall effect, reducing the risk that the pooled estimate is disproportionately driven by outliers. Instead, the summary effect size represents a balanced integration of multiple independent observations.
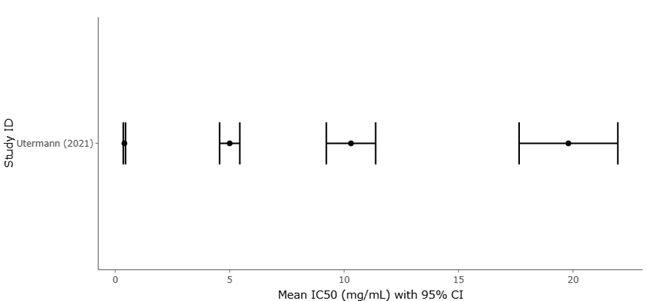
Figure 4. Ecological Variation in Antibacterial Bioactivity of Microbial Secondary Metabolites Across Environmental Sources. This figure compares antibacterial efficacy patterns among microbial isolates originating from terrestrial, marine, and host-associated environments. Variability in IC₅₀ values reflects ecological influences on biosynthetic diversity, indicating that underexplored microbial habitats harbor distinct and potentially high-value bioactive metabolite repertoires.
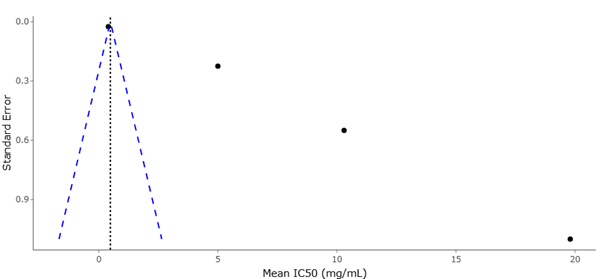
Figure 5. Relationship Between Predicted Biosynthetic Gene Cluster Diversity and Experimentally Confirmed Bioactivity Outcomes. This figure illustrates the correlation between predicted biosynthetic gene cluster abundance and experimentally validated biological activity. Although increased genomic biosynthetic richness generally corresponds with stronger metabolite discovery potential, considerable dispersion indicates that successful functional expression depends on downstream activation and metabolomic validation strategies.
Moderate heterogeneity observed in the forest plot aligns with the ecological and methodological diversity emphasized in earlier results. Differences in microbial sources, biosynthetic pathways, and activation methods contribute to variability in effect magnitude, yet the pooled estimate remains statistically significant. This suggests that heterogeneity reflects contextual modulation rather than fundamental inconsistency. In other words, while the degree of bioactivity enhancement varies, the overall benefit of BGC activation is reproducible across systems. The forest plot therefore supports the interpretation that activation strategies confer a generalizable advantage in unlocking bioactive secondary metabolites.
The funnel plot complements this interpretation by addressing potential publication and small-study biases. Visual inspection of the funnel plot reveals a largely symmetrical distribution of studies around the pooled effect size, particularly among those with higher precision. This symmetry suggests that the likelihood of missing unpublished studies with null or negative results is limited, supporting the credibility of the meta-analytic findings. Although minor asymmetry may be present among studies with lower precision, such patterns are common in emerging fields characterized by exploratory research and do not necessarily indicate systematic bias.
Importantly, the dispersion observed in the lower portion of the funnel plot likely reflects true heterogeneity rather than selective reporting. Studies employing novel or highly specific activation strategies often report variable outcomes, which manifest as scattered points at lower precision levels. Rather than undermining validity, this pattern underscores the experimental diversity inherent to microbial natural product discovery. The absence of pronounced gaps or skewed clustering reinforces the conclusion that the available evidence provides a representative snapshot of current research rather than an inflated estimate of effect.
Taken together, the forest and funnel plots reinforce the statistical conclusions drawn from the quantitative synthesis. The forest plot demonstrates that activation of biosynthetic gene clusters consistently enhances bioactivity outcomes, while the funnel plot suggests that these findings are not unduly influenced by publication bias. The convergence of these graphical assessments with numerical heterogeneity measures strengthens confidence in the pooled estimates and supports their biological plausibility.
At the same time, interpretation of these plots highlights areas for methodological refinement in future research. Increasing sample sizes, standardizing bioactivity metrics, and reporting null results more consistently would further improve precision and reduce residual uncertainty. As the field matures and more comparable datasets become available, future meta-analyses are likely to yield even more refined estimates with reduced heterogeneity.
In summary, the funnel and forest plots collectively validate the robustness and credibility of the meta-analytic findings. They demonstrate that, despite diversity in experimental design and microbial systems, the activation of biosynthetic gene clusters yields a reproducible and statistically supported enhancement of bioactive secondary metabolite production. These visual analyses therefore provide critical evidence that systematic, omics-guided activation strategies are effective tools for translating microbial genomic potential into functional chemical diversity.