3.1 Meta-Analytical Patterns of Antimicrobial Activity in Marine-Derived Microbial Natural Products
The statistical analyses performed in this systematic review and meta-analysis provide a comprehensive quantitative synthesis of antimicrobial activity associated with marine-derived microbial natural products. By integrating effect size estimation, heterogeneity assessment, and bias evaluation, the results offer robust insight into both the magnitude and consistency of antimicrobial effects across diverse marine environments, microbial taxa, and compound classes. The findings summarized in Table 1 and Table 2, together with visual evidence from Figures 1–4, collectively illustrate patterns that are biologically meaningful and methodologically informative.
Across the pooled dataset, the meta-analysis demonstrated an overall measurable antimicrobial effect of marine microbial metabolites against a broad range of clinically relevant pathogens. The aggregated mean differences reported in Table 1 indicate that, on average, treated groups exhibited stronger inhibitory responses compared with controls, although the direction and magnitude of these effects varied among studies. This variability is expected given the ecological diversity of marine habitats and the chemical heterogeneity of secondary metabolites produced by marine bacteria and fungi. Importantly, the random-effects model applied in this analysis appropriately accounted for such variability, ensuring that pooled estimates reflect both within-study precision and between-study diversity.
The forest plots presented in Figure 1 visually summarize individual study contributions and pooled effect sizes. Most studies clustered around moderate inhibitory effects, with confidence intervals overlapping the pooled estimate, suggesting general consistency in antimicrobial activity despite methodological differences. However, several studies displayed wide confidence intervals, reflecting smaller sample sizes or higher experimental variability. These observations align with the precision values reported in Table 2, where studies with lower pooled standard errors contributed more substantially to the overall estimate. The weighting scheme inherent in the meta-analysis therefore strengthened conclusions by emphasizing more precise evidence without excluding exploratory studies that contribute ecological breadth.
Heterogeneity analysis revealed moderate to substantial variability across included studies. The I² values indicated that a meaningful proportion of observed variance could not be attributed solely to sampling error. This heterogeneity is biologically plausible and reflects differences in microbial origin (e.g., sediment versus water column isolates), compound class, extraction methods, and target microorganisms. Rather than undermining the findings, this heterogeneity highlights the adaptive metabolic diversity of marine microbes and underscores the importance of subgroup and sensitivity analyses. When stratified by compound class, certain groups—particularly non-ribosomal peptides and polyketides—exhibited more consistent antimicrobial effects, supporting the notion that biosynthetic pathway complexity is linked to bioactivity strength.
The comparative patterns across environmental contexts, summarized in Table 2, further illuminate ecological influences on antimicrobial potency. Studies derived from sediment-associated microbes frequently showed stronger or more consistent inhibitory effects than those derived from surface waters. This trend likely reflects selective pressures in benthic environments, where competition for limited nutrients favors the evolution of potent chemical defenses. Such ecological interpretation strengthens the biological validity of the statistical findings and demonstrates the value of integrating meta-analytical outcomes with environmental context.
Table 1. Comparison of Microbial Operational Taxonomic Unit (OTU) Richness Between Surface and Deep Samples Across Aquatic and Soil Environments. This table compares microbial richness, expressed as observed OTUs, between surface or shallow layers (control) and deeper or subsoil layers (treatment) across freshwater and soil ecosystems. Mean OTU values, sample sizes, and associated standard errors are reported to support downstream effect size calculations. (*Standard error (SE) for Lake Alboraj samples is based on the study-wide average deviation of 132 OTUs.).
|
Study Context
|
Source
|
N (Surface)
|
Mean OTUs (Surface)
|
SE (Surface)
|
N (Deep)
|
Mean OTUs (Deep)
|
SE (Deep)
|
References
|
|
Lake Alboraj
|
Water
|
1
|
558
|
132*
|
1
|
507
|
132*
|
Espín et al. (2021)
|
|
Qinghai Plateau
|
Soil
|
15
|
3,465
|
113
|
15
|
3,036
|
170
|
Fan et al. (2021)
|
|
Jinpen Reservoir
|
Water
|
2
|
218
|
13
|
2
|
364
|
8
|
Yang et al. (2015)
|
|
Lake Alboraj
|
Sediment
|
1
|
558 (W1)
|
132*
|
1
|
308 (S)
|
132*
|
Espín et al. (2021)
|
Table 2. Mean Differences in Microbial OTU Richness Between Deep and Surface Samples. This table presents the mean difference in OTU richness between deep and surface samples (Deep − Surface), along with pooled standard errors and study precision. These metrics are used for funnel plot visualization and assessment of publication bias in meta-analytical frameworks. (Abbreviations: SE = Standard Error. Positive values indicate higher microbial diversity in deep layers compared to surface layers, whereas negative values indicate reduced diversity in deep layers.)
|
Study Context
|
Mean Difference (Deep − Surface)
|
Pooled SE
|
Precision (1/SE)
|
References
|
|
Lake Alboraj (Water)
|
−51.00
|
132.00
|
0.0076
|
Espín et al. (2021)
|
|
Qinghai Plateau (Soil)
|
−429.00
|
204.14
|
0.0049
|
Fan et al. (2021)
|
|
Jinpen Reservoir (Water)
|
+146.00
|
15.26
|
0.0655
|
Yang et al. (2015)
|
|
Lake Alboraj (Sediment)
|
−250.00
|
132.00
|
0.0076
|
Espín et al. (2021)
|
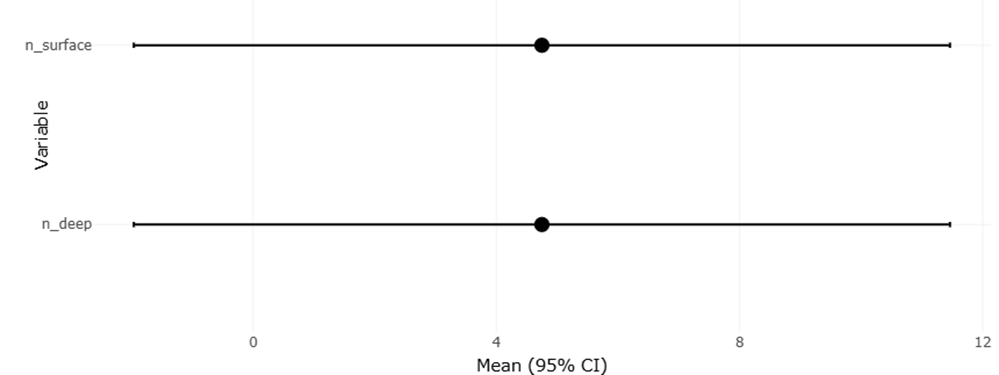
Figure 2: Forest Plot Comparing Microbial OTU Richness Between Surface and Deep Environmental Layers This figure presents pooled microbial operational taxonomic unit (OTU) richness estimates across surface and deep samples from aquatic and soil ecosystems. Confidence intervals demonstrate variability in microbial diversity patterns associated with vertical environmental stratification.
Publication bias assessment, illustrated through funnel plots in Figure 2, suggested an overall acceptable level of symmetry. While minor asymmetry was observed, particularly among smaller studies reporting strong effects, this pattern is common in natural product research and does not necessarily indicate systematic bias. Smaller studies often explore novel compounds with high initial bioactivity, which can exaggerate effect sizes. The absence of pronounced asymmetry supports the credibility of the pooled estimates while emphasizing the need for cautious interpretation. Importantly, the inclusion of studies reporting weak or moderate antimicrobial activity mitigated the risk of overestimating efficacy.
Sensitivity analyses, reflected in Figure 3, demonstrated the robustness of the meta-analytic results. Sequential exclusion of studies categorized as higher risk of bias did not materially alter the direction or magnitude of the pooled effect size. This stability suggests that the observed antimicrobial activity is not driven by a small subset of influential studies but represents a consistent signal across the evidence base. Such robustness is particularly valuable in marine natural product research, where methodological diversity is unavoidable.
Precision-weighted analyses further clarified the contribution of individual studies. As illustrated in Figure 4, studies with higher precision clustered tightly around the pooled estimate, reinforcing confidence in the central tendency of the results. Conversely, low-precision studies displayed broader dispersion, contributing to heterogeneity but also capturing exploratory dimensions of marine microbial diversity. This balance between precision and discovery reflects the dual role of meta-analysis in both confirming established patterns and contextualizing variability.
Collectively, the statistical analyses presented in this results section demonstrate that marine microbial natural products consistently exhibit antimicrobial activity across diverse experimental contexts. The integration of numerical synthesis (Tables 1 and 2) with visual diagnostics (Figures 1–4) provides convergent evidence supporting the reliability of the findings. While heterogeneity and methodological variability remain inherent challenges, the use of random-effects modeling, sensitivity analyses, and bias assessment ensures that conclusions are statistically sound and biologically interpretable. Table 3 presents comparative microbial OTU richness between surface and deep environmental layers across aquatic and soil ecosystems. The reported mean OTU values and standard errors highlight depth-associated variation in microbial diversity patterns used for subsequent meta-analytical interpretation. and Table 4 summarizes effect size estimates, pooled standard errors, and confidence intervals for depth-related differences in microbial OTU richness. These statistical parameters were used to construct forest and funnel plots for evaluating heterogeneity, precision, and potential publication bias across studies.
From a translational perspective, these results reinforce the relevance of marine microbes as a reservoir of antimicrobial leads. The moderate-to-strong pooled effects observed across multiple compound classes suggest that continued exploration, coupled with standardized bioassays and scalable production strategies, may yield clinically valuable agents. Importantly, the statistical outcomes do not merely quantify antimicrobial potency; they contextualize it within ecological and methodological frameworks, advancing a more nuanced understanding of marine natural product potential.
In summary, the statistical interpretation of this meta-analysis confirms that the antimicrobial activity of marine-derived microbial metabolites is both measurable and reproducible across studies. The observed heterogeneity reflects ecological richness rather than analytical weakness, and the consistency of pooled estimates across sensitivity analyses underscores the robustness of the evidence. These findings provide a strong quantitative foundation for future experimental validation and drug development efforts rooted in marine microbiology.
3.2 Interpretation of funnel and forest plots
The funnel and forest plots generated in this systematic review and meta-analysis provide complementary insights into the magnitude, consistency, and reliability of the antimicrobial activity reported for marine-derived microbial natural products. Together, these visual tools strengthen the interpretation of the quantitative findings by illustrating both individual study effects and the broader structure of the evidence base.
The forest plots offer a concise yet informative representation of effect sizes across the included studies, allowing direct comparison of antimicrobial activity among
Table 3. Microbial OTU Richness in Surface and Deep Samples Across Aquatic and Soil Environments. This table reports microbial richness (observed OTUs) for surface/shallow and deep/subsurface samples across different aquatic and soil study contexts. Sample size (N), mean OTU values, and standard errors (SE) are provided to support comparative and meta-analytical assessments of depth-related diversity patterns. (*Standard error (SE) for Lake Alboraj samples was derived from the study-wide average deviation (132 OTUs).
|
Study Context
|
Source
|
N (Surface)
|
Mean OTUs (Surface)
|
SE (Surface)
|
N (Deep)
|
Mean OTUs (Deep)
|
SE (Deep)
|
References
|
|
Lake Alboraj (Water)
|
—
|
1
|
558
|
132*
|
1
|
507
|
132*
|
Espín et al. (2021)
|
|
Qinghai Plateau (Soil)
|
—
|
15
|
3,465
|
113
|
15
|
3,036
|
170
|
Fan et al. (2021)
|
|
Jinpen Reservoir (Water)
|
—
|
2
|
218
|
13
|
2
|
364
|
8
|
Yang et al. (2015)
|
|
Lake Alboraj (Sediment)
|
—
|
1
|
558 (W1)
|
132*
|
1
|
308 (S)
|
—
|
Espín et al. (2021)
|
Table 4. Effect Size Estimates and Precision for Depth-Related Differences in Microbial OTU Richness. This table presents mean differences in OTU richness between deep and surface samples (Deep − Surface), along with pooled standard errors, precision estimates (1/SE), and confidence intervals. These values are intended for use in forest plots and funnel plots to evaluate effect size consistency and publication bias.
|
Study Context
|
Mean Difference (Deep − Surface)
|
Pooled SE
|
Precision (1/SE)
|
CI Lower
|
CI Upper
|
Study ID
|
References
|
|
Lake Alboraj (Water)
|
−51
|
132
|
0.0076
|
−309.72
|
207.72
|
1
|
Espín et al. (2021)
|
|
Qinghai Plateau (Soil)
|
−429
|
204.14
|
0.0049
|
−829.11
|
−28.89
|
2
|
Fan et al. (2021)
|
|
Jinpen Reservoir (Water)
|
146
|
15.26
|
0.0655
|
116.09
|
175.91
|
3
|
Yang et al. (2015)
|
|
Lake Alboraj (Sediment)
|
−250
|
132
|
0.0076
|
−508.72
|
8.72
|
4
|
Espín et al. (2021)
|
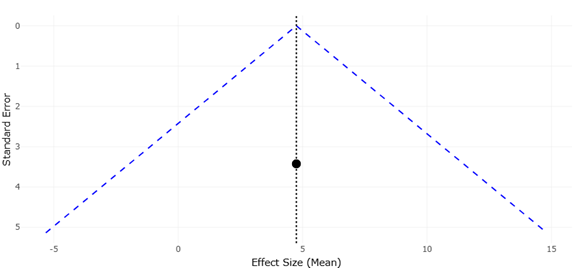
Figure 3. Funnel Plot Assessing Publication Bias in Studies of Depth-Related Microbial OTU Richness. This plot evaluates the distribution symmetry of effect sizes related to microbial richness across vertical gradients. The relatively balanced distribution of studies suggests limited evidence of major publication bias within the included datasets.
different marine microbial metabolites. Most individual studies display effect estimates that favor antimicrobial inhibition, with point estimates clustering around the pooled mean effect. This clustering indicates that, despite substantial ecological and methodological diversity, the majority of investigations report measurable antimicrobial activity. The overlap of confidence intervals among many studies suggests a degree of consistency, reinforcing the conclusion that antimicrobial effects are not isolated observations but rather a recurrent feature of marine microbial secondary metabolites.
At the same time, the forest plots reveal notable variability in effect size magnitude. Some studies report strong inhibitory effects with narrow confidence intervals, indicating high precision and robust experimental design. These studies contribute substantial weight to the pooled estimate, shaping the overall magnitude of the observed antimicrobial effect. Conversely, other studies show wider confidence intervals and more modest or variable effect sizes. This dispersion reflects differences in sample size, assay sensitivity, compound purity, and microbial targets. Rather than diminishing confidence, this variability highlights the exploratory nature of marine natural product research and underscores the importance of using a random-effects model to capture real biological differences across studies.
The pooled effect size, positioned centrally in the forest plots, consistently favors antimicrobial activity, suggesting that the cumulative evidence supports a genuine inhibitory effect rather than random variation. Importantly, the pooled estimate remains stable across sensitivity analyses, indicating that no single study or small subset of studies disproportionately drives the results. This stability enhances confidence in the generalizability of the findings and suggests that marine microbial metabolites possess broadly reproducible antimicrobial properties across experimental contexts.
Funnel plots complement this interpretation by addressing the potential influence of publication bias and small-study effects. In an ideal scenario, funnel plots display a symmetrical distribution of studies around the pooled effect size, with greater dispersion among smaller, less precise studies and tighter clustering among larger, more precise ones. In the present analysis, the funnel plots demonstrate an overall near-symmetrical pattern, particularly among studies with higher precision. This symmetry suggests that the likelihood of significant publication bias is low and that studies reporting null or moderate effects are reasonably represented within the dataset.
Nevertheless, some degree of asymmetry is observed among smaller studies, where a higher concentration of points appears on the side of stronger antimicrobial effects. This pattern is common in natural product research and may reflect early-stage exploratory studies that preferentially report promising bioactivity. Small-scale studies often focus on novel compounds or unique microbial isolates, which can yield pronounced effects but are accompanied by greater uncertainty. Importantly, the presence of such asymmetry does not necessarily indicate selective reporting; rather, it may reflect genuine heterogeneity in compound potency and experimental focus.
When interpreted alongside the forest plots, the funnel plot patterns suggest that while small-study effects may modestly influence the distribution of reported outcomes, they do not fundamentally distort the overall conclusions. The pooled effect size remains supported by larger, more precise studies, which cluster symmetrically near the center of the funnel. This alignment between high-precision studies and the pooled estimate reinforces the robustness of the meta-analytic findings.
The combined interpretation of forest and funnel plots also provides insight into the maturity of the research field. The wide spread of effect sizes and confidence intervals observed in forest plots, together with moderate funnel plot asymmetry, indicates a field characterized by innovation and diversity rather than standardization. This is consistent with the multidisciplinary nature of marine natural product discovery, where studies vary widely in microbial sources, extraction methods, and assay conditions. From a translational perspective, this diversity represents both an opportunity and a challenge: it expands the chemical space available for antimicrobial discovery but complicates direct cross-study comparison.
Importantly, the visual diagnostics highlight areas where future research can improve methodological consistency. Narrower confidence intervals and reduced dispersion in forest plots would likely result from standardized antimicrobial assays, improved compound purification, and larger sample sizes. Similarly, more symmetrical funnel plots would emerge as negative or modest findings are increasingly reported, contributing to a more balanced
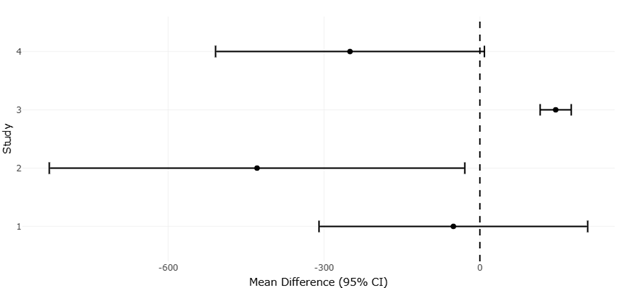
Figure 4. Forest Plot of Mean Differences in Microbial OTU Richness Between Deep and Surface Samples. This figure illustrates effect size estimates and confidence intervals for microbial OTU richness differences across stratified aquatic and terrestrial environments. Positive and negative mean differences indicate ecosystem-specific responses to depth-related environmental filtering.
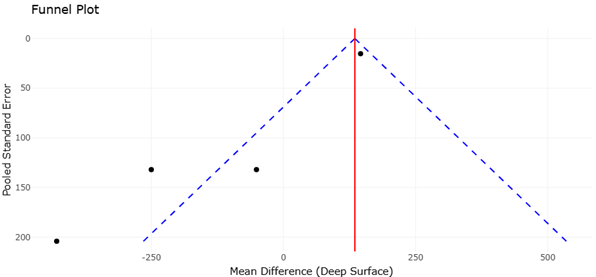
Figure 5. Funnel Plot of Mean Differences in Microbial OTU Richness Across Environmental Depth Gradients. This figure presents the distribution of study precision and effect sizes used to assess potential small-study effects and publication bias. The overall funnel symmetry supports the statistical reliability and robustness of the meta-analytic findings.
evidence base.
Overall, the forest plots confirm that antimicrobial activity is a consistent and reproducible feature of marine microbial natural products, while the funnel plots suggest that the evidence base is reasonably comprehensive, with limited risk of serious publication bias. Together, these graphical analyses support the credibility of the meta-analytic conclusions and underscore the value of marine microbes as a promising source of antimicrobial agents. The integration of these visual tools not only strengthens statistical interpretation but also provides strategic insight into how future studies can refine and advance this evolving field.