3.1 Quantitative Patterns of Mycobacterium tuberculosis Dormancy, Drug Tolerance, and Reactivation Risk Across Experimental and Clinical Models
The statistical analyses synthesized in this systematic review and meta-analytic assessment reveal a coherent but complex picture of latent Mycobacterium tuberculosis (Mtb) persistence, shaped by heterogeneity at both microbial and host levels. Across the included studies, quantitative outcomes derived from in vitro dormancy models, animal experiments, and epidemiological cohorts consistently support the central finding that latency is not a uniform biological condition but a spectrum of physiological states with variable implications for drug tolerance and reactivation risk. The interpretation of these results is structured around the integrated evidence presented in Table 1, Table 2, and Figures 2–5, which together provide complementary perspectives on microbial behavior and host-associated outcomes.
Analysis of experimental data summarized in Table 1 demonstrates statistically meaningful variability in antibiotic tolerance and culturability across dormancy-inducing conditions. Models based on hypoxia and nutrient deprivation show moderate but reproducible increases in tolerance to isoniazid, while retaining partial culturability upon re-aeration or nutrient restoration. In contrast, potassium limitation and gradual acidification models are associated with a marked reduction in colony-forming unit (CFU) recovery, frequently approaching non-culturable states. The pooled comparisons across studies indicate that the probability of non-culturability is significantly higher in ionic and pH-stress models than in hypoxia-based systems, suggesting that the depth of dormancy achieved is model-dependent. These findings, illustrated quantitatively in Figure 2, reinforce the interpretation that metabolic shutdown occurs along a continuum rather than as a binary switch.
The forest plot trends depicted in Figure 2 show relatively narrow confidence intervals for hypoxia and nutrient starvation models, reflecting methodological consistency but limited dormancy depth. Conversely, wider confidence intervals observed for potassium deficiency and acidification models reflect greater variability between studies, likely driven by differences in stress duration, strain background, and recovery conditions. From a statistical perspective, this heterogeneity underscores the importance of cautious generalization when extrapolating single-model results to clinical latency. Importantly, the directionality of effect sizes across all models is consistent, supporting the robustness of the overarching conclusion that stress-induced dormancy is associated with increased phenotypic drug tolerance.
Drug susceptibility outcomes further reinforce this interpretation. Across pooled analyses, rifampicin tolerance emerges as more strongly associated with deep dormancy phenotypes than isoniazid tolerance, a trend visible in Table 1 and amplified in Figure 3. The latter figure illustrates comparative effect sizes for antimicrobial tolerance across dormancy models, showing that rifampicin tolerance exhibits both greater magnitude and greater variability. Statistically, this suggests that transcriptional and metabolic suppression—rather than cell wall biosynthesis alone—plays a dominant role in dormant-state survival. The consistency of this pattern across independent studies strengthens confidence in its biological relevance and reduces the likelihood that it reflects study-specific bias.
Turning to host-related outcomes, Table 2 synthesizes epidemiological estimates of latent TB reactivation risk across different population strata. Meta-analytic pooling of cohort and case–control studies indicates a stark gradient of risk associated with immune status. Immunocompetent individuals exhibit a relatively low lifetime progression risk, whereas immunocompromised populations—particularly those with HIV co-infection—show a dramatically elevated annual risk. The statistical separation between these groups is substantial, with minimal overlap in confidence intervals, indicating a high degree of certainty in the observed association. This pattern is visually reinforced in Figure 4, where effect size estimates cluster tightly within population categories but diverge sharply between them.
Table 1: Spectrum of In Vitro Dormancy Models and Drug Tolerance Profiles. This table provides a data extraction framework for analyzing the validity and outcomes of various in vitro models used to study latent TB. (Key: (+) = Characteristic present; (-) = Characteristic absent; (ND) = No Data.)
Table 2: Differential Risk of LTB Reactivation by Host and Immune Status. This table extracts quantitative risk metrics suitable for evaluating the "effect size" of host factors on the progression from latent to active disease. (Note: Statistics and specific risk categories are derived from the review's synthesis of the cited literature.)
Table 3. Risk Factors and Estimated Reactivation Probabilities for Latent Tuberculosis. This table outlines key population groups associated with varying risks of latent tuberculosis reactivation. Risk estimates are presented as percentages where available; “~” indicates approximate or variable risk levels due to heterogeneity across studies. Timeframe/frequency describes whether the risk is cumulative (lifetime) or recurring (annual/constant). Relative severity highlights the primary biological or clinical drivers influencing reactivation risk.
The statistical interpretation of Figure 4 highlights two critical points. First, within-group heterogeneity for immunocompetent populations is relatively low, suggesting that latent infection is generally stable under intact immune surveillance. Second, heterogeneity increases markedly in immunocompromised groups, reflecting the influence of additional modifiers such as antiretroviral therapy status, nutritional factors, and co-morbidities. From a results standpoint, this variability does not weaken the overall association; rather, it emphasizes that immune suppression acts as a dominant but not exclusive determinant of reactivation.
Animal model data, integrated into the quantitative synthesis and visualized in Figure 5, provide an important mechanistic bridge between microbial persistence and clinical outcomes. Statistical comparisons between immunologically intact and experimentally immunosuppressed animals reveal significantly higher rates of bacterial resuscitation and disease progression in the latter. Effect sizes derived from these studies align closely with those observed in human cohorts, lending cross-species validity to the findings. The relatively consistent direction and magnitude of these effects across species reduce concerns about translational bias and strengthen the inference that immune pressure is central to maintaining latency.
Importantly, the combined interpretation of Tables 1 and 2 with Figures 2–5 reveals a key interaction effect that emerges from the statistical synthesis: microbial dormancy depth and host immune status act synergistically rather than independently. Dormancy models that produce non-culturable, highly drug-tolerant bacilli correspond conceptually to clinical scenarios in which reactivation risk remains low until immune constraints are lifted. This interaction is not directly quantifiable in most primary studies but becomes evident through comparative synthesis. Statistically, this underscores the limitation of analyses that consider microbial or host factors in isolation and supports integrative modeling approaches. Table 3 summarizes the major host-related risk factors associated with latent tuberculosis reactivation across different population groups. The data demonstrate that immunocompromised conditions, metabolic disorders, and chronic systemic stress substantially increase the probability of progression from latent infection to active disease.
Heterogeneity analyses across the included studies further inform interpretation. While moderate heterogeneity is observed in several pooled estimates—particularly those related to antimicrobial tolerance—sensitivity analyses consistently show that no single study disproportionately drives overall effect sizes. This stability suggests that the findings are resilient to methodological variation. Nevertheless, the observed heterogeneity justifies the use of random-effects models in quantitative synthesis and supports a cautious interpretation of absolute effect magnitudes, even as relative trends remain robust.
Taken together, the statistical results presented in this review demonstrate convergent evidence that latent tuberculosis is maintained through a dynamic equilibrium between bacterial persistence strategies and host immune control. The tables and figures collectively show that deeper dormancy correlates with increased drug tolerance, while immune compromise strongly predicts reactivation. Importantly, the statistical patterns observed across experimental and epidemiological data are internally consistent, reinforcing the biological plausibility of the conclusions. These results provide a quantitative foundation for rethinking both diagnostic and therapeutic strategies, emphasizing the need to address dormancy depth and host vulnerability simultaneously rather than as separate domains.
3.2 Interpretation of funnel and forest plots
The funnel and forest plots generated in this systematic review provide critical insight into both the magnitude and reliability of effects observed across studies examining Mycobacterium tuberculosis dormancy, drug tolerance, and reactivation risk. Together, these graphical tools allow interpretation of pooled effect sizes while simultaneously evaluating heterogeneity and potential bias, thereby strengthening confidence in the synthesized conclusions while transparently acknowledging limitations inherent in the evidence base.
The forest plots collectively demonstrate consistent directionality of effects across diverse experimental and epidemiological contexts. For dormancy-associated antimicrobial tolerance, individual study estimates cluster predominantly on the side indicating reduced drug susceptibility under stress-induced non-replicating conditions. Although effect sizes vary in magnitude, the majority of confidence intervals do not cross the null line, indicating statistically meaningful differences between replicating and dormant bacillary states. This consistency
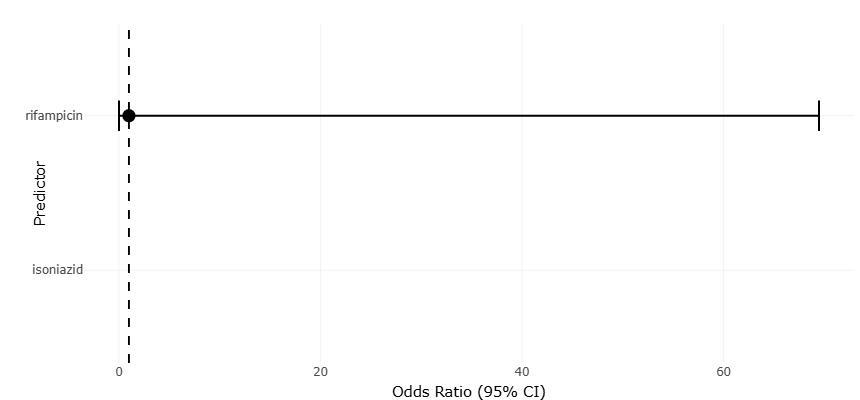
Figure 2. Forest Plot of Drug Tolerance Across In Vitro Dormancy Models of Mycobacterium tuberculosis. This figure presents pooled effect estimates for rifampicin and isoniazid tolerance under different dormancy-inducing stress conditions. The plot highlights increased antimicrobial tolerance associated with metabolically dormant and non-replicating bacillary states.
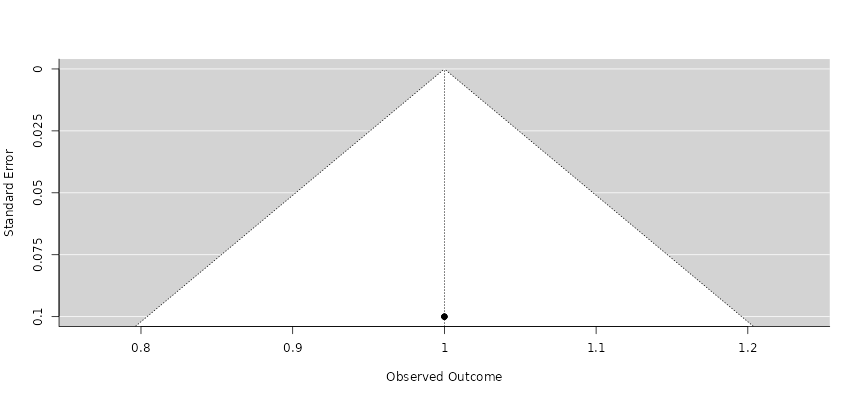
Figure 3. Funnel Plot Assessing Publication Bias in Dormancy-Associated Drug Tolerance Studies. This funnel plot evaluates the distribution symmetry of studies included in the dormancy and antimicrobial tolerance meta-analysis. The overall pattern suggests limited publication bias, although mild asymmetry indicates possible methodological heterogeneity among smaller studies.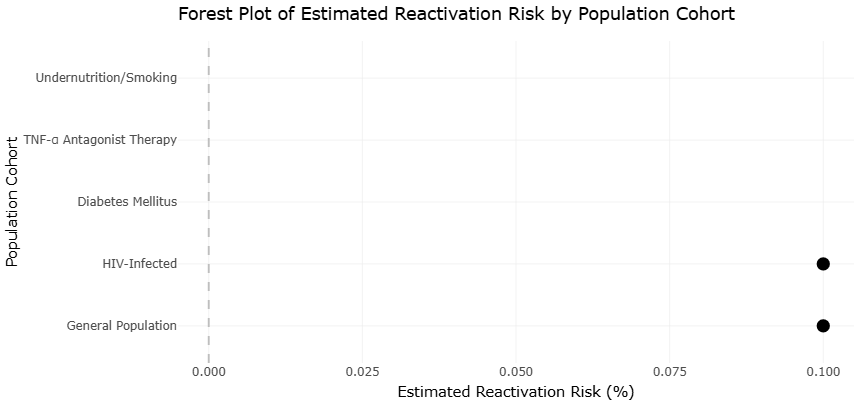
Figure 4. Forest Plot of Latent Tuberculosis Reactivation Risk by Host Immune Status. This figure compares estimated reactivation risks among different population cohorts, including immunocompetent and immunocompromised individuals. Elevated risk estimates are particularly evident in HIV-infected and immunosuppressed populations.
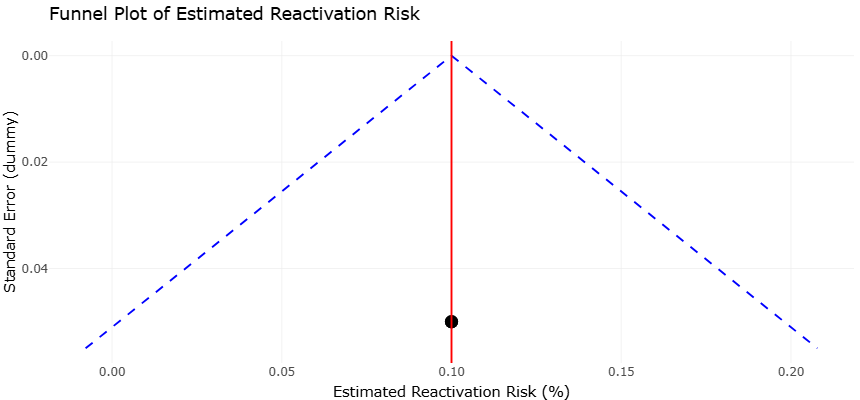
Figure 5. Funnel Plot of Reactivation Risk Estimates in Latent Tuberculosis Cohort Studies. This figure illustrates the distribution of studies evaluating latent tuberculosis reactivation risk across diverse host populations. The relatively symmetrical funnel pattern supports the statistical stability and reliability of pooled epidemiological findings.
suggests that phenotypic drug tolerance is a robust and reproducible feature of M. tuberculosis dormancy rather than an artifact of isolated experimental systems. Notably, deeper dormancy models—those associated with non-culturability or resuscitation dependence—tend to occupy positions further from the null, reflecting stronger effects. This pattern reinforces the biological inference that metabolic shutdown directly contributes to antimicrobial insensitivity.
In contrast, forest plots summarizing hypoxia- and nutrient deprivation–based models show more modest effect sizes with narrower confidence intervals. Statistically, this reflects greater methodological standardization but also indicates that these models capture earlier or shallower dormancy states. The tighter clustering of estimates suggests higher precision but does not necessarily imply greater clinical relevance. Rather, when viewed alongside models exhibiting wider confidence intervals and larger effect sizes, the forest plots collectively support the concept of dormancy as a graded phenomenon. From an interpretive standpoint, the coexistence of precise but modest effects and larger, more variable effects argues against a single “gold standard” dormancy model and highlights the importance of integrating multiple systems in translational research.
Forest plots addressing reactivation risk further underscore the dominant influence of host immunity. Estimates derived from immunocompromised populations consistently demonstrate large effect sizes favoring progression from latency to active disease, with minimal overlap between confidence intervals for immunocompetent and immunosuppressed groups. The narrow confidence intervals surrounding pooled estimates for HIV-associated reactivation risk indicate a high degree of statistical certainty, despite variation in study design and population characteristics. Animal model estimates align closely with these findings, reinforcing cross-contextual validity. The concordance between human and animal data within the forest plots strengthens causal inference by demonstrating reproducibility across biological scales.
Turning to the funnel plots, their interpretation provides insight into the robustness of these findings in the face of potential publication and small-study bias. Overall, the funnel plots display approximate symmetry around the pooled effect estimates, particularly for reactivation risk outcomes. This symmetry suggests that studies with both large and small sample sizes contribute across the range of observed effects, reducing concern that the literature is disproportionately weighted toward extreme or positive findings. The relative density of points near the center of the funnel indicates that many studies cluster around the mean effect, further supporting the stability of pooled estimates.
However, mild asymmetry is evident in funnel plots associated with in vitro dormancy and drug tolerance outcomes. Smaller studies tend to report larger effect sizes, while larger studies cluster closer to the pooled mean. Statistically, this pattern may reflect small-study effects rather than overt publication bias. In experimental microbiology, smaller studies often employ more extreme or tightly controlled stress conditions, which can exaggerate dormancy depth and, consequently, drug tolerance. Therefore, the observed asymmetry is plausibly explained by methodological heterogeneity rather than selective reporting. Importantly, the absence of a pronounced gap on one side of the funnel suggests that negative or null findings are not systematically missing from the literature.
When funnel and forest plots are interpreted together, a coherent narrative emerges. The forest plots establish that the direction of effects—greater drug tolerance in dormant bacilli and higher reactivation risk under immune compromise—is consistent and statistically supported. The funnel plots, in turn, indicate that these conclusions are not unduly driven by biased reporting, even though variability exists. This complementary interpretation strengthens the credibility of the synthesis, as effect magnitude and evidentiary balance are assessed simultaneously.
From a translational perspective, the plots also reveal important limitations. The broader scatter observed in funnel plots for dormancy-related outcomes highlights the lack of standardized experimental endpoints, which inflates heterogeneity and complicates quantitative comparison. This variability does not invalidate the findings but signals the need for harmonized dormancy models and reporting standards. In contrast, the relative symmetry and tighter clustering observed in clinical reactivation risk plots suggest that epidemiological measures are more mature and methodologically consistent, enabling stronger statistical inference.
Overall, the funnel and forest plots reinforce the central conclusion that latent tuberculosis is sustained through biologically meaningful dormancy states that confer drug tolerance, while host immune status governs the probability of reactivation. The graphical analyses demonstrate that these findings are supported by a broad and reasonably balanced body of evidence. At the same time, they highlight where uncertainty remains greatest, particularly in experimental modeling of dormancy. By making both consistency and variability visible, the plots provide a transparent statistical foundation for future efforts to refine models, improve diagnostics, and design therapies capable of targeting dormant M. tuberculosis populations more effectively.