Biosensors and Nanotheranostics

Bionanotechnology, Drug Delivery, Therapeutics | online ISSN 3064-7789
175
Citations
113k
Views
68
Articles
Your new experience awaits. Try the new design now and help us make it even better
Switch to the new experience
Figures and Tables
REVIEWS   (Open Access)

Electrochemical Sensing of Heavy Metals in Water for Field Deployment

Eafaz Uddin Pantho 1*

+ Author Affiliations

Biosensors and Nanotheranostics 5 (1) 1-8 https://doi.org/10.25163/biosensors.5110952

Submitted: 13 August 2026 Revised: 01 October 2026  Published: 10 October 2026 


Abstract

Heavy metals such as lead, cadmium, mercury, arsenic, chromium, copper and zinc do not degrade, and their slow accumulation in water continues to shape human health. Laboratory spectrometry remains the regulatory reference, yet it is slow, costly and fixed in place, so short-lived contamination events can pass unrecorded. Electrochemical sensing has become the most credible alternative, although whether it can leave the bench is still uncertain. This review examines literature published between January 2020 and early 2026, with deliberate emphasis on 2025 and 2026, across three connected fronts: nanomaterial interface engineering, the hardware and machine-learning stack that turns noisy field signals into defensible numbers, and the autonomous platforms that carry sensors into rivers, lagoons and mining catchments. Four databases (Scopus, Web of Science, PubMed and Google Scholar) were searched, records were screened against explicit eligibility criteria, and findings were synthesised narratively, with deployment studies appraised on a monitoring-readiness scale. Porous frameworks and bio-receptors reported the lowest detection limits, yet field-deployed systems leaned mostly on more modest bismuth and carbon composites. Instrumentation has consolidated from breadboard prototypes to single-chip systems. Machine-learning models often reported accuracies above 95%, but most were trained on small datasets and omitted uncertainty estimates. Most platforms appeared to sit at low readiness levels, validated for days in synthetic buffer rather than for months in authentic water. Taken together, dissolved organic matter, biofouling and drift, rather than sensitivity, now seem to limit translation. We outline four priorities: anti-fouling interfaces, built-in sample pretreatment, uncertainty-aware algorithms and harmonised reporting standards.

Keywords: Electrochemical sensing; Heavy metal detection; Nanomaterial electrodes; Stripping voltammetry; Machine learning calibration; Biofouling; Autonomous water monitoring

1. Introduction

Heavy metals have a way of outlasting the events that release them. Lead, cadmium, mercury, arsenic, chromium, copper and zinc do not break down; they travel through groundwater and surface water, climb food chains, and settle in organs and nervous tissue, where the damage may surface only years later as organ failure, developmental harm or cancer (Chauhan et al., 2026; Shi et al., 2025; Sulthana et al., 2024). It is this persistence, perhaps more than any single toxic dose, that has pushed regulators towards strict drinking-water limits, with World Health Organization (WHO) and US Environmental Protection Agency (EPA) values falling at roughly 10–15 µg/L for lead and 3–5 µg/L for cadmium (García-Miranda Ferrari et al., 2020; Sfragano et al., 2026). Such numbers ask a great deal of whatever instrument is meant to verify them.

For most of the past half-century, that instrument has sat in a laboratory. Atomic absorption spectrometry, inductively coupled plasma mass spectrometry (ICP-MS), ICP optical emission spectrometry and X-ray fluorescence remain the methods regulators trust, and for good reason: they are sensitive, and several can resolve many elements in a single run (Goyal & Nigam, 2025; Wagh, 2026). They are also expensive to buy and to operate, awkward to move, and slow, with results sometimes taking days or weeks once sample pretreatment is counted (Boselli, 2024; Zheng et al., 2026). None of this is a criticism so much as a structural limitation, but it has a practical consequence. A short-lived flushing event, a localised spill or a remote well can pass entirely unrecorded when every measurement depends on shipping a sample to a distant facility (Cirrone et al., 2025; Oladosu et al., 2026).

Electrochemical sensing has emerged, gradually and then rather quickly, as the most credible response to that gap (Reda et al., 2026; Savas & Gharibzahedi, 2025). The underlying idea is simple enough. A redox reaction at an electrode surface produces a current, a potential or an impedance change, and the signal is read out directly (Kyabutwa et al., 2025; Marei, 2014). Stripping voltammetry adds one clever step: metal ions are first electrodeposited onto the working electrode, which concentrates them, and are then stripped away and measured, so that detection in the nanomolar or even picomolar range becomes feasible (García-Miranda Ferrari et al., 2020; Reda et al., 2026). Sample volumes of tens of microlitres, modest power demands and a natural fit with miniaturised, chip-based formats (Boselli, 2024; Xu et al., 2024) help explain why the approach keeps drawing attention, now well beyond metals alone (Jasper et al., 2026).

Much of that attention has gone, understandably, to the electrode surface, because it ultimately sets the sensitivity ceiling (Liu et al., 2025; Reda et al., 2026). The field has drifted away from toxic mercury drop electrodes towards screen-printed carbon, laser-induced graphene and microfabricated arrays (Gros et al., 2014; Saqib et al., 2025). On these solid supports, researchers have layered an ever more elaborate toolkit of carbon nanotubes, reduced graphene oxide, metal–organic frameworks (MOFs), covalent organic frameworks (COFs), bismuth and gold nanoparticles, chitosan and molecularly imprinted polymers, each chasing a little more surface area or a little more selectivity (Liu et al., 2025; Lu et al., 2025; Sfragano et al., 2026).

And yet materials progress alone has not solved the deployment problem, which is really the crux of the matter. Real water is not a clean buffer. Biofouling, passivation by humic and fulvic acids, baseline drift and cross-ion interference among Cu²⁺, Pb²⁺, Cd²⁺ and Zn²⁺ begin to erode performance the moment a prototype leaves the bench (Kyabutwa et al., 2025; Shi et al., 2025), and manual peak reading struggles with overlapping stripping peaks in a matrix that keeps changing (Fan et al., 2026; Zheng et al., 2026).

Better algorithms and better electronics offer partial remedies. Convolutional neural networks (CNNs), support vector regression (SVR) and random forests can now deconvolve overlapping voltammetric signals and correct for drift, with reported accuracies above 95–99% even in complex matrices (Lahari et al., 2025; Liu et al., 2025), while wireless potentiostats, microfluidic flow cells, paper-based devices and even autonomous surface vehicles are beginning to carry sensors into rivers and lagoons (De Vito-Francesco et al., 2022; Savas & Gharibzahedi, 2025). Whether these pieces add up to a monitoring system that a regulator would trust is a different and less comfortable question.

This review therefore asks something narrower than how sensitive an electrode can become. It asks what electrochemical heavy-metal sensors would need in order to produce trustworthy numbers in real water, over useful periods. We argue that the answer cannot come from one discipline alone: materials chemistry, low-noise hardware, edge-deployable machine learning and Internet-of-Things (IoT) connectivity have to be treated as one system (Anchidin-Norocel et al., 2025; Lahari et al., 2025; Saqib et al., 2026). Section 2 introduces transduction principles, interface materials, hardware and algorithms; Section 3 describes how the evidence was identified and appraised; Section 4 synthesises the reported performance (Tables 1–4); and Section 5 discusses what separates laboratory promise from field reality.

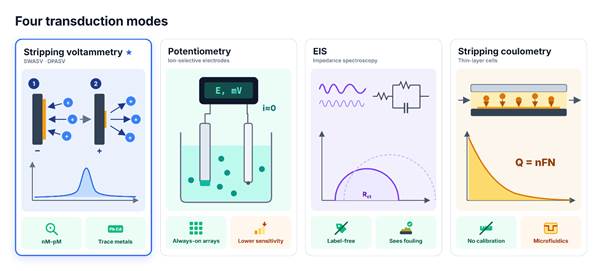
Figure 1. The four principal transduction modes used for heavy-metal detection and what each can tell us. Stripping voltammetry preconcentrates metal ions on the electrode before stripping them off, which gives nanomolar-to-picomolar detection limits and makes it the usual choice for trace analysis. Potentiometry reads an equilibrium potential with almost no current and suits always-on arrays. Impedance spectroscopy reports charge-transfer resistance and double-layer capacitance, so it also tracks fouling. Stripping coulometry electrolyses the whole sample volume and is calibration-free in principle. SWASV, square-wave anodic stripping voltammetry; DPASV, differential-pulse anodic stripping voltammetry; EIS, electrochemical impedance spectroscopy. Sources: García-Miranda Ferrari et al. (2020); Jang et al. (2011); Kyabutwa et al. (2025); Marei (2014).

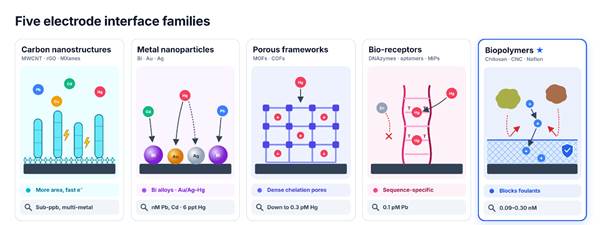
Figure 2. Five families of working-electrode interface material and the mechanism that makes each useful. Carbon nanostructures enlarge the electroactive area, bismuth and noble-metal nanoparticles add metal-specific chemistry, porous frameworks supply dense chelation sites, and bio-receptors bind particular ions through sequence-specific coordination. Biopolymers and permselective membranes are the only family built around fouling resistance. The detection limits are representative values from Table 1 and come from different metals and matrices, so they are indicative only. MWCNT, multi-walled carbon nanotubes; rGO, reduced graphene oxide; MOF and COF, metal–organic and covalent organic frameworks; MIP, molecularly imprinted polymer; CNC, cellulose nanocrystals. Sources: Helim et al. (2024); Liu et al. (2025); Saqib et al. (2025); Sfragano et al. (2026).

2. Electroanalytical Materials, Hardware and Machine Learning for Field-Deployable Heavy-Metal Sensing

The recent literature is easiest to follow if it is read in layers, from the physical principle that generates a signal, through the electrode that shapes it and the electronics that capture it, to the algorithms that interpret it and the platforms that carry it outdoors. The subsections below follow that order, and the quantitative detail behind them is collected in Tables 1–4, which appear after the Conclusion together with Figures 1–4.

2.1 Transduction Principles: What an Electrochemical Sensor Actually Measures

It is tempting to speak of electrochemical sensing as though it were one technique, yet the four dominant transduction modes (voltammetry, potentiometry, impedance spectroscopy and coulometry) answer rather different questions (Figure 1). Square-wave and differential-pulse anodic stripping voltammetry (SWASV and DPASV) remain the workhorses of trace-metal analysis. A preconcentration step cathodically deposits metal ions onto the electrode, an anodic sweep then strips them back off, and this two-step manoeuvre pushes detection limits down into the nanomolar-to-picomolar range (García-Miranda Ferrari et al., 2020; Kyabutwa et al., 2025; Shamish et al., 2026). Cyclic and linear sweep voltammetry, by contrast, serve less for quantification than for diagnosis, checking potential windows, electron-transfer kinetics and redox reversibility (Liu et al., 2025).

Potentiometry works differently. Ion-selective electrodes report an equilibrium potential that follows the Nernst equation while drawing essentially no current, which suits long-duration, always-on arrays even though sensitivity seldom matches that of stripping voltammetry (Hernández Rodríguez et al., 2026; Jang et al., 2011). Electrochemical impedance spectroscopy (EIS) takes a third route, probing charge-transfer resistance and double-layer capacitance across a frequency sweep; because it is non-destructive and label-free, it also opens a window on surface fouling and functionalisation rather than on concentration alone (Kyabutwa et al., 2025; Saqib et al., 2026). Anodic stripping coulometry in thin-layer microfluidic cells sidesteps frequent recalibration by exhaustively electrolysing the sample volume and reading total charge through Faraday’s law. In principle it is calibration-free, although in practice it asks for tightly controlled microfluidics (Marei, 2014).

2.2 Interfacial Engineering and Advanced Nanomaterials

If transduction fixes the measurement principle, the electrode interface largely decides whether a sensor performs in practice, and this is where much of the last decade’s effort has gone (Li et al., 2024; Liu et al., 2025; Reda et al., 2026). Figure 2 groups the dominant modification strategies into five families, and Table 1 gives representative detection limits for each.

Carbon nanostructures. Multi-walled carbon nanotubes, reduced graphene oxide, graphene quantum dots and, increasingly, MXenes do the most basic job well: they enlarge the electroactive area and speed electron transfer. That is presumably why MWCNT/ZnO and MWCNT/MOF heterojunctions have been able to detect Cu²⁺, Pb²⁺ and Cd²⁺ simultaneously at sub-ppb levels (Lu et al., 2025; Zhou, 2024).

Bismuth and noble-metal nanoparticles. These take a more chemistry-specific route. Bismuth forms what the literature rather evocatively calls “fused alloys” with Cd²⁺ and Pb²⁺ during cathodic deposition, sharpening stripping peaks in a way that mimics mercury film electrodes, which remain a benchmark for cadmium and lead (Favilli et al., 2025), but without the toxicity (Saqib et al., 2025; Shan et al., 2026). Gold and silver nanoparticles, often thiol-functionalised, play a comparable role for softer cations such as Hg²⁺ (Shan et al., 2026); silver nanoparticle–dithizone@chitosan screen-printed electrodes (Yulirohyami et al., 2021) and DNA–gold nanostructures (Zhu et al., 2025) are two examples aimed at mercury.

Porous crystalline frameworks. MOFs such as UiO-66 and DUT-67, and increasingly COFs, offer something different. Specific surface areas in the 1000–6000 m²/g range combine with tunable pore chemistry (amine, thiol and carboxylate groups) that behaves like a dense field of chelation sites (Muthukumaran et al., 2025; Sfragano et al., 2026). Framework hybrids with carbon nanotubes or cellulose nanocrystals (Preusser et al., 2025; Wang et al., 2024) and dendrimer/nickel-MOF electrodes (Wang et al., 2025) have been proposed for multi-metal work, while a melamine-COF/carbon-black electrode has reported sub-nanomolar limits for Pb²⁺, Cd²⁺ and Hg²⁺ (Mirzaei Karazan et al., 2024).

Bio-receptors. At the more specific end of the spectrum sit DNAzymes, aptamers and molecularly imprinted

Table 1. Working-electrode modification strategies and their reported detection limits. Each row groups one family of interface materials (see Figure 2) and lists representative architectures, the ions targeted, the electroanalytical technique and a representative limit of detection (LOD) as reported by the cited sources. The LODs come from different metals, techniques and sample matrices, so they are indicative rather than strictly comparable. SWASV, square-wave anodic stripping voltammetry; DPASV, differential-pulse ASV; DPV, differential-pulse voltammetry; EIS, electrochemical impedance spectroscopy; MWCNT, multi-walled carbon nanotubes; MOF and COF, metal–organic and covalent organic frameworks; CB, carbon black; rGO, reduced graphene oxide; PLL, poly-L-lysine; LIPG, laser-induced porous graphene; EµPAD, electrochemical microfluidic paper-based analytical device; ppt and ppb, parts per trillion and billion.

Interface family (example architectures)

Target ions

Technique

Representative LOD

Sources

Metal and metal-oxide nanoparticle hybrids on graphene (AuNPs/GR, BiNPs@NPCGS)

Pb²⁺, Cd²⁺, Hg²⁺, Cu²⁺

SWASV

Hg²⁺ 6 ppt; Pb²⁺ 3.2 nM (0.66 ppb); Cd²⁺ 4.1 nM (0.46 ppb)

Saqib et al. (2025); Shan et al. (2026)

MWCNT-based nanocomposites and heterojunctions (MWCNT/ZnO, CeMOF@MWCNTs)

Cu²⁺, Pb²⁺, Hg²⁺, Cd²⁺, Zn²⁺

SWASV, DPV

Cu²⁺ 0.8 ppb; Pb²⁺ 0.7 ppb; Cd²⁺ 0.64 ppb

Zhou (2024); Shan et al. (2026); Lu et al. (2025)

Porous crystalline frameworks (UiO-66-NH₂, DUT-67, melamine-COF/CB)

Pb²⁺, Cd²⁺, Cu²⁺, Hg²⁺, Zn²⁺

SWASV, DPASV, EIS

Pb²⁺ 0.001 nM; Cd²⁺ 0.002 nM; Hg²⁺ 0.0003 nM

Sfragano et al. (2026); Liu et al. (2025); Muthukumaran et al. (2025)

Functional nucleic acids and bio-receptors (DNAzyme/Fe/ZIF-8, PtNPs@Cu-MOF, aptasensors)

Pb²⁺, Hg²⁺, As³⁺

DPASV, SWASV, chronoamperometry

Pb²⁺ 0.1 pM; Hg²⁺ 0.2 pM; Y-DNA Hg²⁺ 8.5 pM

Liu et al. (2025); Sfragano et al. (2026); Savas & Gharibzahedi (2025)

Sustainable biopolymers and paper substrates (chitosan/rGO/PLL, Bi/Nafion/LIPG, EµPADs)

Cd²⁺, Pb²⁺, Cu²⁺, Hg²⁺

SWASV, DPASV, potentiometry

Cd²⁺ 0.09 nM; Pb²⁺ 0.10 nM; Cu²⁺ 0.30 nM

Helim et al. (2024); Saqib et al. (2025); Xu et al. (2024)

Table 2. Evolution of portable potentiostat hardware, from discrete open-source circuits to silicon systems-on-chip. Rows run from the earliest to the most integrated designs, with commercial handheld workstations shown last for reference. Columns give representative systems, the key features of their signal chain and the reported strengths or field limitations, illustrating how the noise floor and the instrument footprint have fallen together. MCU, microcontroller unit; DAC and ADC, digital-to-analogue and analogue-to-digital converters; AFE, analogue front end; TIA, transimpedance amplifier; SoC, system-on-chip; EIS, electrochemical impedance spectroscopy.

Hardware class

Representative systems

Signal chain and performance

Sources

Discrete open-source prototypes

CheapStat, JUAMI, UWED, SweepStat

MCU-integrated DAC and ADC; reliable only above about 100 nA; cost below US$80

Rowe et al. (2011); Ainla et al. (2018); Zheng et al. (2026)

High-precision external-converter architectures

DStat, PassStat, MYSTAT

External 16-bit DAC and 24-bit delta-sigma ADC; picoampere-level resolution; larger footprint

Caux et al. (2022); Irving et al. (2021); Zheng et al. (2026)

Integrated analogue front-end (AFE) chips

LMP91000-based designs (KickStat, NanoStat)

Monolithic potentiostatic loop; power draw below 10 µA; fixed TIA gain limits use with capacitive electrodes

Lee & Burke (2022); Nhu et al. (2025); Zheng et al. (2026)

System-on-chip (SoC) platforms

AD5940/AD5941, ADuCM355, FreiStat, HELPStat, EmStat Pico

Dual DACs, low-noise TIA, guard rings, hardware anti-aliasing; baseline noise below 5.5 pA; EIS up to 200 kHz

Bautista et al. (2025); Bill et al. (2023); Stratmann et al. (2019); Zheng et al. (2026)

Commercial handheld workstations

EmStat4S, CHI1240C, CHI1200C

Multi-range auto-switching; resolution below 1 pA; USB and Bluetooth telemetry; high capital cost

Zheng et al. (2026); PalmSens (2026)+6

polymers, which exploit sequence-specific coordination chemistry, such as thymine–Hg²⁺–thymine base pairing, to reach picomolar sensitivity with genuine selectivity against interfering ions (Liu et al., 2025; Sfragano et al., 2026). DNAzyme-functionalised MOF nanocomposites for lead (Dong et al., 2024) show how these receptors are increasingly married to nanostructured supports.

Biopolymers and permselective membranes. Chitosan, cellulose nanocrystals and Nafion do less of the sensing and more of the protecting. They exclude organic foulants while letting target cations through, which matters enormously once a sensor leaves clean buffer (Helim et al., 2024; Saqib et al., 2025). Nanocellulose and cellulose nanocrystal composites have also served as transducer supports in their own right (Taheri et al., 2018; Teodoro et al., 2019).

2.3 Hardware Architectures, Microfluidics and Miniaturisation

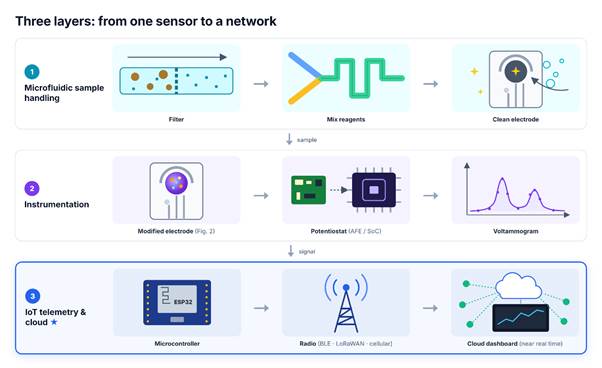
Even the best-engineered electrode is only as good as the electronics that read it. Figure 3 sketches the instrumentation layer as a whole, and Table 2 traces how potentiostat design has evolved. Early open-source instruments such as CheapStat and UWED showed that field electrochemistry costing less than about US$80 was possible at all (Ainla et al., 2018; Rowe et al., 2011), but their reliance on general-purpose operational amplifiers and microcontroller converters left them noisy and dependable only above roughly 100 nA (Zheng et al., 2026). Designs built around external converters, including PassStat and MYSTAT, pushed resolution towards the picoampere range at the price of a larger footprint (Caux et al., 2022; Irving et al., 2021), and USB-controlled open designs have been reported for neighbouring applications such as thin-film battery characterisation (Dobbelaere et al., 2017).

Integrated analogue front-end chips such as the LMP91000 then compressed the whole potentiostatic loop into a single package (Lee & Burke, 2022; Nhu et al., 2025). The current generation of systems-on-chip (AD5940/AD5941, ADuCM355) goes further, combining dual excitation converters, low-noise transimpedance amplifiers and guard rings around the working-electrode node (Bautista et al., 2025; Bill et al., 2023; Stratmann et al., 2019). Guard rings matter more than they sound: layout and guarding choices help suppress the parasitic capacitance and humidity leakage that can swamp picoampere stripping currents outside the laboratory (Grohe, 2022), and amplifier bandwidth and stability remain a design trade-off in their own right (Shahdoost et al., 2021).

Around this electronic core, microfluidic and paper-based devices (EµPADs) have reduced the burden of sample handling itself, automating filtering, reagent mixing and electrode cleaning at the microlitre scale while limiting operator error (Marei, 2014; Xu et al., 2024); origami-style paper devices modified with nitrogen-doped graphene are one recent example (Wei et al., 2025). Increasingly, the whole assembly is wrapped in connectivity. Microcontrollers such as the ESP32, paired with Bluetooth, LoRaWAN or cellular radios, push data to cloud dashboards in something close to real time (Anchidin-Norocel et al., 2025; Oladosu et al., 2026), and cloud-connected embedded potentiostats such as FreiStat already exist (Bill et al., 2023). This is the bridge that turns a single sensor into a monitoring network, part of a wider convergence of nanomaterials, characterisation and real-world application (Machín & Márquez, 2025).

2.4 Machine Learning and Data-Driven Signal Interpretation

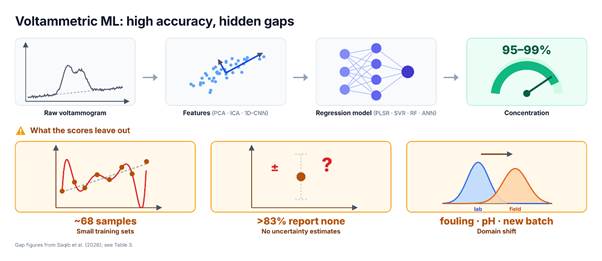
Real voltammograms are messier than textbook examples. Peaks from co-existing Cu²⁺, Pb²⁺, Cd²⁺ and Zn²⁺ overlap, capacitive background currents intrude, and baselines drift with temperature, pH or simple electrode ageing (Liu et al., 2025; Saqib et al., 2026; Shi et al., 2025). Machine learning has become the field’s main answer to that mess (Figure 4). Unsupervised methods such as principal component analysis (PCA) and independent component analysis (ICA) project high-dimensional voltammograms onto orthogonal axes, an elegant way to separate overlapping metal signals without labelled data (Liu et al., 2025; Shi et al., 2025). One-dimensional CNNs go further, learning peak shapes and edge features directly from raw curves; because of their translational invariance they stay fairly robust when the baseline shifts, and accuracies above 95–99% are now routinely reported (Lahari et al., 2025; Liu et al., 2025; Saqib et al., 2026).

To convert features into a concentration, regression frameworks (partial least squares regression, SVR, random forests and artificial neural networks) dominate, with ensemble and neural approaches generally outperforming linear models once interference becomes

Table 3. Machine-learning architectures applied to voltammetric data, grouped by primary analytical task. Reported accuracy, coefficient of determination (R²), mean absolute error (MAE) and recovery values are taken directly from the cited sources and were obtained on different datasets, so they should not be ranked against one another. Most studies train on small datasets (median about 68 samples) and few report uncertainty estimates, which limits how far these figures can be trusted under field conditions (see Figure 4). PCA, principal component analysis; ICA, independent component analysis; CNN, convolutional neural network; SVM and SVR, support vector machine and regression; RF, random forest; ANN, MLP and BP-ANN, artificial, multilayer perceptron and back-propagation neural networks.

ML architecture

Primary task

Reported performance

Sources

Unsupervised methods (PCA, ICA)

Feature extraction and deconvolution of overlapping peaks

Visual separation of multi-metal clusters; no direct quantification

Liu et al. (2025); Shi et al. (2025); Reda et al. (2026)

1D convolutional neural networks

Automated feature learning from raw voltammograms

Classification accuracy above 99%; R² of 0.99 or higher; MAE below 0.61 µg/L

Liu et al. (2025); Saqib et al. (2026); Lahari et al. (2025)

Support vector machines and regression

Non-linear concentration mapping

Accuracy above 98.8%; R² 0.98–0.997

Liu et al. (2025); Saqib et al. (2026); Shi et al. (2025)

Tree-based ensembles (RF, XGBoost, CatBoost)

Regression with variable-importance ranking

R² 0.92–0.998; error below 5%; classification accuracy above 95%

Liu et al. (2025); Saqib et al. (2026); Wagh (2026)

Feedforward networks (ANN, MLP, BP-ANN)

Multi-analyte quantification and drift compensation

R² 0.89–0.995; drift recovery 98–101%

Liu et al. (2025); Saqib et al. (2026); Wagh (2026)

Table 4. Field-deployable platforms, representative field performance and the matrix factors that limit them. Rows cover five platform classes, from autonomous boats to dedicated sample-pretreatment modules, and pair each with its reported field outcome and the environmental bottlenecks most often cited. Dissolved organic matter binds metals into electro-inactive complexes in every class, which is why pretreatment appears as its own row. LOD, limit of detection; ICP-MS, inductively coupled plasma mass spectrometry; SPE, screen-printed electrode; DOM, dissolved organic matter; GSM, global system for mobile communications; LoRaWAN, long-range wide-area network; EµPAD, electrochemical microfluidic paper-based analytical device.

Platform class

Representative systems

Field performance

Matrix bottlenecks

Sources

Autonomous surface vehicles and robotic boats

INTCATCH boat, heavy-metal sensing boat

Real-time Pb²⁺ and Cu²⁺ plume mapping; LOD 4 µg/L (Pb²⁺) and 7 µg/L (Cu²⁺)

Pump clogging, bubble entrapment, Cd²⁺/Cu²⁺ interference

De Vito-Francesco et al. (2022); Yang et al. (2021)

IoT-integrated field surveillance networks

Bismuth SPEs with GSM/LoRaWAN, solar power

90–97% correlation with laboratory ICP-MS across mining and estuarine sites

Biofouling, salinity and turbidity shifts, rural connectivity gaps

Oladosu et al. (2026); Anchidin-Norocel et al. (2025)

Microfluidic and paper-based analysers

Lab-on-chip, thin-layer cells, EµPADs

Calibration-free coulometry; microlitre-scale multi-sensor arrays

Flow-rate variation, channel clogging, finite shelf-life

Jang et al. (2011); Marei (2014); Savas & Gharibzahedi (2025)

Self-powered and micro-robotic platforms

Triboelectric nanosensors, graphene-oxide microbots

Battery-free sensing; about tenfold faster Pb²⁺ extraction (60 min)

Fabrication complexity, secondary nanomaterial toxicity

Anchidin-Norocel et al. (2025); Goyal & Nigam (2025); Huang et al. (2025)

Real-world matrix pretreatment systems

Local acidification modules, anti-fouling coatings

Converts bound metal–DOM complexes to detectable free cations

Humic and fulvic acid suppression; no standardised R3 protocol

Zheng et al. (2026); Hernández Rodríguez et al. (2026)

nonlinear, as it does in real multi-metal solutions (Fan et al., 2026; Liu et al., 2025; Wagh, 2026; Table 3). Strong benchmark numbers, however, have not translated cleanly into field trust, a point we return to in the Discussion. A network evidence map covering more than a hundred studies found that over 83% reported no uncertainty quantification at all, and that models trained on a median of roughly 68 samples tend to overfit badly once exposed to authentic environmental matrices (Saqib et al., 2026).

2.5 Field Deployment, IoT Networks and Autonomous Platforms

The last piece of the puzzle is getting any of this out of the laboratory and into a river, a lagoon or a borehole (Table 4). Autonomous surface vehicles fitted with microfluidic SWASV flow cells now run pre-programmed transects across lakes and catchments, mapping Pb²⁺ and Cu²⁺ plumes with limits of detection of about 4–7 µg/L (De Vito-Francesco et al., 2022; Yang et al., 2021). Solar-powered, bismuth-modified screen-printed sensors linked through GSM or LoRaWAN have been deployed at real contamination hotspots, including the Niger Delta and artisanal mining sites in Zamfara, reporting 90–97% agreement with laboratory ICP-MS benchmarks (Anchidin-Norocel et al., 2025; Oladosu et al., 2026); wider African experience is reviewed by Okpara et al. (2022).

Paper-based EµPADs and thin-layer coulometric cells push sample volumes down to tens of microlitres, and more experimental platforms, such as self-powered triboelectric nanosensors (Huang et al., 2025) and magnetically guided graphene-oxide microbots, combine sensing with simultaneous metal capture (Anchidin-Norocel et al., 2025; Goyal & Nigam, 2025). Taken together, these systems show that continuous, spatially resolved monitoring is technically achievable. Whether it is reliably achievable over months rather than days is a separate question, and still largely open (Hernández Rodríguez et al., 2026; Zheng et al., 2026).

3. Methods

Because this article synthesises a fast-moving literature rather than reporting a wet-lab study, reproducibility means something slightly different here. It means that another reviewer, given the same search terms, date window and eligibility rules, should arrive at essentially the same evidence base, and should be able to see how every entry in Tables 1–4 was extracted. The steps below are written with that in mind.

3.1 Review Design and Reporting Framework

We carried out a narrative-critical review, following PRISMA reporting conventions where they could sensibly be applied to a design that is not strictly systematic. No meta-analysis was attempted. The review question was framed around three linked layers of field-deployable electrochemical heavy-metal sensing: electrode interface materials, the hardware and machine-learning pipeline that processes the signal, and the autonomous or networked platforms that carry sensors outdoors.

3.2 Information Sources and Search Strategy

We searched Scopus, Web of Science, PubMed and Google Scholar for records published between January 2020 and early 2026. Recent work was deliberately emphasised (2025–2026), so that the review would capture the field’s current state rather than its history. Search strings combined controlled vocabulary with free-text terms across three concept blocks, using OR within each block and AND between blocks:

Analyte terms: “heavy metal ion*” OR “lead” OR “cadmium” OR “mercury” OR “arsenic” OR “chromium”

Method terms: “electrochemical sensor*” OR “voltammetry” OR “stripping voltammetry” OR “potentiometric” OR “impedance spectroscopy”

Translation terms: “field deployment” OR “portable potentiostat” OR “machine learning” OR “Internet of Things” OR “biosensor”

Reference lists of the review articles that were retrieved were then searched by hand for additional primary sources (backward snowballing). The strings are reproduced exactly as entered so that the search can be repeated.

3.3 Eligibility Criteria

A record was retained if it met all of the following:

it reported an electrochemical transduction platform aimed at one or more of seven priority metals (lead, cadmium, mercury, arsenic, chromium, copper and zinc);

it provided quantifiable analytical performance data, meaning a limit of detection, a dynamic range or a field-validation outcome; and

it was published in English, in a peer-reviewed journal or as an indexed doctoral dissertation.

Figure 3. Layered architecture of a field-deployable electrochemical monitoring system. Microfluidic modules prepare the sample, the modified electrode and potentiostat generate the voltammogram, and a microcontroller with a radio link sends the data to a cloud dashboard in close to real time. The potentiostat itself has moved from discrete boards through analogue front-end chips to systems-on-chip with guard rings (Table 2). The telemetry layer, highlighted, is what turns one sensor into a monitoring network. AFE, analogue front end; SoC, system-on-chip; LoRaWAN, long-range wide-area network. Sources: Anchidin-Norocel et al. (2025); Bill et al. (2023); Marei (2014); Oladosu et al. (2026); Xu et al. (2024).

Figure 4. From raw voltammogram to concentration estimate, and what the accuracy figures leave out. Machine-learning pipelines extract features, either by principal or independent component analysis or by learning them with one-dimensional convolutional networks, and then regress or classify concentrations; accuracies above 95–99% are commonly reported. The warning panels summarise the gap: training sets with a median of roughly 68 samples, more than 83% of surveyed studies without uncertainty quantification, and domain shift in real water. PCA, principal component analysis; ICA, independent component analysis; CNN, convolutional neural network; PLSR, partial least squares regression; SVR, support vector regression; ANN, artificial neural network. Sources: Lahari et al. (2025); Liu et al. (2025); Saqib et al. (2026); Wagh (2026).

We excluded conference abstracts without extractable performance data, non-electrochemical sensing modalities (purely optical or colorimetric), and studies confined to biological rather than environmental matrices. A small number of foundational instrumentation sources were kept as exceptions because they supply hardware context, and a few sources set in food or plant matrices were kept where they illustrated electrode chemistry. Non-electrochemical work cited in the Introduction served only to describe the monitoring gap; no performance data were extracted from it.

3.4 Study Selection

Selection proceeded in two stages. Titles and abstracts were first screened for topical relevance, and the remaining records were then read in full and checked against the criteria above. Candidates found through reference-list searching were assessed against the same criteria.

3.5 Data Extraction

For each retained study we extracted the following fields, which form the basis of Tables 1–4:

- electrode or modifier composition;

- target analyte or analytes;

- electroanalytical technique;

- reported limit of detection and dynamic range;

- hardware platform, where applicable;

- machine-learning architecture and reported accuracy metrics, where applicable; and

- field-deployment status.

Performance values in Tables 1 and 3 are taken directly from the cited sources and are reported as the authors of those sources stated them.

3.6 Quality and Readiness Appraisal

Conventional performance metrics say little about whether a sensor survives outside the laboratory, so we added a monitoring-readiness lens adapted from the R0–R3 framework that Hernández Rodríguez et al. (2026) developed for electrochemical lithium sensing in complex matrices. Deployment studies were classified by how realistic their validation had been. Validation in synthetic buffer over days sat at the lower levels (R0–R1), while validation in authentic, unconditioned field matrices over extended periods, measured in months, sat at the highest level (R3); R2 was treated as the intermediate step. The lens describes the realism of validation. It is not a formal risk-of-bias instrument, and the classification of individual platforms in Section 5.3 rests on qualitative reading of the source papers.

3.7 Evidence Synthesis

Metrics, matrices, target metals and conventions for reporting detection limits differ widely between studies, so we opted for a thematic narrative synthesis rather than a formal meta-analysis. Studies were grouped into recurring material, hardware, algorithmic and deployment categories (Figures 1–4), and cross-study performance ranges are reported descriptively rather than pooled. Where a specific quantitative claim comes from another team’s own meta-analytic effort, for example the proportion of machine-learning studies that lack uncertainty quantification, that source is cited directly rather than re-derived (Saqib et al., 2026).

3.8 Reproducibility Statement

The databases, date window, full search strings, eligibility rules, extraction fields and appraisal scale are all stated above, and the extracted values appear in Tables 1–4 with their sources. Two caveats apply. Google Scholar rankings are opaque and change over time, so an exact repeat of that part of the search may retrieve a slightly different set. And because the readiness classification is interpretive, a second reviewer might place borderline platforms one level higher or lower.

4. Synthesis of Findings: What the Reported Numbers Show Across Materials, Hardware, Algorithms and Platforms

4.1 Electrode Materials: Sensitivity Gains and Persistent Trade-offs

Bio-receptors and porous frameworks reported the lowest detection limits of the five electrode families (Table 1). Nucleic-acid architectures reached 0.1 pM for Pb²⁺ and 0.2 pM for Hg²⁺, with 8.5 pM for a Y-DNA mercury design, while MOF and COF platforms reported 0.001 nM for Pb²⁺, 0.002 nM for Cd²⁺ and 0.0003 nM for Hg²⁺ (Liu et al., 2025; Muthukumaran et al., 2025; Savas & Gharibzahedi, 2025; Sfragano et al., 2026). Metal and metal-oxide nanoparticle hybrids sat several orders of magnitude behind these for lead and cadmium (3.2 nM and 4.1 nM), although mercury, at 6 ppt, was a striking exception (Saqib et al., 2025; Shan et al., 2026). Carbon-nanomaterial composites occupied a comparable tier. MWCNT/ZnO heterojunctions, for instance, detected Cu²⁺, Pb²⁺ and Cd²⁺ together at 0.8, 0.7 and 0.64 ppb (Lu et al., 2025; Shan et al., 2026; Zhou, 2024), a useful property given how rarely real water contains a single contaminant.

Biopolymer and paper-substrate platforms were the quiet surprise. Their representative limits (0.09 nM for Cd²⁺, 0.10 nM for Pb²⁺ and 0.30 nM for Cu²⁺) were lower than those of the nanoparticle and carbon rows, even though this family was the only one explicitly engineered around anti-fouling performance rather than raw sensitivity (Helim et al., 2024; Saqib et al., 2025; Xu et al., 2024). The familiar picture of a clean trade-off between sensitivity and robustness is therefore less tidy than it is often presented. A word of caution is needed, since the representative limits come from different metals, techniques and matrices and are not strictly like-for-like. Even so, the pattern hints that a robust interface need not be an insensitive one.

4.2 Hardware Evolution: From Breadboard to Silicon

Table 2 distinguishes four generations of portable potentiostat design and, separately, commercial handheld workstations, and the story is one of steady consolidation. Discrete open-source boards (CheapStat, JUAMI, UWED and SweepStat) made portable electrochemistry cheap, at under about US$80, but were reliably usable only above roughly 100 nA (Ainla et al., 2018; Rowe et al., 2011; Zheng et al., 2026). External high-precision converter designs such as DStat, PassStat and MYSTAT pushed resolution to the picoampere range at the cost of a larger footprint (Caux et al., 2022; Irving et al., 2021; Zheng et al., 2026). Integrated analogue front-end chips, exemplified by LMP91000-based designs, shrank the control loop and drew less than 10 µA, yet their fixed transimpedance gain can struggle with highly capacitive, nanomaterial-modified electrodes (Lee & Burke, 2022; Nhu et al., 2025; Zheng et al., 2026).

The present generation of systems-on-chip (AD5940/AD5941, ADuCM355, FreiStat, HELPStat and EmStat Pico) appears to resolve most of these compromises at once, reporting baseline noise below 5.5 pA together with impedance spectroscopy up to 200 kHz, essentially by moving the entire signal chain onto a single die (Bautista et al., 2025; Bill et al., 2023; Stratmann et al., 2019; Zheng et al., 2026). Part of that gain presumably comes from removing the board-level parasitic capacitance that plagued earlier designs (Grohe, 2022). Commercial handheld workstations such as the EmStat4S add sub-picoampere resolution and automatic range switching, but at a high capital cost (PalmSens, 2026; Zheng et al., 2026).

4.3 Machine-Learning Performance and Its Limits

Table 3 summarises the recurring algorithmic families, and the headline numbers are genuinely impressive. One-dimensional CNNs reported classification accuracies above 99%, R² at or near 0.99 and a mean absolute error below 0.61 µg/L (Lahari et al., 2025; Liu et al., 2025; Saqib et al., 2026). Support vector machines and regression models reported accuracies above 98.8% with R² between 0.98 and 0.997 (Liu et al., 2025; Saqib et al., 2026; Shi et al., 2025). Tree-based ensembles (random forest, XGBoost, CatBoost) kept quantitative error under 5%, with R² between 0.92 and 0.998, and usefully ranked which features drove each prediction (Liu et al., 2025; Saqib et al., 2026; Wagh, 2026). Feedforward networks reported R² from 0.89 to 0.995 and drift recovery of 98–101% (Liu et al., 2025; Saqib et al., 2026; Wagh, 2026), whereas unsupervised methods separated multi-metal clusters visually but offered no direct quantification (Liu et al., 2025; Reda et al., 2026; Shi et al., 2025).

The same evidence base carries a caveat that matters more than any single accuracy figure. Training sets cluster around a median of about 68 samples, and the great majority of published pipelines report no confidence interval or variance bound alongside their point predictions (Figure 4; Saqib et al., 2026). Section 5.2 argues that this gap becomes decisive once regulatory-grade evidence, rather than a benchmark score, is the goal.

4.4 Field Platforms and Matrix-Driven Bottlenecks

Table 4 brings together five deployment-platform classes: autonomous surface vehicles, IoT surveillance networks, microfluidic and paper-based analysers, self-powered micro-robotic systems, and dedicated pretreatment modules. Autonomous boats reported field detection limits of 4 µg/L for Pb²⁺ and 7 µg/L for Cu²⁺ while mapping pollution plumes in real time, at the cost of vulnerability to pump clogging, bubble entrapment and Cd²⁺/Cu²⁺ interference (De Vito-Francesco et al., 2022; Yang et al., 2021). IoT surveillance nodes achieved 90–97% correlation with laboratory ICP-MS across demanding sites, among them oil-impacted estuaries and artisanal mining regions, but stayed exposed to biofouling, salinity and turbidity shifts and rural connectivity gaps (Anchidin-Norocel et al., 2025; Oladosu et al., 2026). Microfluidic and paper-based analysers offered calibration-free coulometry and microlitre-scale multi-sensor arrays, though flow-rate variation, channel clogging and finite shelf-life limit them (Jang et al., 2011; Marei, 2014; Savas & Gharibzahedi, 2025). Self-powered and micro-robotic platforms promised battery-free sensing and roughly tenfold faster Pb²⁺ extraction (60 min), with fabrication complexity and secondary nanomaterial toxicity still unresolved (Anchidin-Norocel et al., 2025; Goyal & Nigam, 2025; Huang et al., 2025).

Across every platform class in Table 4, one bottleneck recurs whatever the hardware: natural dissolved organic matter (DOM) binds free metal cations into electro-inactive complexes. That is not a hardware problem, and a better chip cannot engineer it away, although local acidification modules are intended to release bound metal for detection (Hernández Rodríguez et al., 2026; Zheng et al., 2026).

4.5 Cross-Cutting Patterns

Three patterns run through Tables 1–4. First, detection limits are no longer the binding constraint: several families already report sub-nanomolar values (Table 1). Second, the most sensitive chemistries are not the ones that have been deployed, since field systems rely mainly on bismuth-based and carbon-composite electrodes (Tables 1 and 4). Third, the evidence for algorithms and platforms is shallow in two dimensions at once, in sample numbers and in time (Tables 3 and 4; Saqib et al., 2026).

5. From Bench to Borehole, Reconciling Laboratory Promise with Field Reality

The evidence assembled above describes a field that has become very good at sensing and is only beginning to learn how to monitor. The subsections below take the main tensions in turn, before setting out what we think the field should do next and where this review itself is limited.

5.1 Why Sensitivity Alone Has Stopped Being the Right Question

Reading Table 1 beside Table 4 is a little humbling. The most sensitive chemistries in this review, the picomolar bio-receptor and framework platforms, barely appear among the field-deployed systems, which rely instead on comparatively modest bismuth-based and carbon-composite electrodes (Saqib et al., 2025; Tables 1 and 4). On reflection this is not much of a contradiction. Picomolar sensitivity means little if the electrode fouls within a week, and it is the robustness-oriented families, biopolymers and permselective membranes among them, that have become the practical choice for anything meant to survive weeks rather than hours in real water (Helim et al., 2024; Saqib et al., 2025).

Interfacial chemistry has, in other words, largely solved the sensitivity problem. What it has not solved is durability under biofouling and organic-matter complexation (Figure 2; Kyabutwa et al., 2025; Shi et al., 2025), and closing that gap probably matters more for field translation than any further lowering of the detection limit. The biopolymer results in Table 1 add a note of cautious optimism, because they suggest that protection and sensitivity are not mutually exclusive. We would not push that reading far, given that the representative limits come from different metals and matrices.

5.2 The Machine-Learning Trust Gap

Table 3 raises a related but distinct concern. Accuracy figures above 95–99% look, on paper, like a solved problem, and in a narrow sense they are (Lahari et al., 2025; Liu et al., 2025). But a model’s accuracy on a held-out slice of its own training distribution says very little about how it will behave once biofouling, pH drift or a slightly different electrode batch shifts the input, which is precisely the domain-shift scenario that dominates real deployments (Figure 4; Saqib et al., 2026).

The finding that more than 83% of surveyed studies offer no uncertainty quantification is, we think, the single most consequential statistic in this literature, because a regulator or a water utility cannot act on a number without knowing how far to trust it (Saqib et al., 2026). It is also a figure drawn from one evidence map, and it would benefit from independent confirmation. Small training sets, with a median of roughly 68 samples, compound the difficulty. A black-box model that is wrong with total confidence is arguably worse than a transparent method that is simply less sensitive, which is one reason the feature-importance rankings offered by tree-based ensembles deserve more attention than they usually get (Wagh, 2026; Table 3).

5.3 Toward Monitoring Readiness (R3) Rather Than Proof of Concept

Hernández Rodríguez et al. (2026) frame the problem well with their R0–R3 scale, which was developed for lithium sensing but transfers readily to heavy metals. Applied to Table 4, and on our qualitative reading, it suggests that most of the platforms reviewed here still sit at R0–R1, validated in synthetic buffer over days rather than months. The handful that have pushed towards R3, such as continuous IoT deployments across the Niger Delta and the Zamfara mining sites, needed exactly the kind of unglamorous, incremental engineering that rarely makes a headline: automated sample pretreatment, matrix-matched calibration and months of drift tracking, rather than a single validation run (Anchidin-Norocel et al., 2025; Oladosu et al., 2026; Table 4).

There is also a standards problem. No standardised R3 protocol exists for real-world matrices, which makes readiness claims hard to compare between laboratories (Hernández Rodríguez et al., 2026; Zheng et al., 2026). If there is one lesson from this synthesis, it may be that R3 readiness is less a materials problem than a patience problem.

5.4 A Strategic Roadmap

Taken together, the evidence in Tables 1–4 and Figures 1–4 points towards four priorities that, in our reading, deserve more attention than they currently receive.

Anti-fouling interfaces as a primary target. Zwitterionic coatings, hydrogels and cellulose nanocrystal layers should be treated as a first-order research question rather than an afterthought bolted onto a high-sensitivity electrode (Figure 2; Helim et al., 2024; Sfragano et al., 2026).

Pretreatment built in from the start. Automated acidification, ultrasound-assisted cleaning and magnetic-bead extraction belong inside microfluidic architectures from the outset, because without them dissolved organic matter will keep causing sensors to under-report true metal burdens, however good the electrode is (Figure 3; Marei, 2014; Xu et al., 2024; Zheng et al., 2026).

Machine learning that has grown up methodologically. Physics-informed constraints, explicit confidence intervals and explainability tools are prerequisites, not optional extras, for anything meant to inform a regulatory decision (Figure 4; Saqib et al., 2026; Wagh, 2026).

Harmonised reporting. The field would benefit enormously from a shared definition of “field validated”, a common interference panel and agreed long-term stability metrics, so that studies like those synthesised here can be compared rather than merely placed side by side (Helim et al., 2024; Hernández Rodríguez et al., 2026; Shan et al., 2026).

None of this diminishes what has already been achieved. Sub-ppb multi-metal detection is now documented at laboratory scale (Table 1), while field systems have reported detection limits in the µg/L range alongside 90–97% agreement with ICP-MS (Table 4). That is a considerable distance travelled, even if field results still sit some way behind the best laboratory limits. The remaining gap is real, but it increasingly looks like an engineering and standardisation problem rather than a fundamental scientific one.

5.5 Limitations of This study

Several limitations should temper the conclusions. The review is narrative-critical rather than systematic, no meta-analysis was attempted, and the readiness classification is interpretive. Detection limits come from different metals, techniques and matrices, so comparisons across electrode families are indicative rather than strict. Much of the evidence is very recent and has had little time for independent replication, and some of the most quoted quantitative claims, including the proportion of studies lacking uncertainty quantification, rest on a single evidence map (Saqib et al., 2026).

The search itself has boundaries too. Only English-language peer-reviewed articles and indexed dissertations were eligible, and Google Scholar results cannot be reproduced exactly. The analyte block of the search string named lead, cadmium, mercury, arsenic and chromium explicitly and relied on the generic term “heavy metal ion*” for copper and zinc, so studies devoted solely to those two metals may be under-represented. Finally, the strongest field evidence comes from a small number of regions and sites, which limits how far the results can be generalised to other water types and climates (Okpara et al., 2022; Oladosu et al., 2026).

6. Conclusion

Over the past several years, electrochemical sensing has narrowed much of the distance between laboratory sensitivity and an instrument a field team can carry. Interface chemistry now delivers trace-level detection limits in several material families, and portable potentiostats have shrunk from breadboard prototypes to single-chip systems. What remains unresolved concerns less any single component than how the components behave together, over months, in water that was never meant to be clean. Dissolved organic matter, biofouling and drift still separate promising prototypes from monitoring systems a regulator could trust, and machine-learning models are seldom trained on enough data or reported with uncertainty. Closing the gap will probably depend less on chasing lower detection limits and more on unglamorous work: anti-fouling chemistry, built-in pretreatment, uncertainty-aware algorithms and harmonised, long-duration validation. If those priorities are taken seriously, continuous, regulator-grade monitoring of metals in real water looks achievable, though it has not yet been demonstrated.

References


Ainla, A., Mousavi, M. P., Tsaloglou, M. N., Redston, J., Pfeil, J., Gallagher, S., & Whitesides, G. M. (2018). Open-source universal wireless electrochemical detector (UWED). Analytical Chemistry, 90(10), 6240–6246.

Anchidin-Norocel, L., Bosancu, A., Iatcu, O. C., Lobiuc, A., & Covasa, M. (2025). Real-time detection of heavy metals and some other pollutants in wastewater using chemical sensors: A strategy to limit the spread of antibiotic-resistant bacteria. Chemosensors, 13(9), Article 352.

Bautista, K. A., Madsen, E., Riegle, S. D., & Placid, K. (2025). HELPStat: A handheld, EIS-enabled, low-cost, and portable potentiostat. ACS Electrochemistry, 1(3), 386–394.

Bill, D., Jasper, M., Weltin, A., Urban, G. A., Rupitsch, S. J., & Kieninger, J. (2023). Electrochemical methods in the cloud: FreiStat, an IoT-enabled embedded potentiostat. Analytical Chemistry, 95(35), 13003–13009.

Boselli, F. (2024). Development of portable systems for the electrochemical detection of heavy metals in environmental and biological matrices [Doctoral dissertation, University of Illinois at Chicago].

Caux, M., Achit, A., Var, K., Boitel-Aullen, G., Rose, D., Aubouy, A., & Gougis, M. (2022). PassStat, a simple but fast, precise and versatile open source potentiostat. HardwareX, 11, Article e00290.

Chauhan, J., Yadav, S., Chaudhary, S., Kumar, R., Srivastava, S., & Kurmi, R. K. (2026). Microbial and hybrid approaches for sustainable removal of toxic heavy metal ions from wastewater. Desalination and Water Treatment, 328, Article 101886.

Cirrone, R. G., Boldrini, A., Polvani, A., Arrigucci, M., Liu, X., Galgani, L., Woods, S., & Loiselle, S. (2025). Deployable colorimetric membrane sensors for heavy metal monitoring in low-resource environments. ACS ES&T Water, 5(11), 6258–6267.

De Vito-Francesco, E., Farinelli, A., Yang, Q., Nagar, B., Álvarez, R., Merkoçi, A., Knutz, T., Haider, A., Stach, W., Ziegenbalg, F., & Allabashi, R. (2022). An innovative autonomous robotic system for on-site detection of heavy metal pollution plumes in surface water. Environmental Monitoring and Assessment, 194(2), Article 122.

Dobbelaere, T., Vereecken, P. M., & Detavernier, C. (2017). A USB-controlled potentiostat/galvanostat for thin-film battery characterization. HardwareX, 2, 34–49.

Dong, J., Zhang, D., Li, C., Bai, T., Jin, H., & Suo, Z. (2022). A sensitive electrochemical sensor based on PtNPs@ Cu-MOF signal probe and DNA walker signal amplification for Pb2+ detection. Bioelectrochemistry, 146, 108134.

Fan, C., Li, W., Ning, J., Yang, D., Zhu, Z., Cheng, W., Liang, Y., & Hu, H. (2026). Materials-driven sensor technologies for heavy metal ion detection: Transduction mechanisms and machine learning integration. Materials Chemistry Frontiers, 10, 1002–1028.

Favilli, L., Isaja, V., Inaudi, P., Giacomino, A., Cecire, R., Bertaina, L., Malandrino, M., & Abollino, O. (2025). Voltammetric determination of cadmium and lead in plant materials using an in situ mercury film electrode. Talanta, 292, Article 127912.

García-Miranda Ferrari, A., Carrington, P., Rowley-Neale, S. J., & Banks, C. E. (2020). Recent advances in portable heavy metal electrochemical sensing platforms. Environmental Science: Water Research & Technology, 6(10), 2676–2690.

Goyal, A. K., & Nigam, A. (2025). Sensors for toxic metal ion detection in aquatic environment: Current status and future perspectives. Discover Applied Sciences, 7(12), Article 1405.

Grohe, B. (2022). Low-current circuit layout and guarding techniques for high-impedance electrochemical measurements. Journal of Electroanalytical Chemistry, 910, Article 116180.

Gros, P., Pujol, L., Evrard, D., Groenen-Serrano, K., Freyssinier, M., & Ruffien-Cizsak, A. (2014). Electrochemical sensors and devices for heavy metals assay in water: The French groups’ contribution. Frontiers in Chemistry, 2, Article 19.

Helim, R., Zazoua, A., & Korri-Youssoufi, H. (2024). Sustainable biopolymer-based electrochemical sensors for trace heavy metal determination in water: A comprehensive review. Chemosensors, 12(12), Article 267.

Hernández Rodríguez, C., Villa Soto, A. P., Ríos Contreras, F. A., Díaz Real, J. A., Pérez Bueno, J. J., & Sosa Domínguez, A. (2026). Monitoring readiness framework for electrochemical lithium sensing platforms in complex real-world matrices. Measurement, 291, Article 123087.

Huang, Y. T., Khan, A., Ganguly, A., Kaswan, K., Suresh, S., Cheng, Y. Y., ... & Lin, Z. H. (2025). Real-time wireless detection of heavy metal ions using a self-powered triboelectric nanosensor integrated with an autonomous thermoelectric generator-powered robotic system. Advanced Science, 12(24), 2410424.

Irving, P., Cecil, R., & Yates, M. Z. (2021). MYSTAT: A compact potentiostat/galvanostat for general electrochemistry measurements. HardwareX, 9, Article e00163.

Jang, A., Zou, Z., Lee, K. K., Ahn, C. H., & Bishop, P. L. (2011). State-of-the-art lab chip sensors for environmental water quality monitoring. Measurement Science and Technology, 22(3), Article 032001.

Jasper, I., Rodrigues, R. R., Florencio, J. C., Sauer, H., Hryniewicz, B. M., & Vidotti, M. (2026). Recent advances and emerging strategies of electrochemical sensors for pesticides and toxic metals detection. Discover Sensors, 2(1), Article 23.

Kyabutwa, P. L., Alyamni, N., Abot, J. L., & Zestos, A. G. (2025). Recent trends in electrochemical methods for real-time detection of heavy metals in water and soil: A review. Current Opinion in Electrochemistry, 54, Article 101749.

Lahari, S. A., Kumawat, N., Amreen, K., Ponnalagu, R. N., & Goel, S. (2025). IoT integrated and deep learning assisted electrochemical sensor for multiplexed heavy metal sensing in water samples. npj Clean Water, 8(1), Article 10.

Lee, S. C., & Burke, P. J. (2022). NanoStat: An open source, fully wireless potentiostat. Electrochimica Acta, 422, Article 140481.

Li, B., Xie, X., Meng, T., Guo, X., Li, Q., Yang, Y., & Pang, H. (2024). Recent advance of nanomaterials modified electrochemical sensors in the detection of heavy metal ions in food and water. Food Chemistry, 440, Article 138213.

Liu, J., Yin, Y., & Liu, G. (2025). Recent progress of electrochemical sensors for accurate detection of heavy metal ions in water: A comprehensive review. International Journal of Electrochemical Science, 20(10), Article 101209.

Lu, Y., Chen, X., Lan, H., Nag, A., Chen, Y., Gao, J., & Deng, S. (2025). A review of multi-walled carbon nanotubes-based electrochemical sensors to detect heavy metals for food packaging applications. Journal of Alloys and Compounds, 1017, Article 179106.

Machín, A., & Márquez, F. (2025). Next-generation chemical sensors: The convergence of nanomaterials, advanced characterization, and real-world applications. Chemosensors, 13(9), Article 345.

Marei, M. M. (2014). Electrochemical and microfabrication strategies for remotely operated heavy metal sensor networks for water analysis: The dual challenges of calibration-less measurement and sample pretreatment [Doctoral dissertation, University of Louisville].

Mirzaei Karazan, Z., Roushani, M., & Jafar Hoseini, S. (2024). Simultaneous electrochemical sensing of heavy metal ions (Zn²?, Cd²?, Pb²?, and Hg²?) in food samples using a covalent organic framework/carbon black modified glassy carbon electrode. Food Chemistry, 442, Article 138500.

Muthukumaran, M. K., Govindaraj, M., Kogularasu, S., Sriram, B., Raja, B. K., Wang, S. F., Chang-Chien, G. P., & Selvi J, A. (2025). Recent advancements in metal–organic framework-based materials for electrochemical sensors. Talanta Open, 11, Article 100396.

Nhu, C. T., Dang, P. N., Thanh, T. B., & Duc, T. C. (2023). Development of a miniaturised potentiostat for urea detection using the LMP91000. Vietnam Journal of Science, Technology and Engineering, 65(1), 19-24.

Okpara, E. C., Fayemi, O. E., Wojuola, O. B., Onwudiwe, D. C., & Ebenso, E. E. (2022). Electrochemical detection of selected heavy metals in water: A case study of African experiences. RSC Advances, 12(41), 26319–26361.

Oladosu, M. A., Abah, M. A., Odimgbe, E. I., Adewale, F. E., Arthur, C., Ajayi, A. S., Ezeani, J., Ede, F. O., Oladosu, O. A., & Ohanele, E. C. (2026). Smart electrochemical sensors and IoT for monitoring heavy metals in Nigerian water: Review of advances and deployment challenges. Trends in Ecological and Indoor Environmental Engineering, 4(1), 79–89.

PalmSens. (2026). EmStat4S: USB powered potentiostat/galvanostat with EIS. PalmSens BV.

Preusser, K., Moore, J. M., Duke, K., Dhungana, P., Solomon, C. V., Genna, D. T., & Park, B. W. (2025). Electrochemical detection of multiple heavy metal ions using a hybrid nanocomposite of a metal–organic framework and cellulose nanocrystal-PEDOT: PSS. Langmuir, 41(35), 23289-23302.

Reda, A., Nabeel, M., Raafat, E., Khalifa, M. R., & Shoeib, T. (2026). Voltammetric sensing of heavy metals for global water security: A critical materials perspective on field-deployable monitoring platforms. npj Clean Water, 9, Article 15.

Rowe, A. A., Bonham, A. J., White, R. J., Zimmer, M. P., Yadgar, R. J., Hobza, T. M., Ohta, J. W., & Plaxco, K. W. (2011). CheapStat: An open-source, “do-it-yourself” potentiostat for analytical and educational applications. PLoS ONE, 6(9), Article e23783.

Saqib, M., Korotkova, E. I., Li, K., Firoz, N., Vashisth, M., Hui, A. L., Lipskikh, O. I., & Kar, P. K. (2026). Artificial intelligence in electrochemical sensing: A network evidence map of translational barriers and pathways to point-of-care deployment. Biosensors, 16(8), Article 470.

Saqib, M., Solomonenko, A. N., Hazra, N. K., Aljasar, S. A., Korotkova, E. I., Dorozhko, E. V., Vashisth, M., & Kar, P. K. (2025). Electrochemical detection of heavy metals using graphene-based sensors: Advances, meta-analysis, toxicity, and sustainable development challenges. Biosensors, 15(8), Article 505.

Savas, S., & Gharibzahedi, S. M. T. (2025). Smartphone-integrated electrochemical devices for contaminant monitoring in agriculture and food: A review. Biosensors, 15(9), Article 574.

Sfragano, P. S., Laschi, S., & Palchetti, I. (2026). Metal–organic frameworks and enzyme-mimicking nanomaterials (nanozymes) for the electrochemical sensing of environmental contaminants. TrAC Trends in Analytical Chemistry, 199, Article 118775.

Shahdoost, M., Colburn, T. A., & Kiani, M. (2021). Closed-loop stability and bandwidth optimization in high-gain electrochemical transimpedance readout circuits. IEEE Transactions on Circuits and Systems I: Regular Papers, 68(3), 1045–1058.

Shamish, Z., Kumar, P., Kornweitz, H., Zohar, M., Shamir, D., Jelinek, R., & Burg, A. (2026). Dip-pen nanolithography-fabricated Bi and Hg meta-chemical surface sensors for ultra-sensitive detection of heavy metals in water. iScience, 29(8), Article 116922.

Shan, X., Jiu, X., Chen, J., Gao, S., Zhang, Y., & Hu, G. (2026). Advances and future trends in nanomaterial-enabled electrochemical sensors for heavy metal detection. Current Research in Food Science, 12, Article 101346.

Shi, Y., Zhang, S., Zhou, H., Dong, Y., Liu, G., Ye, W., He, R., & Zhao, G. (2025). Recent developments in heavy metals detection: Modified electrodes, pretreatment methods, prediction models and algorithms. Metals, 15(1), Article 80.

Stratmann L, Heery B, Coffey B. EmStat Pico: Embedded electrochemistry with a miniaturized, software-enabled potentiostat system on module [Internet]. Analog Devices; 2019. Available from: https://www.palmsens.com/ko/app/uploads/2019/11/EmStat-Pico-Embedded-Electrochemistry-with-a-Miniaturized-Software-Enabled-Potentiostat-System-on-Module.pdf

Sulthana, S. F., Iqbal, U. M., Suseela, S. B., Anbazhagan, R., Chinthaginjala, R., Chitathuru, D., Ahmad, I., & Kim, T. H. (2024). Electrochemical sensors for heavy metal ion detection in aqueous medium: A systematic review. ACS Omega, 9(24), 25493–25512.

Taheri, M., Ahour, F., & Keshipour, S. (2018). Sensitive and selective determination of Cu2+ at d-penicillamine functionalized nano-cellulose modified pencil graphite electrode. Journal of Physics and Chemistry of Solids, 117, 180-187.

Teodoro, K. B., Sanfelice, R. C., & Correa, D. S. (2019). Electrospun cellulose nanocrystal/rGO/polyamide hybrid nanocomposites for electrochemical mercury detection. Carbohydrate Polymers, 207, 740–749.

Wagh, P. (2026). Artificial intelligence-driven sensor systems for heavy metal pollution monitoring: Emerging applications and future directions. Discover Applied Sciences, 8(4), Article 646.

Wang, M., Zheng, X., Oba, B. T., Lin, Y., Shen, C., Huang, X., ... & Ding, Y. (2025). Innovations in nanomaterials for remediation of heavy metal− polluted soil: Advances, mechanistic insights, and future prospects. Nano Materials Science.

Wang, X., Xu, M., Kuang, Y., Liu, X., & Yuan, J. (2024). A novel ratiometric electrochemical aptasensor based on M-shaped functional DNA complexes for simultaneous detection of trace lead and mercury ions in series aquatic edible vegetables. Journal of Hazardous Materials, 465, 133169.

Wei, X., Zhang, Y., & Liu, Q. (2025). Origami-style microfluidic paper-based analytical devices (EµPADs) modified with nitrogen-doped graphene for multi-metal screening. Microchemical Journal, 201, Article 110512.

Xu, Z., Jaiswal, A., Liu, X., Yang, Z., Yin, Q., Kong, K. V., & Yong, K. T. (2024). Microfluidics evolution and surface functionalization: A pathway to enhanced heavy metal ion detection. Advanced Sensor Research, 3(5), Article 2400008.

Yang, Q., Nagar, B., Alvarez-Diduk, R., Balsells, M., Farinelli, A., Bloisi, D., & Merkoçi, A. (2021). Development of a heavy metal sensing boat for automatic analysis in natural waters utilizing anodic stripping voltammetry. ACS ES&T Water, 1(12), 2470–2476.

Yulirohyami, G., Fatimah, I., Siswanta, D., & Mudasir, M. (2025). Green synthesis of AgNPs-dithizone@ chitosan for highly selective and reusable electrochemical sensors of Hg2+. Microchemical Journal, 214, 114015.

Zheng, Y., Chen, J., Fu, L., & Huang, X. (2026). Portable electrochemical systems for on-site detection of heavy metal ions: Principles, hardware architectures, and field applications. Smart Materials and Devices, 2(3), Article 202614.

Zhu, Y., Gao, J., Xu, P., Zhang, M., Tao, Y., Qiao, L., ... & Zhang, Y. (2024). Electrochemical sensor based on Y-shaped DNA by “one-pot” method for mercury detection. Microchemical Journal, 204, 111013.

Zhu, Y., Wang, M., & Li, X. (2025). Engineered DNA-gold nanostructures for square-wave voltammetric mercury detection in aquatic ecosystems. Talanta, 281, Article 126810.

Article metrics
View details
0
Downloads
0
Citations
134
Views

View Dimensions


View Plumx


View Altmetric


0
Save
0
Citation
134
View
0
Share