3.1 Statistical Overview of Price and Trade Trends
Start with the headline number, because it frames everything that follows: Bangladesh's overall inflation rate climbed to 6.17 percent in February 2022, the highest reading since October 2020, with sugar, eggs, and edible oil doing most of the damage (Halder, 2022). That is not a subtle shift. It is the kind of figure that shows up not in a spreadsheet but in a household's weekly shopping bag, where the same basket simply costs more than it did a few months earlier.
The trade data behind that number tell a related, though not identical, story. Import volumes for essential commodities moved unevenly across the period under review — up sharply for some items, down for others — a pattern visible in the country's shifting import composition between December 2021 and July 2022 [Table 1; Table 2]. Raw sugar imports, for instance, jumped by more than 85 percent month-on-month between December 2021 and January 2022, while soybean oil imports fell by roughly 27 percent over the same window [Table 1]; by mid-2022, onion imports had spiked by an almost implausible 3,183 percent from June to July, alongside a 939 percent jump in rice imports [Table 2]. Numbers that volatile are, frankly, a little hard to interpret cleanly — they may reflect genuine demand shifts, seasonal restocking, or simply the lumpiness of how import shipments get recorded month to month. Still, taken together, they point to a supply chain under considerable strain.
Trade figures for January 2022 sharpen the picture further: exports totaled Tk. 493.95 billion against imports of Tk. 917.94 billion, leaving a trade gap of Tk. 423.99 billion, with both export and import growth rates weaker than the previous year's (Bangladesh Bureau of Statistics, 2022b). Put plainly, Bangladesh was paying more for what it brought in while earning comparatively less from what it sent out — not, by any measure, a combination conducive to price stability.
Table 1. Import volumes for fifteen essential commodities, comparing December 2021 and January 2022, together with the month-on-month percentage change and the cumulative import total through January 2022. The data, sourced from the Bangladesh Bureau of Statistics (2022a), illustrate the sharp swings in import activity — most notably an 85.6 percent rise in raw sugar imports — that coincided with the onset of the price increases discussed in Section 3.1. (The wheat percentage in the image appears as −1773, but based on the December and January values, the calculated percentage change is approximately −17.73%.)
|
Item
|
Dec. 2021
|
Jan. 2022
|
Percent Change from Previous Month
|
Cumulative (Jan. 2022)
|
|
Raw sugar
|
307,288
|
570,241
|
85.57%
|
2,747,104
|
|
Palm oil
|
138,223
|
160,493
|
16.11%
|
1,566,561
|
|
Soya bean oil
|
176,670
|
129,811
|
−26.52%
|
735,051
|
|
Milk & Cream
|
7,544
|
11,893
|
—
|
78,347
|
|
Ginger
|
—
|
—
|
—
|
—
|
|
Chillies
|
—
|
—
|
—
|
—
|
|
Wheat
|
416,440
|
342,597
|
−17.73%
|
2,180,849
|
|
Rice
|
44,290
|
38,670
|
−12.69%
|
997,793
|
|
Lentil & Other
|
10,546
|
9,563
|
−9.32%
|
178,722
|
|
Onion
|
81,838
|
83,509
|
2.04%
|
774,697
|
|
Garlic
|
2,682
|
4,916
|
83.30%
|
29,258
|
|
Tea
|
104
|
6
|
−94.23%
|
557
|
|
Oilseed
|
439,750
|
185,385
|
−57.84%
|
185,385
|
|
Gram/Anchor
|
—
|
2
|
—
|
2
|
|
Turmeric
|
2,539
|
1,351
|
−46.79%
|
14,046
|
Top of Form
Bottom of Form
Table 2: Import volumes for the same fifteen essential commodities, comparing June and July 2022, with month-on-month percentage change and cumulative totals through July. Drawn from the Bangladesh Bureau of Statistics (2022a), the figures capture extreme short-term volatility later in the review period, including a 3,183 percent surge in onion imports and a 939 percent jump in rice imports, underscoring how unevenly import flows moved across commodities.
|
Items
|
Jun'22
|
July'22
|
Percent change from previous month
|
Cumulative (Jan-22)
|
|
Raw sugar
|
200,114
|
263,796
|
31.82
|
263,796
|
|
Palm oil
|
214,613
|
212,000
|
-1.22
|
212,000
|
|
Soya bean oil
|
211,287
|
81,555
|
-61.40
|
81,555
|
|
Milk & Cream
|
17,517
|
11,423
|
-34.79
|
11,423
|
|
Ginger
|
-
|
-
|
-
|
-
|
|
Chillies
|
-
|
-
|
-
|
-
|
|
Wheat
|
72,126
|
53,085
|
-26.40
|
53,085
|
|
Rice
|
2,026
|
21,042
|
938.60
|
21,042
|
|
Lentil & other
|
43,701
|
41,564
|
-4.89
|
41,564
|
|
Onion
|
3,282
|
107,755
|
3183.21
|
107,755
|
|
Garlic
|
11,122
|
6,664
|
-40.08
|
6,664
|
|
Tea
|
381
|
13
|
-96.59
|
13
|
|
Oil seed
|
402,535
|
563,503
|
39.99
|
563,503
|
|
Gram/Anchor
|
38
|
-
|
-1
|
-
|
|
Turmeric
|
4,410
|
1,387
|
-68.55
|
1,387
|
3.2 Global Versus Domestic Price Divergence
Here is where the analysis gets more interesting, and arguably more uncomfortable. The gap between how much prices rose internationally and how much they rose inside Bangladesh is, in places, difficult to explain through global shocks alone. Wheat flour is the clearest case: its domestic price rose by roughly 67 percent even as the international wheat price increased by only about 8 percent over the same stretch (Islam, 2022). An eightfold divergence of that size is not the kind of thing shipping costs or a weaker taka can fully account for, though both surely played some part.
Lentils followed a similarly lopsided path — up 29 to 39 percent on local markets while global lentil prices were, if anything, falling (Halder, 2022). Sugar told much the same story: domestic prices rose by Tk 150 per maund over just two weeks, during a period when world sugar prices were trending downward (Billah, 2022). This pattern of domestic prices moving opposite to, or well beyond, global benchmarks recurs often enough across the sources reviewed here that it looks less like coincidence and more like a structural feature of the period [Fig. 1].
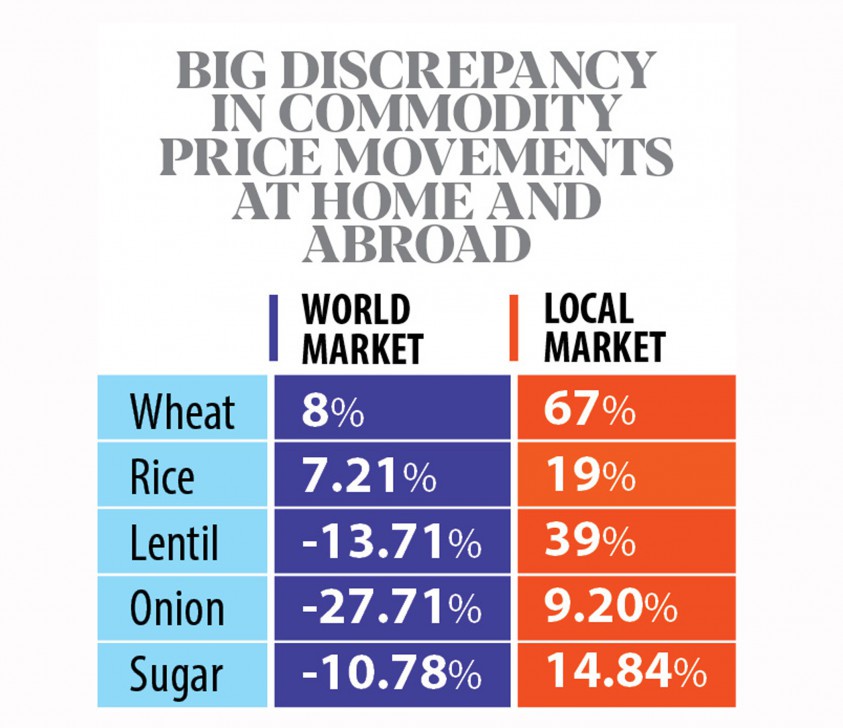
Fig. 1. Comparison of domestic and international price movements for selected commodities, highlighting the extent to which local prices in Bangladesh diverged from global benchmarks over the same period. Reproduced from Islam (2022), the figure visually supports the argument developed in Section 3.2 that domestic pricing behavior cannot be explained by global market conditions alone.
What might be driving that gap? Import costs, freight charges, and currency depreciation are the obvious first suspects, and they are real — but they would not typically be expected to produce a divergence as large as the one observed for flour. A less comfortable, though arguably more plausible, explanation points toward domestic market structure: concentrated wholesaling, thin retail competition, and — as Islam (2022) reports fairly directly — instances in which dealers appear to have used a genuine global crisis as cover to raise prices beyond what that crisis alone would justify. It is worth noting, too, that average inflation rose from 5.6 percent in fiscal 2020–21 to 6.2 percent the following year, overshooting the government's own revised target of 5.7 percent (Islam, 2022). Modest as that overshoot looks on paper, it is a fairly telling sign that domestic price management has not kept pace with its own stated ambitions.
3.3 Structural Drivers Behind the Price Increases
No single factor explains all of this, and the literature reviewed for this paper is reasonably consistent on that point [Table 3]. A few structural drivers recur often enough to merit individual naming.
Table 3. Comparative summary of nine peer-reviewed studies on commodity price shocks, spanning 2013 to 2021. Each row lists the source publication, its central research focus, and its principal finding, ranging from links between price shocks and armed conflict to the role of governance in moderating financial-development effects. Together, the studies establish the broader empirical backdrop against which Bangladesh's own price experience is interpreted in this paper.
|
Scientific Paper
|
Proposed System / Focus
|
Finding / Solution
|
Year
|
|
Do commodity price shocks cause armed conflict? A meta-analysis of natural experiments
|
Rudkin (2021) examines the relationship between commodity prices and armed civil conflict.
|
Meta-analysis of 46 natural experiments using difference-in-difference designs.
|
2021
|
|
Commodity price shocks and civil conflict: Evidence from Colombia. The Review of Economic Studies
|
Dube and Vargas (2013) exploit exogenous price shocks in global commodity markets and examine how income shocks affect conflict.
|
Variation in labor-intensive agricultural product prices versus natural resource prices.
|
2013
|
|
Commodity-price comovement and global economic activity. Journal of Monetary Economics
|
Alquist et al. (2019) study changes in commodity prices and global economic activity using a factor-based identification technique.
|
A factor structure for commodity prices with identification criteria that support economic interpretation.
|
2019
|
|
Financial development curse in resource-rich countries: The role of commodity price shocks. The Quarterly Review of Economics and Finance
|
Mlachila and Ouedraogo (2019) investigate whether commodity price fluctuations retard financial growth.
|
Effective governance can lessen the effects of commodity price shocks.
|
2019
|
|
The impact of Covid-19 on commodity markets volatility: Analyzing time-frequency relations between commodity prices and coronavirus panic levels. Resources Policy
|
Umar et al. (2021) use wavelet analytics to examine the impact of Covid-19 on commodity price volatility.
|
N/A
|
2021
|
|
Commodity price volatility and the economic uncertainty of pandemics. Economics Letters
|
Bakas and Triantafyllou (2020) study aggregate demand and supply shocks driving commodity prices.
|
OPEC responded by reducing oil output in line with IEA projections during the pandemic.
|
2020
|
|
The impact of uncertainty shocks on the volatility of commodity prices. Journal of International Money and Finance
|
Bakas and Triantafyllou (2018) use VAR analysis to determine the impact of uncertainty on commodity price volatility.
|
Unobservable economic uncertainty metrics have a durable, beneficial impact on volatility.
|
2018
|
|
Economic uncertainty and commodity futures volatility (Working Paper 15-14, Office of Financial Research)
|
Watugala (2015) examines the relationship between commodity volatility and fundamental uncertainty.
|
Futures volatility is related to commodities whose importers are concentrated in emerging markets.
|
2015
|
|
Does the volatility of commodity prices reflect macroeconomic uncertainty? Energy Economics
|
Joëts et al. (2017) examine whether macroeconomic uncertainty affects agricultural, industrial, and precious metals markets.
|
The 2007–2009 recession caused an unusual phase of extreme price uncertainty.
|
2017
|
|
Price overreactions in the commodity futures market: An intraday analysis of the Covid-19 pandemic impact. Resources Policy
|
Borgards et al. (2021) investigate overreaction behavior in 20 commodity futures during the pandemic.
|
Overreactions occurred more often and with greater amplitude during Covid-19.
|
2021
|
Market syndication and the role of intermediary "middlemen" come up repeatedly as amplifiers — not originators, necessarily, but amplifiers — of price movements beyond what supply conditions alone would predict. Reduced domestic agricultural output in certain seasons compounds an already heavy reliance on imports, particularly for edible oil, roughly 95 percent of which Bangladesh imports (Halder, 2022). When the global price of a barrel of edible oil climbed from around US$700 to nearly US$1,940 following Russia's invasion of Ukraine, the country had little room to absorb that shock (Halder, 2022). That kind of exposure is broadly consistent with Alquist et al.'s (2019) factor-based account of commodity price co-movement, which suggests that general-equilibrium shocks — the sort that move across many markets at once, the way an energy shock tends to — hit import-dependent economies more uniformly than commodity-specific shocks do.
The war's reach extended well beyond edible oil. Russia and Ukraine together account for roughly 30 percent of global wheat exports, and Ukraine alone for about 17 percent of maize exports; the resulting disruption, combined with weaker anticipated harvests elsewhere, pushed wheat and corn prices up by an estimated 39 percent and 23 percent, respectively, over the year (Kadziolka, 2022) [Fig. 2]. Bangladesh's own response — a 12 percent domestic LPG price increase within a single month (Kadziolka, 2022) — was defensible as a short-term fiscal adjustment, though it also passed costs directly onto households already stretched thin by food-price increases on several fronts simultaneously.
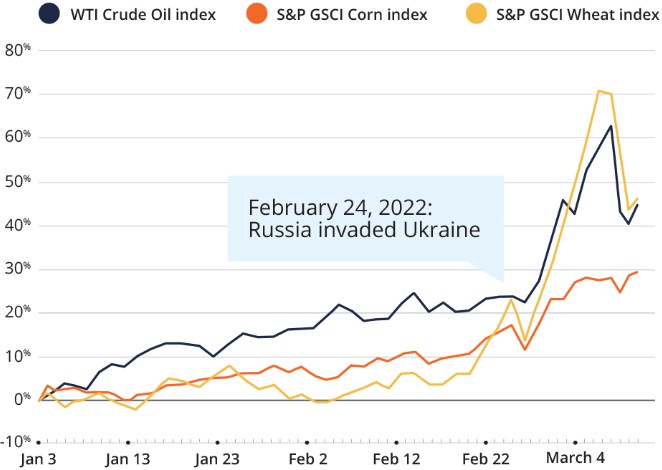
Fig. 2. Trend of rising global commodity prices across 2022, tracking categories such as energy, grains, and metals in the months following the onset of the Russia–Ukraine conflict. Sourced from Kadziolka (2022), the figure situates Bangladesh's import cost pressures within the wider pattern of global commodity inflation discussed in Section 3.3.
It is worth pausing, briefly, on why global commodity markets behave this unpredictably in the first place, since it bears on how much of Bangladesh's exposure was avoidable. Umar et al. (2021) found that the relationship between commodity prices and pandemic-era fear indices shifted over time, occasionally opening genuine diversification opportunities even amid crisis — a counterintuitive finding that cautions against treating "pandemic" and "price shock" as interchangeable terms. Bakas and Triantafyllou (2020) linked OPEC's pandemic-era production cuts to broader volatility in energy-linked commodities, while their earlier work (Bakas & Triantafyllou, 2018) suggested that unobservable, "hidden" uncertainty shocks influence commodity price volatility more durably than visible, headline indicators do. Watugala (2015) tied futures-market volatility to emerging-market demand growth, and Joëts et al. (2017) showed that the 2007–2009 recession produced an unusually long stretch of pricing uncertainty. Borgards et al. (2021), examining intraday data across twenty commodity futures, found that price overreactions grew both more frequent and more severe during the early pandemic, especially in energy markets. None of this was written with Bangladesh specifically in mind, but together it sketches an environment of heightened, somewhat erratic global volatility into which Bangladesh's own import dependency and market concentration fed directly.
3.4 Household and Poverty Impacts
None of the preceding discussion means much without asking who actually absorbs these price movements — and the answer, unsurprisingly, is that the burden falls unevenly. Food typically accounts for 50 to 60 percent of total spending among disadvantaged households in Bangladesh (Halder, 2022), which means a proportional rise in food prices consumes a share of household income that wealthier consumers simply never feel in the same way. Older data offer useful context here: according to the 2005 Household Income and Expenditure Survey, staple foods already made up more than a third of annual expenditure for the poorest fifth of the population, well before the 2020–2022 shocks arrived. If anything, that earlier vulnerability appears to have deepened rather than been newly created.
Islam (2022) cites estimates suggesting the pandemic alone pushed roughly 32 million people into poverty nationally, with some critics attributing part of that increase to domestic policy choices rather than external shocks alone. This review cannot independently verify that attribution — it draws on secondary sources rather than primary poverty data — but it does not find the claim implausible, given the price patterns documented in Sections 3.1 through 3.3. The visible queues of middle- and lower-income households at Trading Corporation of Bangladesh discount trucks are, seen in this light, less an anecdote worth mentioning in passing and more a fairly direct, observable symptom of the affordability gap this paper has tried to trace.
3.5 Policy Responses and Their Limits
Government interventions so far — LPG price adjustments, TCB discount distribution — address symptoms more than causes, at least as far as the evidence reviewed here suggests. Given the scale of the domestic-versus-global divergence documented in Section 3.2, it seems reasonable to conclude that policy attention aimed solely at import costs will likely under-address the underlying problem.
There is, however, a cautiously optimistic thread running through the comparative literature. Mlachila and Ouedraogo (2019) found that effective governance measurably reduces the financial-development costs associated with commodity price shocks — meaning institutional quality, not global market conditions alone, appears to shape how severely a given shock is ultimately felt. Whether Bangladesh's regulatory apparatus is currently positioned to play that moderating role is a separate, and considerably harder, question than this review can settle. It is, arguably, the more consequential one going forward.
3.6 Synthesis
Pulling these threads together: the evidence assembled here does not support a simple story in which Bangladesh's commodity price crisis is purely imported, nor one in which it is purely domestic. Both forces appear to be operating, and not always in ways that are easy to disentangle from secondary data alone — a limitation acknowledged explicitly in Section 2.5. What does seem reasonably clear is that domestic market structure and regulatory gaps are doing more of the work than a purely global-shocks narrative would predict, and that the households least equipped to absorb the difference are the ones bearing most of it.