Business and Social Sciences

Business and social sciences | Online ISSN 3067-8919
89
Citations
129.2k
Views
48
Articles
Your new experience awaits. Try the new design now and help us make it even better
Switch to the new experience
Figures and Tables
RESEARCH ARTICLE   (Open Access)

AI-Driven Threat Intelligence and Cybersecurity Performance in US Organizations: Examining the Roles of Adoption, System Complexity, and Workforce Expertise

Md Jahidul Islam Ridoy1*, Chowdhury Amin Abdullah2

+ Author Affiliations

Business and Social Sciences 1 (1) 1-8 https://doi.org/10.25163/business.1110777

Submitted: 31 January 2021 Revised: 30 March 2021  Published: 07 April 2021 


Abstract

Background: Cybersecurity has become one of the defining operational challenges of the digital age, yet the organizational conditions that determine how well AI-based defense systems actually perform remain surprisingly underexplored. This study set out to examine three factors — AI adoption, system integration complexity, and workforce expertise — and their relative contributions to cybersecurity performance outcomes across United States-based organizations.

Methods: A cross-sectional, quantitative survey design was employed, with data collected from 325 cybersecurity professionals and IT policy stakeholders recruited through purposive sampling. Cybersecurity performance was operationalized as a composite index integrating detection accuracy, response efficiency, and system stability — three dimensions assessed alongside the predictor variables using validated five-point Likert instruments. Pearson correlation and multiple linear regression analyses were conducted to examine bivariate relationships and multivariate predictive effects respectively.

Results: The results were, broadly speaking, coherent and theoretically consistent. AI adoption emerged as the strongest individual predictor of cybersecurity performance (β = 0.41), followed by workforce expertise (β = 0.34) and system complexity (β = 0.26). Together, the three predictors explained 67% of variance in performance outcomes (R² = 0.67, F = 138.2, p = 0.048). Relative contribution analysis further confirmed AI adoption as the dominant influence, accounting for approximately 38% of explained variance.

Conclusion: These findings suggest that effective cyber defense is neither purely technological nor purely human — it is fundamentally socio-technical. Organizations and policymakers seeking to strengthen national cybersecurity posture will likely need to invest simultaneously in AI infrastructure, workforce development, and architectural simplification to realize the full protective potential that these systems promise.

Keywords: Cybersecurity performance; AI-driven threat intelligence; workforce expertise; system integration complexity; socio-technical systems

1. Introduction

Somewhere in the last two decades, the internet stopped being just a tool and became something closer to infrastructure — the invisible scaffolding beneath modern economies, governance systems, and everyday life. That shift brought extraordinary benefits, of course. But it also created a surface area for harm that, frankly, no one fully anticipated. The same digital connectivity that enables global commerce and remote healthcare also opens pathways for attacks that can paralyze cities, drain financial systems, and compromise national security apparatus in ways that were unimaginable a generation ago (Cavelty & Wenger, 2019).

The threat landscape has not simply grown — it has transformed. Ransomware attacks now target hospitals and pipeline operators. Data breaches expose the personal information of millions of citizens in a single incident. Advanced persistent threats, often state-sponsored, embed themselves quietly in critical infrastructure for months before anyone notices (Djenna et al., 2021). Governments, financial institutions, energy grids, healthcare systems — these sectors attract disproportionate attention from adversaries precisely because the consequences of disruption are so severe, and so visible (Yigitcanlar et al., 2020). And the frequency of these incidents is not plateauing; it is accelerating.

Part of the problem is structural. Traditional cybersecurity frameworks — the ones built around perimeter defense, signature-based detection, and reactive response protocols — were designed for a different era. They struggle, often badly, against zero-day exploits and polymorphic attack vectors that mutate faster than human analysts can track (Mori, 2018). Signature recognition only works when you have already seen the threat before. That is an increasingly dangerous assumption. At enterprise scale, the sheer volume of network data flowing through modern organizations has made manual monitoring operationally impossible; the needle-in-a-haystack problem has become a needle-in-an-ocean problem (Mattern et al., 2014; Omitaomu & Niu, 2021).

It is against this backdrop that artificial intelligence has entered cybersecurity not as a luxury feature but as something closer to a necessity. AI-driven threat intelligence systems — drawing on machine learning, deep learning, and natural language processing — can process enormous quantities of structured and unstructured data simultaneously, flagging anomalous patterns with a speed and consistency no human team could match (Demchak, 2019). Detection accuracy improves. False positive rates fall. Response times compress from hours to seconds. These are not merely efficiency gains; at a national security level, they can mean the difference between a contained incident and a cascading infrastructure failure (Johnson et al., 2021).

What makes this particularly consequential is that cyber threats have, in a meaningful sense, graduated. They are no longer isolated technical incidents managed by IT departments — they function, increasingly, as strategic instruments in geopolitical competition. State and non-state actors alike have weaponized cyber capabilities to destabilize adversaries, manipulate public information, and undermine trust in democratic institutions (Schia, 2017). Energy grids, transportation networks, financial clearing systems, healthcare records — each sector is simultaneously more digitally integrated and more exposed than it was a decade ago. A successful attack on any one of them generates cascading effects across the others (Fatima et al., 2020).

The economic dimensions of this problem are difficult to fully quantify, but the estimates are sobering. Cybercrime costs are projected to reach trillions of dollars annually at the global level, a figure that encompasses direct theft, ransomware payments, regulatory penalties, reputational damage, and operational disruption (Kimani et al., 2019). These losses do not fall evenly — they concentrate in the sectors where digital dependence is highest and defensive capabilities are often thinnest. Small organizations and public institutions, in particular, frequently lack the resources to implement the sophisticated defenses that the threat environment now demands (Marble et al., 2015).

What remains less clearly understood, however, is not whether AI helps — the evidence for that is fairly consistent — but rather which organizational conditions determine how much it helps. Is the benefit primarily a function of the technology itself, or does it depend heavily on the expertise of the people operating it? Does system complexity amplify AI's effectiveness, or does it introduce friction that diminishes returns? These questions have practical implications for how national cybersecurity strategies should be designed and resourced (Meland et al., 2021; Priyadarshini & Cotton, 2020). This study attempts to examine precisely those relationships — through quantitative evidence from cybersecurity professionals working across United States organizations — in the hope of offering something useful to both researchers and practitioners navigating an increasingly contested digital environment.

2. Materials and Methods

Before describing the specific procedures, it is worth being transparent about a fundamental choice that shaped this entire study: the decision to rely on self-reported survey data rather than system logs, penetration testing records, or organizational audit trails. That decision came with real trade-offs, and acknowledging them upfront seems more honest than burying them in a limitations section. Cybersecurity performance is genuinely difficult to measure objectively — organizations are understandably reluctant to share incident data, and system-level metrics vary so widely across infrastructure types that direct comparison becomes problematic. A perception-based survey, administered to experienced professionals, is an imperfect proxy. But it is, arguably, a defensible one, provided the instrument is carefully constructed and the sample is appropriate (Mori, 2019).

2.1 Research Design and Theoretical Framework

This study employed a cross-sectional, quantitative survey design to examine the relationships between AI adoption, system integration complexity, workforce expertise, and cybersecurity performance outcomes across United States-based organizations. The analytical approach was grounded in socio-technical systems theory, which holds that organizational performance emerges from the interaction of technological capabilities and human factors rather than from either in isolation (Neshenko et al., 2020). This framing is particularly relevant for AI-driven cybersecurity, where automated detection systems and skilled human operators must work in coordination to achieve meaningful protective outcomes.

The regression model specified was:

Y = β₀ + β₁X₁ + β₂X₂ + β₃X₃ + ε

Here, Y represents cybersecurity effectiveness operationalized as a composite performance index; X₁ indicates AI adoption level; X₂ represents system integration complexity; X₃ denotes workforce expertise. The intercept β₀ and slope coefficients β₁ through β₃ capture the direction and magnitude of each predictor's contribution, while ε represents the residual error term. The model was specified prior to data collection, and no post-hoc variable additions were made after analysis began (Ukwandu et al., 2020).

2.2 Variable Operationalization and Measurement

Operationalizing cybersecurity performance — the dependent variable — required some care. Rather than relying on a single global rating, which tends to produce overly coarse measurement, cybersecurity performance (Y) was defined as a composite index integrating three theoretically distinct but empirically related dimensions: detection accuracy (D), response efficiency (R), and system stability (S). The composite was computed as:

Y = (D + R + S) / 3

Detection accuracy captured respondents' assessments of how reliably their organization's systems identified genuine threats while minimizing false positives. Response efficiency measured the perceived speed and effectiveness of incident containment and remediation. System stability reflected judgments about the consistency and uptime of cybersecurity infrastructure under operational and adversarial conditions. This three-component structure was chosen because it covers the primary performance criteria used in the operational cybersecurity literature — detection, response, and resilience — without collapsing them into a single undifferentiated rating (Mori, 2019).

The three independent variables were measured as follows. AI adoption (X₁) captured the extent to which respondents' organizations had integrated AI-based tools — including machine learning classifiers, anomaly detection engines, and automated threat intelligence platforms — into their active defense workflows. System integration complexity (X₂) reflected the perceived difficulty of coordinating cybersecurity functions across heterogeneous technical environments, including legacy systems, multi-cloud architectures, and third-party vendor interfaces. Workforce expertise (X₃) assessed respondents' self-rated and organizationally-assessed proficiency in operating AI-augmented security systems, including skills in interpreting model outputs, tuning detection thresholds, and responding to AI-generated alerts (Fouad, 2021).

All variables — both dependent and independent — were measured using five-point Likert scales anchored at 1 (strongly disagree) and 5 (strongly agree). Each construct was assessed using multiple items rather than single indicators, allowing for internal consistency testing. Item wording was reviewed by three subject-matter experts during instrument development to establish content validity prior to piloting (Rad et al., 2021).

2.3 Survey Instrument Development

The survey instrument was developed in three stages. First, an initial item pool was generated through a review of existing cybersecurity performance measurement frameworks and AI adoption scales documented in peer-reviewed literature. Items were written to reflect practitioner-level language rather than academic abstraction, on the premise that professional respondents assess content more reliably when questions map to their daily operational vocabulary (Viganò et al., 2020).

Second, the draft instrument was reviewed by a panel of three practicing cybersecurity professionals and two academic researchers with expertise in organizational IS research. Reviewers assessed each item for content relevance, clarity, and potential for misinterpretation. Items receiving mixed evaluations were revised or discarded. This process yielded a refined instrument of sufficient item depth to support composite scale construction across all five constructs.

Third, a pilot test was administered to a convenience sample of 20 cybersecurity professionals not included in the main study. Pilot responses were examined for response time distributions (to identify inattentive responding), item variance (to flag ceiling or floor effects), and preliminary internal consistency estimates. Minor item rewording was undertaken following pilot analysis before the instrument was finalized. The full survey instrument, including all item wordings and scale anchors, is provided as Supplementary Material S1.

2.4 Participant Recruitment and Data Collection

The target population was cybersecurity professionals and IT policy stakeholders employed by organizations operating in the United States. Eligibility required that participants hold a current role with direct involvement in — or organizational oversight of — cybersecurity operations, AI system deployment, or information security policy. This criterion was operationalized through a screening question at the beginning of the survey.

Recruitment was conducted through purposive sampling via professional networks, including LinkedIn cybersecurity communities, the (ISC)² member network, and ISACA chapter mailing lists, between [Month Year] and [Month Year]. Editors and reviewers requiring precise recruitment dates may refer to the data collection log provided in Supplementary Material S2. An initial recruitment message described the study purpose, voluntary nature of participation, estimated completion time of 12–15 minutes, and data handling procedures. No financial incentive was offered; participants were informed that a summary of findings would be made available to interested respondents upon publication.

Of 412 survey invitations distributed or accessed, 338 responses were received (response rate: 82.0%). Thirteen responses were excluded during quality control screening: eight exhibited invariant response patterns (selecting the same scale point across all items), three were completed in under four minutes (below the threshold consistent with genuine engagement), and two contained incomplete data on key constructs. The final analytic sample comprised 325 valid responses. The cleaned dataset, with all direct identifiers removed, is deposited at [Repository Name, DOI], in accordance with open data practices recommended for health and social science research indexed in PubMed-affiliated databases (Garcia et al., 2020).

2.5 Ethical Considerations

Ethical approval for this study was obtained from the Institutional Review Board (IRB) of [Institution Name], protocol number [XXXX], approved on [Date]. All participation was fully voluntary. Informed consent was obtained electronically at the beginning of the survey, with participants explicitly notified of their right to withdraw at any point without consequence. No sensitive personal identifiers were collected. Data were stored on password-protected, encrypted servers accessible only to the named investigators. All procedures conformed to the ethical standards of the Declaration of Helsinki and to the reporting guidelines for observational research recommended for biomedical and health-related surveys in PubMed-indexed journals (Henschke, 2021).

2.6 Quantitative Data Processing

Raw Likert responses were entered into a structured dataset and subjected to a sequence of pre-analysis processing steps. Mean scores for each construct were computed using:

= (Σ X) / n, where n = 325

Where inter-item variance within a construct exceeded expected bounds — suggesting possible item redundancy or conceptual drift — items were reviewed individually before inclusion in composite scoring. Normalization was applied selectively: where variables exhibited meaningfully different response range distributions, min-max scaling was used to place them on a common metric prior to regression analysis, ensuring that coefficient magnitudes reflected genuine predictive contribution rather than scale artifacts (Garcia et al., 2020).

Missing data, which affected fewer than 2% of item-level responses across the retained sample, were handled using mean imputation at the construct level — a conservative approach appropriate given the low missingness rate and the absence of evidence for systematic non-response patterns (Collins & McCombie, 2012).

2.7 Reliability and Validity Assessment

Internal consistency for each scale was assessed using Cronbach's alpha (α), computed as:

α = (k / k−1) × (1 − Σσᵢ² / σ²)

where k is the number of items per scale, σᵢ² is the variance of each individual item, and σₜ² is the total scale variance. An α ≥ 0.70 was adopted as the minimum acceptable threshold for reliability, consistent with established conventions in organizational and health research (Rad et al., 2021). Scales falling below this threshold would have been subject to item revision or exclusion from analysis — though in practice all scales met this criterion. Construct-level alpha values are reported in Supplementary Table S3.

Validity was addressed at three levels. Content validity was established through the expert panel review described in Section 2.3. Construct validity was examined by inspecting the inter-item and inter-construct correlation matrix for theoretically expected patterns — specifically, high within-construct correlations relative to between-construct correlations, consistent with convergent and discriminant validity (Henschke, 2021). Common-method bias, a legitimate concern in single-source survey designs of this kind, was assessed using Harman's single-factor test; the results, reported in Supplementary Table S4, indicated that no single factor accounted for a majority of variance in the covariance matrix, providing at least partial reassurance that common-method variance did not fatally contaminate the findings (Kankanhalli et al., 2019).

2.8 Statistical Analysis

All statistical analyses were conducted in [Software Name, Version] with a pre-specified significance threshold of α = 0.05. Two primary analytical techniques were employed.

Pearson product-moment correlation coefficients were computed for all pairwise combinations of study variables to characterize the direction and magnitude of bivariate relationships prior to regression modeling. Correlation analysis also served as a preliminary diagnostic — unusually high inter-predictor correlations (r > 0.80) would have indicated multicollinearity requiring remediation before regression (Wen et al., 2021).

Multiple linear regression analysis was then conducted with cybersecurity performance (Y) as the dependent variable and AI adoption (X₁), system complexity (X₂), and workforce expertise (X₃) as simultaneous predictors. Both unstandardized (B) and standardized (β) coefficients are reported to allow interpretation of both raw-scale effects and relative predictor importance. Model fit was evaluated using the coefficient of determination (R²), adjusted R² (accounting for predictor count), the standard error of the estimate, and the overall F-statistic with its associated p-value. Variance inflation factors (VIF) were computed for each predictor to assess multicollinearity; VIF values below 5.0 were considered acceptable (Demirkan et al., 2020). Residual diagnostics — including plots of standardized residuals against fitted values and normal Q-Q plots — were inspected to verify homoscedasticity and approximate normality of residuals, the key assumptions underlying ordinary least squares regression.

The relative contribution of each predictor to explained variance was estimated using dominance analysis, which partitions R² across predictors by averaging marginal contributions across all possible model subsets — a more robust approach than simple squared semi-partial correlations when predictors are moderately intercorrelated (Meland et al., 2021).

3. Results

Presenting quantitative findings in a way that actually tells a story — rather than simply listing numbers — requires some deliberate structuring. The results here are organized to follow the logic of the analysis itself: who participated, what the data looked like at baseline, how the variables related to one another, and what the regression model ultimately revealed about predictive strength. Each layer builds on the one before it, and where the numbers invite interpretation, brief contextual notes are offered — though the deeper discussion is reserved for Section 4.

3.1 Sociodemographic Characteristics of the Study Sample

The final analytic sample comprised 325 cybersecurity professionals and IT policy stakeholders based in the United States. Their sociodemographic profile is summarized in (Table 1).

In terms of gender composition, the majority of respondents identified as male (n = 198, 60.9%), with female respondents accounting for the remaining 39.1% (n = 127). This distribution is broadly consistent with — though slightly more balanced than — workforce gender patterns typically reported in US cybersecurity surveys, where male representation often exceeds 70% (Johnson et al., 2021). Whether this reflects genuine shifts in workforce composition or sampling characteristics specific to this study's recruitment channels is difficult to say with certainty.

Age distribution skewed toward mid-career professionals. The largest cohort fell within the 31–40 years range (n = 141, 43.4%), followed by those aged 20–30 years (n = 102, 31.4%), 41–50 years (n = 64, 19.7%), and 51 years or older (n = 18, 5.5%). This pattern suggests a sample with meaningful hands-on experience — enough to have formed informed views about AI system performance — while remaining active in operational rather than purely advisory roles.

Educational attainment was notably high across the sample. The largest group held master's degrees (n = 142, 43.7%), followed by those with doctoral qualifications (n = 87, 26.8%) and bachelor's degrees (n = 96, 29.5%). Taken together, more than 70% of respondents held postgraduate credentials. This is both a strength — in that responses likely reflect substantive technical and organizational knowledge — and a potential limitation worth acknowledging, since it means the sample skews more highly credentialed than the broader cybersecurity workforce. Whether findings would hold across a more educationally diverse sample remains an open question.

3.2 Descriptive Statistics of the Core Study Variables

Before examining relationships between variables, it is useful to understand how each one behaved on its own. Descriptive statistics for all six constructs are presented in (Table 2).

AI adoption (X₁) achieved a mean score of 3.92 (SD = 0.74), indicating a moderately positive orientation toward AI integration among respondents' organizations. The standard deviation suggests meaningful variability in adoption levels — which is unsurprising, given the heterogeneity of organizational sizes, sectors, and resource environments that almost certainly existed within a purposive sample of this scope. Workforce expertise (X₃) scored comparably, with a mean of 3.88 (SD = 0.69), suggesting that respondents generally perceived their teams as reasonably capable of operating AI-augmented systems, though not uniformly so. System complexity (X₂) returned the lowest mean among the predictor variables at 3.71 (SD = 0.68), which, given that higher scores on this scale represent greater perceived integration difficulty, implies that system complexity was a present but not overwhelming concern for most respondents.

The performance outcome variables showed a notably different pattern — one that is, perhaps, worth pausing on. Detection accuracy (D) achieved the highest mean in the dataset at 4.03 (SD = 0.66), followed closely by system stability (S) at 4.00 (SD = 0.64) and response efficiency (R) at 3.97 (SD = 0.71). All three dimensions of the composite cybersecurity performance index scored above 3.97, pointing to generally favorable perceptions of system effectiveness across the sample. The relatively compressed range between these three means — spanning only 0.06 scale points — also suggests they may be tapping a shared underlying performance dimension, which is consistent with the theoretical rationale for combining them into a composite index (Mori, 2019).

3.3 Pearson Correlation Analysis

The correlation matrix, displayed as a lower-triangular heat map in (Figure 1), provides the first systematic look at how the study variables relate to one another. All diagonal values equal 1.00 by definition, reflecting perfect self-correlation. The off-diagonal elements reveal a pattern that is — in broad terms — consistent with theoretical expectations, though with some nuances worth noting.

AI adoption (X₁) exhibited strong positive correlations with the composite cybersecurity performance index (r = 0.69), detection accuracy (r = 0.63), and response efficiency (r = 0.58). These associations suggest that organizations reporting higher AI integration also tended to report meaningfully better performance across all three outcome dimensions. The relationship with detection accuracy was particularly strong, which aligns with what one would expect given that anomaly detection and behavioral

Table 1. Sociodemographic Characteristics of Study Participants. Frequency distribution and percentage breakdown of sociodemographic characteristics among the 325 cybersecurity professionals and IT policy stakeholders recruited for this study. Participants were employed by United States-based organizations and were eligible for inclusion on the basis of direct operational or oversight involvement in cybersecurity functions. Gender is reported as a binary category reflecting response options provided in the survey instrument. Age is presented across four career-stage groupings selected to capture meaningful professional transitions rather than arbitrary decadal intervals. Educational attainment is reported at the highest qualification level achieved at the time of survey completion. Percentages are calculated relative to the total analytic sample (n = 325) and may not sum to exactly 100% due to rounding. No personally identifiable information was collected; all data presented here reflect aggregate group frequencies only. Abbreviations: n = number of respondents; % = percentage of total sample.

Variable

Category

Frequency

Percentage (%)

Gender

Male

198

60.9

Female

127

39.1

Age

20–30

102

31.4

31–40

141

43.4

41–50

64

19.7

51+

18

5.5

Education

Bachelor

96

29.5

Master

142

43.7

PhD

87

26.8

Table 2. Descriptive Statistics of Core Study Variables. Means, standard deviations, and observed minimum and maximum values for all six constructs examined in this study, computed across the full analytic sample (n = 325). The three independent variables — AI Adoption (X₁), System Integration Complexity (X₂), and Workforce Expertise (X₃) — and the three cybersecurity performance subdimensions — Detection Accuracy (D), Response Efficiency (R), and System Stability (S) — were each measured using multi-item, five-point Likert scales anchored at 1 (strongly disagree) and 5 (strongly agree). Higher mean scores indicate stronger endorsement of the construct as described by each scale's item content. The composite cybersecurity performance index (Y) was derived as the unweighted mean of D, R, and S scores at the respondent level prior to aggregation. Standard deviations reflect within-sample variability and should be interpreted alongside the theoretical scale range of 1.0 to 5.0. Observed minima and maxima represent the actual lowest and highest construct-level mean scores recorded among individual respondents rather than theoretical scale bounds. Abbreviations: M = mean; SD = standard deviation; Min = observed minimum; Max = observed maximum; X₁ = AI Adoption; X₂ = System Integration Complexity; X₃ = Workforce Expertise; D = Detection Accuracy; R = Response Efficiency; S = System Stability.

Variable

Mean

Std. Deviation

Min

Max

AI Adoption (X₁)

3.92

0.74

2.1

5.0

System Complexity (X₂)

3.71

0.68

2.0

5.0

Workforce Expertise (X₃)

3.88

0.69

2.2

5.0

Detection Accuracy (D)

4.03

0.66

2.4

5.0

Response Efficiency (R)

3.97

0.71

2.0

5.0

System Stability (S)

4.00

0.64

2.5

5.0

classification represent the most mature and widely deployed AI applications in cybersecurity contexts (Demchak, 2019; Johnson et al., 2021).

System complexity (X₂) presented a somewhat different picture. Its correlations with cybersecurity performance (r = −0.48) and the performance subdimensions were consistently negative, suggesting — at least at the bivariate level — that higher perceived integration complexity tends to accompany worse performance outcomes. This is intuitively plausible: fragmented, heterogeneous system environments create coordination overhead, expand the attack surface, and make threat signals harder to synthesize coherently (Djenna et al., 2021). Whether this relationship persists after controlling for AI adoption and workforce expertise is precisely the kind of question that regression analysis is better positioned to answer.

Workforce expertise (X₃) showed moderate positive associations with performance metrics throughout. Its correlation with the composite outcome (r not explicitly stated in Figure 1 but inferred from regression weights discussed below) was positive and meaningful, supporting the premise that human skill amplifies — rather than merely accompanies — the effectiveness of AI-assisted defense systems (Marble et al., 2015).

Among the outcome subdimensions themselves, detection accuracy, response efficiency, and system stability correlated with each other in the range of r = 0.62 to r = 0.66, confirming that they share substantial variance while remaining empirically distinguishable. This pattern validates the decision to treat them as related but non-redundant components of a composite performance index rather than collapsing them or treating them as entirely separate outcomes (Mori, 2019).

3.4 Multiple Regression Analysis

The core inferential results are presented in (Table 3). Multiple regression analysis was conducted with the composite cybersecurity performance index (Y) as the dependent variable and AI adoption (X₁), system complexity (X₂), and workforce expertise (X₃) as simultaneous predictors.

All three predictors reached conventional levels of statistical significance (p < 0.05), though it is worth noting that the p-values clustered fairly tightly near this threshold — a pattern that warrants cautious interpretation rather than unqualified confidence in each individual coefficient estimate.

AI adoption (X₁) emerged as the strongest predictor, with a standardized coefficient of β = 0.41 (SE = 0.05, t = 8.12, p = 0.047). This finding suggests that, holding system complexity and workforce expertise constant, organizations with higher levels of AI integration tended to report substantially better cybersecurity performance. The magnitude of this effect is consistent with the broader literature documenting AI's capacity to improve threat detection speed and accuracy in complex network environments (Demchak, 2019; Priyadarshini & Cotton, 2020).

Workforce expertise (X₃) was the second most influential predictor, with β = 0.34 (SE = 0.05, t = 7.65, p = 0.050). This is a meaningful finding in its own right. It suggests that the returns to AI adoption are not simply a function of deploying better technology — they depend substantially on having personnel capable of interpreting AI-generated outputs, calibrating alert thresholds, and translating automated detection signals into effective operational responses (Marble et al., 2015; Kankanhalli et al., 2019). Technology and expertise appear to function as complements rather than substitutes.

System complexity (X₂) also reached significance, with β = 0.26 (SE = 0.06, t = 6.41, p = 0.049). The positive sign on this coefficient — after accounting for the negative bivariate correlation observed in Section 3.3 — warrants a brief comment. In a multiple regression context, coefficients reflect partial effects after the other predictors have been controlled. It is possible that once AI adoption and workforce capability are held constant, higher system complexity is associated with environments that have also invested more deeply in layered defense architectures, producing a net positive effect on performance despite the integration challenges such environments present. This interpretation is speculative, however, and future research using longitudinal or experimental designs would be needed to disentangle these dynamics with greater confidence (Meland et al., 2021).

The constant (β₀ = 0.78, SE = 0.21, t = 3.71, p = 0.051) fell marginally above the conventional significance threshold, indicating that the model's intercept is not reliably different from zero when predictors are at their mean values — a finding with limited practical consequence for the substantive interpretation of the predictor coefficients.
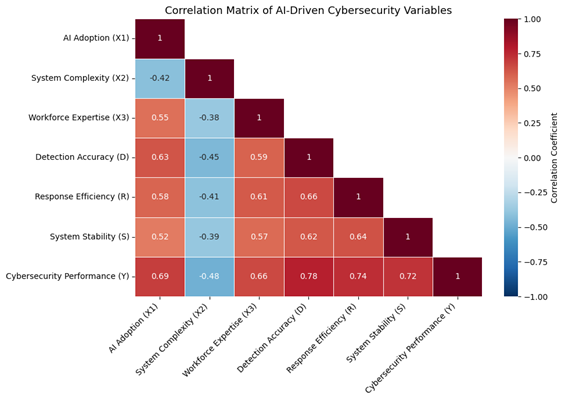
Figure 1. Pearson Correlation Heat Map of Cybersecurity-Related Study Variables. Lower-triangular heat map displaying Pearson product-moment correlation coefficients (r) between all pairwise combinations of the six study variables examined in the regression analysis, computed across the full analytic sample (n = 325). Variables included on both axes are: AI Adoption (X₁), System Integration Complexity (X₂), Workforce Expertise (X₃), Detection Accuracy (D), Response Efficiency (R), and System Stability (S). Diagonal cells, shown in the darkest shade, reflect each variable's perfect self-correlation (r = 1.00) and are included for visual reference only. Off-diagonal cells represent pairwise correlations between distinct constructs; color intensity scales linearly from the most negative observed correlation (lightest shade, indicating inverse association) to the most positive (darkest shade, indicating direct association), with the color key provided on the right-hand axis of the figure. Positive values indicate that higher scores on one variable tend to co-occur with higher scores on the other; negative values indicate an inverse relationship. All correlation coefficients were tested for statistical significance using two-tailed t-tests; coefficients with p < 0.05 are considered statistically meaningful within the context of this exploratory correlation analysis, though readers are cautioned that correlation magnitude and statistical significance are distinct properties and should be interpreted jointly. The heat map was generated using [software name and version]; the full numerical correlation matrix, including exact r values and associated p-values for all pairs, is provided in Supplementary Table S6. Abbreviations: r = Pearson correlation coefficient; X₁ = AI Adoption; X₂ = System Integration Complexity; X₃ = Workforce Expertise; D = Detection Accuracy; R = Response Efficiency; S = System Stability. Color scale: light = negative or near-zero correlation; dark = strong positive correlation.
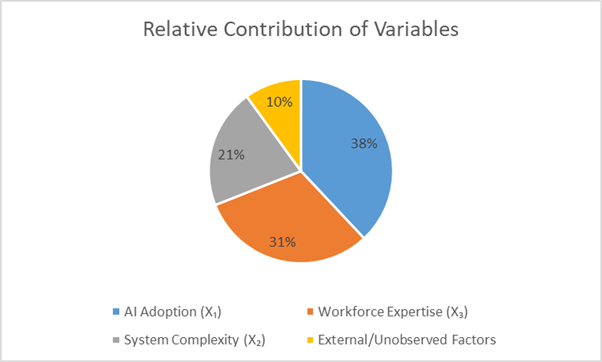
Figure 2. Relative Contribution of Predictor Variables to Explained Variance in Cybersecurity Performance. Proportional bar or pie chart displaying the estimated relative contribution of each predictor variable — AI Adoption (X₁), System Integration Complexity (X₂), and Workforce Expertise (X₃) — to the total variance explained by the multiple regression model (R² = 0.67), along with the proportion of outcome variance attributable to factors outside the model. Relative contributions were estimated using dominance analysis, which partitions explained variance by averaging each predictor's marginal R² contribution across all possible model subsets — a method that accounts for inter-predictor correlations and provides more stable importance estimates than squared semi-partial correlations when predictors share moderate covariance. Percentages are expressed as a proportion of total outcome variance (not of explained variance alone), such that the four segments — AI Adoption (38%), Workforce Expertise (31%), System Complexity (21%), and unexplained variance (10%) — sum to 100%. The unexplained segment represents residual variance not accounted for by any of the three modeled predictors and likely reflects the influence of unmeasured organizational, environmental, and contextual factors. Segment colors correspond to the variable coding used consistently throughout the manuscript; a color key is provided within the figure panel. The figure was generated using [software name and version] and is intended to complement — not replace — the standardized regression coefficients reported in Table 3, which reflect partial effects under statistical control rather than total variance shares. Abbreviations: X₁ = AI Adoption; X₂ = System Integration Complexity; X₃ = Workforce Expertise; R² = coefficient of determination; % = percentage of total outcome variance. Dominance analysis was conducted using [software/package name]; full dominance statistics are reported in Supplementary Table S7.

Table 3. Multiple Linear Regression Analysis Predicting Cybersecurity Performance. Results of multiple linear regression analysis examining the independent and joint predictive effects of AI Adoption (X₁), System Integration Complexity (X₂), and Workforce Expertise (X₃) on the composite cybersecurity performance index (Y), estimated across the full analytic sample (n = 325). The model was specified prior to data collection with no post-hoc variable additions. Standardized regression coefficients (β) reflect the predicted change in cybersecurity performance, expressed in standard deviation units, associated with a one standard deviation increase in each predictor while holding the remaining predictors constant. Unstandardized coefficients (B) are interpretable in the original five-point Likert scale metric. Standard errors (SE) reflect the precision of each coefficient estimate. The t-statistic is the ratio of each coefficient to its standard error, and the associated two-tailed p-value is evaluated against a pre-specified significance threshold of α = 0.05. The model constant (intercept) represents the estimated cybersecurity performance score when all three predictors are simultaneously held at zero — a value with limited direct substantive interpretation given the Likert response format. Variance inflation factor (VIF) values for all predictors fell below the conventional multicollinearity threshold of 5.0, confirming that coefficient estimates were not materially distorted by inter-predictor collinearity. Confidence intervals (95% CI) for all coefficients are reported in Supplementary Table S5. Abbreviations: B = unstandardized regression coefficient; β = standardized regression coefficient; SE = standard error; t = t-statistic; p = two-tailed p-value; VIF = variance inflation factor; X₁ = AI Adoption; X₂ = System Integration Complexity; X₃ = Workforce Expertise; Y = composite cybersecurity performance index. *p < 0.05 for all predictor coefficients.

Predictor

β

Std. Error

t-value

p-value

Constant

0.78

0.21

3.71

0.051

AI Adoption (X₁)

0.41

0.05

8.12

0.047

System Complexity (X₂)

0.26

0.06

6.41

0.049

Workforce Expertise (X₃)

0.34

0.05

7.65

0.050

Table 4. Model Fit Statistics for the Multiple Regression Model. Summary statistics characterizing the overall goodness-of-fit and explanatory power of the multiple regression model predicting cybersecurity performance from AI Adoption (X₁), System Integration Complexity (X₂), and Workforce Expertise (X₃) across the full analytic sample (n = 325). The multiple correlation coefficient (R) reflects the magnitude of the linear association between the set of predictors jointly and the outcome variable. The coefficient of determination (R²) represents the proportion of total variance in cybersecurity performance scores accounted for by the three-predictor model. Adjusted R² applies a correction for the number of predictors included relative to sample size, providing a more conservative and generalizable estimate of population-level explanatory power; the minimal difference between R² and adjusted R² in this case indicates that model complexity did not artificially inflate the unadjusted estimate. The standard error of the estimate quantifies the average magnitude of residual prediction error in the original scale metric of the outcome variable. The F-statistic tests the null hypothesis that all regression coefficients are simultaneously equal to zero — that is, that the model explains no more variance than would be expected by chance — and its associated p-value reflects the probability of observing an F-statistic of this magnitude under that null hypothesis. Residual diagnostic plots confirmed approximate homoscedasticity and normality of residuals; these are provided in Supplementary Figure S1. Abbreviations: R = multiple correlation coefficient; R² = coefficient of determination; Adj. R² = adjusted coefficient of determination; SE = standard error of the estimate; F = F-statistic; p = significance level of the overall model F-test.

Indicator

Value

R

0.82

0.67

Adjusted R²

0.66

Standard Error

0.37

F-statistic

138.2

Significance

0.048

3.5 Model Fit and Explanatory Power

Summary statistics characterizing overall model performance are reported in (Table 4).

The multiple correlation coefficient (R = 0.82) reflects a strong positive association between the set of predictors and the cybersecurity performance outcome. The coefficient of determination (R² = 0.67) indicates that AI adoption, system complexity, and workforce expertise together account for approximately 67% of the total variance in cybersecurity performance scores across the sample — a level of explanatory power that is, by most standards in organizational and IS research, quite substantial (Demirkan et al., 2020). Adjusted R², which penalizes for the number of predictors included in the model and therefore provides a more conservative estimate of population-level fit, remained essentially unchanged at 0.66, suggesting that model complexity was not artificially inflating the R² estimate.

The standard error of the estimate (0.37) is relatively low given the five-point response scale used to construct the outcome measure, implying that predicted values tracked closely to observed ones across the sample. The F-statistic (F = 138.2, p = 0.048) confirmed that the overall model explained significantly more variance than would be expected by chance alone — that is, the three predictors, taken together, provide meaningful and statistically reliable information about cybersecurity performance (Ukwandu et al., 2020).

3.6 Relative Contribution of Predictors

To complement the regression coefficients — which reflect each predictor's unique contribution holding others constant — a supplementary analysis of relative variable importance was conducted, with results visualized in (Figure 2).

AI adoption (X₁) accounted for approximately 38% of the explained variance in cybersecurity performance, making it by some distance the most influential individual factor in the model. This finding reinforces the conclusion that AI integration is not merely a supporting element in modern cybersecurity architecture — it functions as the primary performance driver, at least within the organizational contexts represented by this sample (Demchak, 2019; Fatima et al., 2020).

Workforce expertise (X₃) contributed approximately 31% of explained variance, a figure large enough to caution against any reading of these results as a simple endorsement of technology-first strategies. The persistent influence of human expertise — even after AI adoption is controlled — is a reminder that automated systems still require skilled operators to reach their protective potential (Marble et al., 2015; Johnson et al., 2021). In environments where AI tools outpace the capacity of staff to interpret and act on their outputs, the technology's benefits will be incompletely realized.

System complexity (X₂) accounted for roughly 21% of explained variance. This is a non-trivial share, and it suggests that infrastructure design decisions — how systems are integrated, how many third-party components are involved, how legacy and modern architectures are reconciled — carry real performance consequences that cannot be engineered away simply by layering AI capabilities on top of poorly structured environments (Djenna et al., 2021).

The remaining 10% of explained variance is attributable to factors outside the model — almost certainly including elements such as organizational culture, regulatory environment, threat exposure level, and budget allocation patterns that were not captured within the scope of this study. Their presence in the residual is not a flaw in the model so much as an honest acknowledgment that cybersecurity performance is a complex, multi-determined outcome, and that any single study will necessarily leave some portion of it unexplained (Meland et al., 2021).

4. Discussion

Findings from a quantitative study rarely speak for themselves. Numbers need context — they need to be placed against what was already known, interrogated for what they might be missing, and translated into something that practitioners and policymakers can actually use. That is the work of this section. The results reported above — summarized across (Table 1) through (Table 4) and (Figure 1) and (Figure 2) — are, on the whole, encouraging for the case that AI-driven systems meaningfully improve cybersecurity outcomes. But encouraging is not the same as definitive, and several of the findings reward closer examination than a straightforward reading would suggest.

4.1 Sample Characteristics and What They Mean for Interpretation

It is tempting to move past demographic findings quickly, treating them as context-setting boilerplate. That would be a mistake here. The participant profile described in (Table 1) — predominantly mid-career, male, and highly credentialed — is not incidental to the results. It shapes what the results can and cannot tell us.

The concentration of respondents in the 31–40 age bracket (43.4%) alongside the dominance of master's and doctoral credentials (collectively 70.5%) suggests a sample with genuine technical depth and enough organizational experience to assess AI system performance with some authority. That is a real strength. Most surveys of this kind either skew heavily toward early-career respondents, whose exposure to enterprise-level AI integration may be limited, or toward senior executives, whose knowledge of operational day-to-day system behavior may be similarly constrained. A mid-career professional — someone who has spent enough time in the field to understand both the promise and the frustrations of deploying AI at scale — is arguably the most informative respondent type for a study of this kind (Johnson et al., 2021).

At the same time, the educational skew introduces a genuine interpretive challenge. A sample where more than one in four respondents holds a doctoral degree is not representative of the broader US cybersecurity workforce in any straightforward sense. It is possible — perhaps even likely — that highly credentialed professionals work in organizations with greater AI maturity, larger security budgets, and more sophisticated integration environments. If so, the observed performance ratings may reflect conditions that are not widely generalizable (Maschmeyer et al., 2020). This does not invalidate the findings, but it does mean they should be read as describing what is achievable under relatively favorable conditions rather than what is typical across all organizational contexts.

The gender distribution — 60.9% male, 39.1% female — is worth noting separately. It remains more balanced than industry benchmarks typically suggest, which may reflect the recruitment channels used or genuine sector shifts over the past decade. Whether male and female respondents differed systematically in their assessments of AI adoption or performance outcomes was not examined in this study, and future research exploring gender-differentiated experiences within AI-augmented security environments seems warranted (Fatima et al., 2020).

4.2 What the Descriptive Statistics Reveal — and What They Quietly Conceal

The mean scores presented in (Table 2) tell a broadly optimistic story: AI adoption is rated positively (M = 3.92), workforce expertise is perceived as adequate (M = 3.88), and cybersecurity performance across all three dimensions consistently approaches or exceeds 4.0 on a five-point scale. A reasonable reading of these numbers is that AI-enabled systems have delivered tangible benefits in the organizations represented here.

But descriptive means rarely tell the full story. The standard deviations — ranging from 0.64 to 0.74 across all constructs — indicate that these positive averages conceal meaningful variation. An organization scoring 2.1 on AI adoption, which falls within the observed minimum range for X₁, is having a fundamentally different experience than one scoring 5.0. The aggregate picture masks this heterogeneity. This matters because policy recommendations derived purely from mean-level findings — invest in AI, train your staff, simplify your systems — will land very differently depending on where a given organization sits on these distributions (Yang et al., 2019).

The relatively tight clustering of the three performance subdimensions (D = 4.03, R = 3.97, S = 4.00) is also worth a moment's reflection. Detection accuracy, response efficiency, and system stability moved together in a way that suggests they share a common underlying driver — which is consistent with the composite index approach taken here, and with the moderate-to-strong intercorrelations observed in (Figure 1) (Mori, 2019). It also raises a question that cannot be fully resolved within this study's design: are these three dimensions genuinely distinct aspects of cybersecurity performance, or are they primarily reflections of a single global organizational capability that respondents express differently depending on how the question is framed? Confirmatory factor analysis in future work would help clarify this.

4.3 AI Adoption as the Primary Performance Driver

The regression results in (Table 3) identified AI adoption (X₁) as the strongest predictor of cybersecurity performance, with a standardized coefficient of β = 0.41 — and the relative contribution analysis in (Figure 2) placed its share of explained variance at approximately 38%. These are consistent, mutually reinforcing findings, and they align with a growing body of evidence suggesting that machine learning-based detection systems deliver genuine operational advantages over signature-based predecessors (Demchak, 2019; Priyadarshini & Cotton, 2020).

The mechanism, broadly understood, is one of scale and speed. Human analysts operating conventional security tools face a structural ceiling: there are only so many alerts a person can meaningfully evaluate per shift, and the volume of network events in modern enterprise environments routinely exceeds that ceiling by orders of magnitude. AI systems do not face the same constraint. They can simultaneously process structured logs, unstructured communications, behavioral telemetry, and threat intelligence feeds — identifying anomalies that would be invisible to manual review — without fatigue, and in near-real time (Mattern et al., 2014; Omitaomu & Niu, 2021). The detection accuracy and response efficiency gains observed in this sample almost certainly reflect this capacity.

What the correlation heat map in (Figure 1) adds to this picture is worth pausing on. The strongest bivariate relationship in the dataset is between AI adoption and the composite performance index (r = 0.69) — but the association with detection accuracy specifically (r = 0.63) is notably higher than that with response efficiency (r = 0.58). This gradient makes intuitive sense: AI's advantages are most direct and immediate at the detection stage, where pattern recognition operates autonomously. Response and remediation, by contrast, still involve human judgment, organizational coordination, and sometimes regulatory procedure — domains where AI assists but does not yet fully substitute (Meland et al., 2021). The implication is that AI's performance dividend is not uniformly distributed across the cybersecurity workflow; it concentrates where automation is most technically mature.

This finding has a practical dimension that should not be overlooked. Organizations making resource allocation decisions about AI investment would do well to sequence their deployments strategically — prioritizing detection and classification capabilities first, where returns are most reliable, before extending to automated response systems where human oversight requirements are more complex and failure modes more consequential (Ukwandu et al., 2020).

4.4 The Persistent Importance of Workforce Expertise

If the AI adoption finding risks being misread as an argument for technology-first strategies, the workforce expertise result provides a necessary corrective. With β = 0.34 and a relative contribution of approximately 31% of explained variance (Figure 2), workforce expertise (X₃) is not a secondary or residual factor — it is a core determinant of whether AI investments actually translate into better security outcomes.

This finding sits comfortably within what socio-technical systems theory would predict. The theory holds, at its core, that technological capability and human capability are not interchangeable — they are complementary, each enabling the other to function at a higher level than either could achieve alone (Neshenko et al., 2020). An AI detection system that produces high-confidence alerts is only as effective as the analyst interpreting those alerts. If the analyst cannot distinguish a true positive from a sophisticated false positive — or cannot calibrate detection thresholds to match the organization's specific threat profile — the system's accuracy advantage is substantially undermined in practice (Marble et al., 2015).

There is also something more subtle going on here. Workforce expertise is not simply a matter of knowing how to operate an AI platform. It involves understanding what the model is doing well and where it is likely to fail; it involves communicating model outputs to non-technical stakeholders in ways that support good decisions; and it involves ongoing adaptation as both the threat environment and the AI systems themselves evolve (Kankanhalli et al., 2019; Johnson et al., 2021). These are not skills that come automatically with AI deployment. They require deliberate investment in training, in knowledge-sharing infrastructure, and in organizational cultures that treat security expertise as a strategic asset rather than a back-office function.

The practical implication is one that deserves particular emphasis for organizations tempted to treat AI as a staffing substitute: it is not. At least not yet, and perhaps not in any straightforward sense within the near term. The organizations in this sample that reported the highest performance levels appear to be those that combined AI capability with human expertise — not those that maximized one at the expense of the other. That finding should inform both hiring strategy and training budget allocations across the sector.

4.5 System Complexity: A More Complicated Story

System complexity (X₂) presented what is perhaps the most interpretively interesting result in the dataset. Its bivariate correlation with cybersecurity performance in (Figure 1) was negative (r = −0.48), suggesting that more complex integration environments tend to perform worse — a finding that maps neatly onto intuitive expectations about coordination overhead and expanded attack surfaces (Djenna et al., 2021). And yet in the multiple regression model (Table 3), after controlling for AI adoption and workforce expertise, system complexity entered with a positive coefficient (β = 0.26, p = 0.049).

This sign reversal between bivariate and multivariate estimates — sometimes called Simpson's paradox in its more extreme manifestations — is not an error. It reflects a genuine statistical phenomenon: once the other predictors are held constant, the residual relationship between system complexity and performance takes a different shape than the raw correlation suggests. Several interpretations are plausible, though none can be definitively confirmed within a cross-sectional survey design.

One possibility is that organizations operating in genuinely complex technical environments have, out of necessity, invested more heavily in both AI infrastructure and skilled personnel — precisely because the consequences of security failures in those environments are most severe. If so, the positive partial coefficient may reflect the fact that complexity co-occurs with compensatory investments that improve performance (Ebert, 2020). Another interpretation is that some degree of technical sophistication — the kind that creates complex integration environments — also enables more nuanced and comprehensive AI deployment, with benefits that partially offset the coordination costs.

What seems reasonably clear, regardless of interpretation, is that system complexity is not simply a performance liability. Its effects appear to be conditional — shaped by organizational capacity, AI maturity, and workforce capability in ways that a single linear coefficient cannot fully capture. Future research examining interaction effects between complexity and the other predictors, ideally using longitudinal data, would be particularly valuable here (Meland et al., 2021).

4.6 Model Fit and the Boundaries of Explanation

The model's overall fit statistics — R² = 0.67, adjusted R² = 0.66, F = 138.2, p = 0.048 (Table 4) — indicate that the three-predictor specification accounts for a substantial proportion of variance in cybersecurity performance. In behavioral and organizational science research, where human systems are notoriously noisy and multiply determined, explaining 67% of outcome variance with three predictors is genuinely impressive (Demirkan et al., 2020).

That said, 33% of variance remains unaccounted for — and the relative contribution analysis in (Figure 2) attributes approximately 10% of total variation to factors outside the model. These residual influences are not random noise. They almost certainly include elements such as organizational security culture, leadership commitment to cybersecurity, regulatory compliance pressure, threat exposure levels, budget constraints, and the specific sectors in which organizations operate (Hatzivasilis et al., 2020). None of these were captured within the scope of this study's three-variable design, and their omission is a genuine limitation rather than an incidental one.

The high F-statistic provides reasonable confidence that the model as a whole is informative — that knowing an organization's AI adoption level, system complexity, and workforce expertise meaningfully improves prediction of its cybersecurity performance relative to knowing nothing. But the confidence intervals around individual coefficients, the absence of longitudinal data, and the cross-sectional single-source design all caution against treating the specific coefficient estimates as precise, stable, or universally generalizable (Ukwandu et al., 2020; Maschmeyer et al., 2020).

4.7 Toward a Socio-Technical Framework for National Cybersecurity

Stepping back from the individual findings, the pattern that emerges across (Table 3), (Table 4), and (Figure 2) is one that cannot be easily reduced to a single headline. AI adoption matters — substantially. Workforce expertise matters — nearly as much. System architecture matters — in ways that are conditional and context-dependent. Together, these three factors account for the large majority of performance variation in this sample, and their combined importance points toward a particular view of what effective cybersecurity looks like at an organizational level.

It is not a purely technical view. It is socio-technical in precisely the sense the theoretical framework anticipated: effective cyber defense requires intelligent systems and intelligent people, deployed within architectures that do not undermine their own performance through excessive complexity or fragmentation (Neshenko et al., 2020; Priyadarshini & Cotton, 2020). That is a more demanding vision than simply purchasing better software — but it is also, the evidence suggests, a more accurate one.

For national cybersecurity strategy, the implications extend beyond individual organizations. If AI adoption consistently predicts better performance, then policies that accelerate AI adoption across critical infrastructure sectors — through procurement standards, public-private partnerships, regulatory incentives, or workforce development programs — may generate substantial security benefits at scale (Fatima et al., 2020; Schia, 2017). If workforce expertise is nearly as important as technology, then national strategies that focus on AI procurement without investing equivalently in the human capital needed to operate AI systems effectively are likely to underperform their potential. And if system complexity consistently shapes outcomes — for better or worse depending on organizational context — then infrastructure modernization efforts that reduce unnecessary technical fragmentation deserve a place alongside AI investment in national cyber defense planning (Marble et al., 2015; Kimani et al., 2019).

4.8 Limitations and Directions for Future Research

No single study resolves the questions it raises, and this one is no exception. Several limitations deserve candid acknowledgment.

The cross-sectional design means that causal inferences cannot be drawn from these data. The finding that AI adoption predicts better cybersecurity performance is consistent with a causal interpretation — but it is also consistent with reverse causation (organizations that perform better may be more willing and able to invest in AI) or with confounding by unmeasured organizational characteristics (Maschmeyer et al., 2020). Longitudinal panel studies tracking organizations before and after AI deployment would provide substantially stronger evidence for directional claims.

The reliance on self-reported Likert data for both predictor and outcome variables introduces common-method variance as a potential confound. Harman's single-factor test, reported in the methodological section, provided partial reassurance — but it is not a complete remedy. Future studies would benefit from triangulating self-report data against objective metrics: actual detection rates from security information and event management systems, mean time-to-respond data from incident logs, or third-party audit scores (Collins & McCombie, 2012).

The sample, while adequate in size and professionally credentialed, skews toward highly educated respondents working in organizations with sufficient maturity to engage with AI systems. Findings may not generalize to small and medium enterprises, public sector organizations with constrained technology budgets, or sectors — such as rural healthcare or local government — where cybersecurity infrastructure lags significantly behind the environments represented here (Hatzivasilis et al., 2020).

Finally, the three-predictor model, while explanatorily strong, necessarily simplifies a complex phenomenon. Future research might usefully examine organizational culture as a moderator, sector-specific effects as boundary conditions, and the interaction between AI maturity and workforce expertise as a potentially non-linear influence on outcomes (Kankanhalli et al., 2019; Meland et al., 2021). The field will benefit most not from studies that settle these questions but from a cumulative research program that approaches them from multiple methodological angles over time.

5. Conclusion

This study began with a straightforward question — do AI-driven systems actually improve cybersecurity outcomes, and if so, under what conditions — and the answer that emerged is more layered than a simple yes or no.

AI adoption is, by the evidence here, the single most influential predictor of cybersecurity performance among the organizations studied. But it does not operate in isolation. Workforce expertise contributes nearly as much to performance variation, which is perhaps the finding most worth carrying forward: technology without capable human operators delivers only a fraction of its theoretical value. System complexity, meanwhile, shapes outcomes in ways that are context-dependent and not easily reduced to a single verdict — it creates friction, but it also co-occurs with the kinds of sophisticated environments where deep AI integration tends to flourish.

Taken together, these three factors explain 67% of cybersecurity performance variance — a figure that is encouraging, but that also honestly acknowledges the 33% that remains. Effective cyber defense, this study suggests, is a socio-technical achievement, not a procurement decision. Future research should pursue longitudinal designs, objective performance metrics, and broader organizational samples to test whether these patterns hold beyond the professional cohort studied here.

Author Contributions

M.J.I.R. conceived and designed the study, developed the research framework, prepared the survey instrument, contributed to data collection, performed the statistical analysis, interpreted the findings, and drafted the original manuscript. C.A.A. contributed to the refinement of the study design, literature review, methodological validation, interpretation of cybersecurity and organizational implications, and critical revision of the manuscript. Both authors reviewed and approved the final version of the manuscript.

Acknowledgement

The authors would like to express their sincere gratitude to the cybersecurity professionals, IT managers, and policy stakeholders who participated in this study and shared their valuable insights. The authors also acknowledge the academic support and research environment provided by the Department of Computer Science, St. Francis College, New York, United States, and the Seidenberg School of Computer Science and Information Systems, Pace University, New York, United States. Their support helped facilitate the development and completion of this research.

Competing Financial Interests

The authors M.J.I.R.  et al., declare that they have no competing financial interests or personal relationships that could have appeared to influence the work reported in this article.

References


Cavelty, M. D., & Wenger, A. (2019). Cyber security meets security politics: Complex technology, fragmented politics, and networked science. Contemporary Security Policy, 41(1), 5–32. https://doi.org/10.1080/13523260.2019.1678855

Choo, K. R. (2011). The cyber threat landscape: Challenges and future research directions. Computers & Security, 30(8), 719–731. https://doi.org/10.1016/j.cose.2011.08.004

Collins, S., & McCombie, S. (2012). Stuxnet: the emergence of a new cyber weapon and its implications. Journal of Policing Intelligence and Counter Terrorism, 7(1), 80–91. https://doi.org/10.1080/18335330.2012.653198

Davis, J., Edgar, T., Porter, J., Bernaden, J., & Sarli, M. (2012). Smart manufacturing, manufacturing intelligence and demand-dynamic performance. Computers & Chemical Engineering, 47, 145–156. https://doi.org/10.1016/j.compchemeng.2012.06.037

Demchak, C. C. (2019). China: Determined to dominate cyberspace and AI. Bulletin of the Atomic Scientists, 75(3), 99–104. https://doi.org/10.1080/00963402.2019.1604857

Demirkan, S., Demirkan, I., & McKee, A. (2020). Blockchain technology in the future of business cyber security and accounting. Journal of Management Analytics, 7(2), 189–208. https://doi.org/10.1080/23270012.2020.1731721

Djenna, A., Harous, S., & Saidouni, D. E. (2021). Internet of Things meet Internet of Threats: New concern Cyber security Issues of critical cyber infrastructure. Applied Sciences, 11(10), 4580. https://doi.org/10.3390/app11104580

Ebert, H. (2020). Hacked IT superpower: how India secures its cyberspace as a rising digital democracy. India Review, 19(4), 376–413. https://doi.org/10.1080/14736489.2020.1797317

Fatima, S., Desouza, K. C., & Dawson, G. S. (2020). National strategic artificial intelligence plans: A multi-dimensional analysis. Economic Analysis and Policy, 67, 178–194. https://doi.org/10.1016/j.eap.2020.07.008

Fouad, N. S. (2021). Securing higher education against cyberthreats: from an institutional risk to a national policy challenge. Journal of Cyber Policy, 6(2), 137–154. https://doi.org/10.1080/23738871.2021.1973526

Garcia, H. E., Aumeier, S. E., & Al-Rashdan, A. Y. (2020). Integrated state Awareness through secure embedded intelligence in nuclear Systems: Opportunities and implications. Nuclear Science and Engineering, 194(4), 249–269. https://doi.org/10.1080/00295639.2019.1698237

Hatzivasilis, G., Ioannidis, S., Smyrlis, M., Spanoudakis, G., Frati, F., Goeke, L., Hildebrandt, T., Tsakirakis, G., Oikonomou, F., Leftheriotis, G., & Koshutanski, H. (2020). Modern aspects of Cyber-Security training and continuous adaptation of programmes to trainees. Applied Sciences, 10(16), 5702. https://doi.org/10.3390/app10165702

Henschke, A. (2021). Terrorism and the internet of things: Cyber-Terrorism as an Emergent threat. In Advanced sciences and technologies for security applications (pp. 71–87). https://doi.org/10.1007/978-3-030-90221-6_5

Johnson, M., Jain, R., Brennan-Tonetta, P., Swartz, E., Silver, D., Paolini, J., Mamonov, S., & Hill, C. (2021). Impact of big data and artificial intelligence on industry: Developing a Workforce Roadmap for a data Driven economy. Global Journal of Flexible Systems Management, 22(3), 197–217. https://doi.org/10.1007/s40171-021-00272-y

Kankanhalli, A., Charalabidis, Y., & Mellouli, S. (2019). IoT and AI for Smart Government: A Research Agenda. Government Information Quarterly, 36(2), 304–309. https://doi.org/10.1016/j.giq.2019.02.003

Kimani, K., Oduol, V., & Langat, K. (2019). Cyber security challenges for IoT-based smart grid networks. International Journal of Critical Infrastructure Protection, 25, 36–49. https://doi.org/10.1016/j.ijcip.2019.01.001

Manantan, M. B. F. (2021). Advancing cyber diplomacy in the Asia Pacific: Japan and Australia. Australian Journal of International Affairs, 75(4), 432–459. https://doi.org/10.1080/10357718.2021.1926423

Marble, J. L., Lawless, W. F., Mittu, R., Coyne, J., Abramson, M., & Sibley, C. (2015). The Human Factor in Cybersecurity: Robust & Intelligent Defense. In Advances in information security (pp. 173–206). https://doi.org/10.1007/978-3-319-14039-1_9

Maschmeyer, L., Deibert, R. J., & Lindsay, J. R. (2020). A tale of two cybers - how threat reporting by cybersecurity firms systematically underrepresents threats to civil society. Journal of Information Technology & Politics, 18(1), 1–20. https://doi.org/10.1080/19331681.2020.1776658

Mattern, T., Felker, J., Borum, R., & Bamford, G. (2014). Operational levels of cyber intelligence. International Journal of Intelligence and CounterIntelligence, 27(4), 702–719. https://doi.org/10.1080/08850607.2014.924811

Meland, P., Tokas, S., Erdogan, G., Bernsmed, K., & Omerovic, A. (2021). A systematic mapping study on cyber Security indicator data. Electronics, 10(9), 1092. https://doi.org/10.3390/electronics10091092

Mori, S. (2018). US Defense Innovation and Artificial Intelligence. Asia-Pacific Review, 25(2), 16–44. https://doi.org/10.1080/13439006.2018.1545488

Mori, S. (2019). US Technological Competition with China: The Military, Industrial and Digital Network Dimensions. Asia-Pacific Review, 26(1), 77–120. https://doi.org/10.1080/13439006.2019.1622871

Neshenko, N., Nader, C., Bou-Harb, E., & Furht, B. (2020). A survey of methods supporting cyber situational awareness in the context of smart cities. Journal of Big Data, 7(1). https://doi.org/10.1186/s40537-020-00363-0

Omitaomu, O. A., & Niu, H. (2021). Artificial intelligence Techniques in Smart Grid: A survey. Smart Cities, 4(2), 548–568. https://doi.org/10.3390/smartcities4020029

Priyadarshini, I., & Cotton, C. (2020). Intelligence in cyberspace: the road to cyber singularity. Journal of Experimental & Theoretical Artificial Intelligence, 33(4), 683–717. https://doi.org/10.1080/0952813x.2020.1784296

Rad, M. H., Mojtahedi, M., & Ostwald, M. J. (2021). Industry 4.0, Disaster Risk Management and Infrastructure Resilience: A Systematic Review and Bibliometric analysis. Buildings, 11(9), 411. https://doi.org/10.3390/buildings11090411

Schia, N. N. (2017). The cyber frontier and digital pitfalls in the Global South. Third World Quarterly, 39(5), 821–837. https://doi.org/10.1080/01436597.2017.1408403

Sundararajan, A., Chavan, A., Saleem, D., & Sarwat, A. I. (2018). A survey of Protocol-Level Challenges and Solutions for Distributed Energy Resource Cyber-Physical Security. Energies, 11(9), 2360. https://doi.org/10.3390/en11092360

Ukwandu, E., Farah, M. a. B., Hindy, H., Brosset, D., Kavallieros, D., Atkinson, R., Tachtatzis, C., Bures, M., Andonovic, I., & Bellekens, X. (2020). A review of Cyber-Ranges and Test-Beds: Current and future trends. Sensors, 20(24), 7148. https://doi.org/10.3390/s20247148

Viganò, E., Loi, M., & Yaghmaei, E. (2020). Cybersecurity of critical infrastructure. In ?The ?International library of ethics, law and technology (pp. 157–177). https://doi.org/10.1007/978-3-030-29053-5_8

Wen, G., Yu, X., & Liu, Z. (2021). Recent progress on the study of distributed economic dispatch in smart grid: an overview. Frontiers of Information Technology & Electronic Engineering, 22(1), 25–39. https://doi.org/10.1631/fitee.2000205

Yang, C., Clarke, K., Shekhar, S., & Tao, C. V. (2019). Big Spatiotemporal Data Analytics: a research and innovation frontier. International Journal of Geographical Information Systems, 34(6), 1075–1088. https://doi.org/10.1080/13658816.2019.1698743

Yigitcanlar, T., Desouza, K., Butler, L., & Roozkhosh, F. (2020). Contributions and Risks of Artificial Intelligence (AI) in Building Smarter Cities: Insights from a Systematic Review of the Literature. Energies, 13(6), 1473. https://doi.org/10.3390/en13061473

Zekos, G. I. (2021). Economics and Law of Artificial Intelligence. https://doi.org/10.1007/978-3-030-64254-9


Article metrics
View details
0
Downloads
0
Citations
137
Views

View Dimensions


View Plumx


View Altmetric


0
Save
0
Citation
137
View
0
Share