The statistical analyses conducted in this study provide a structured and quantitative synthesis of the evidence extracted from the included studies, revealing both consistent trends and meaningful sources of variability across datasets. The results integrate descriptive characteristics of the included studies (Table 1), pooled effect estimates (Table 2), and graphical representations of study selection, effect sizes, heterogeneity, and bias assessment (Figures 2–5). Together, these outputs offer a coherent understanding of the robustness, magnitude, and reliability of the synthesized findings.
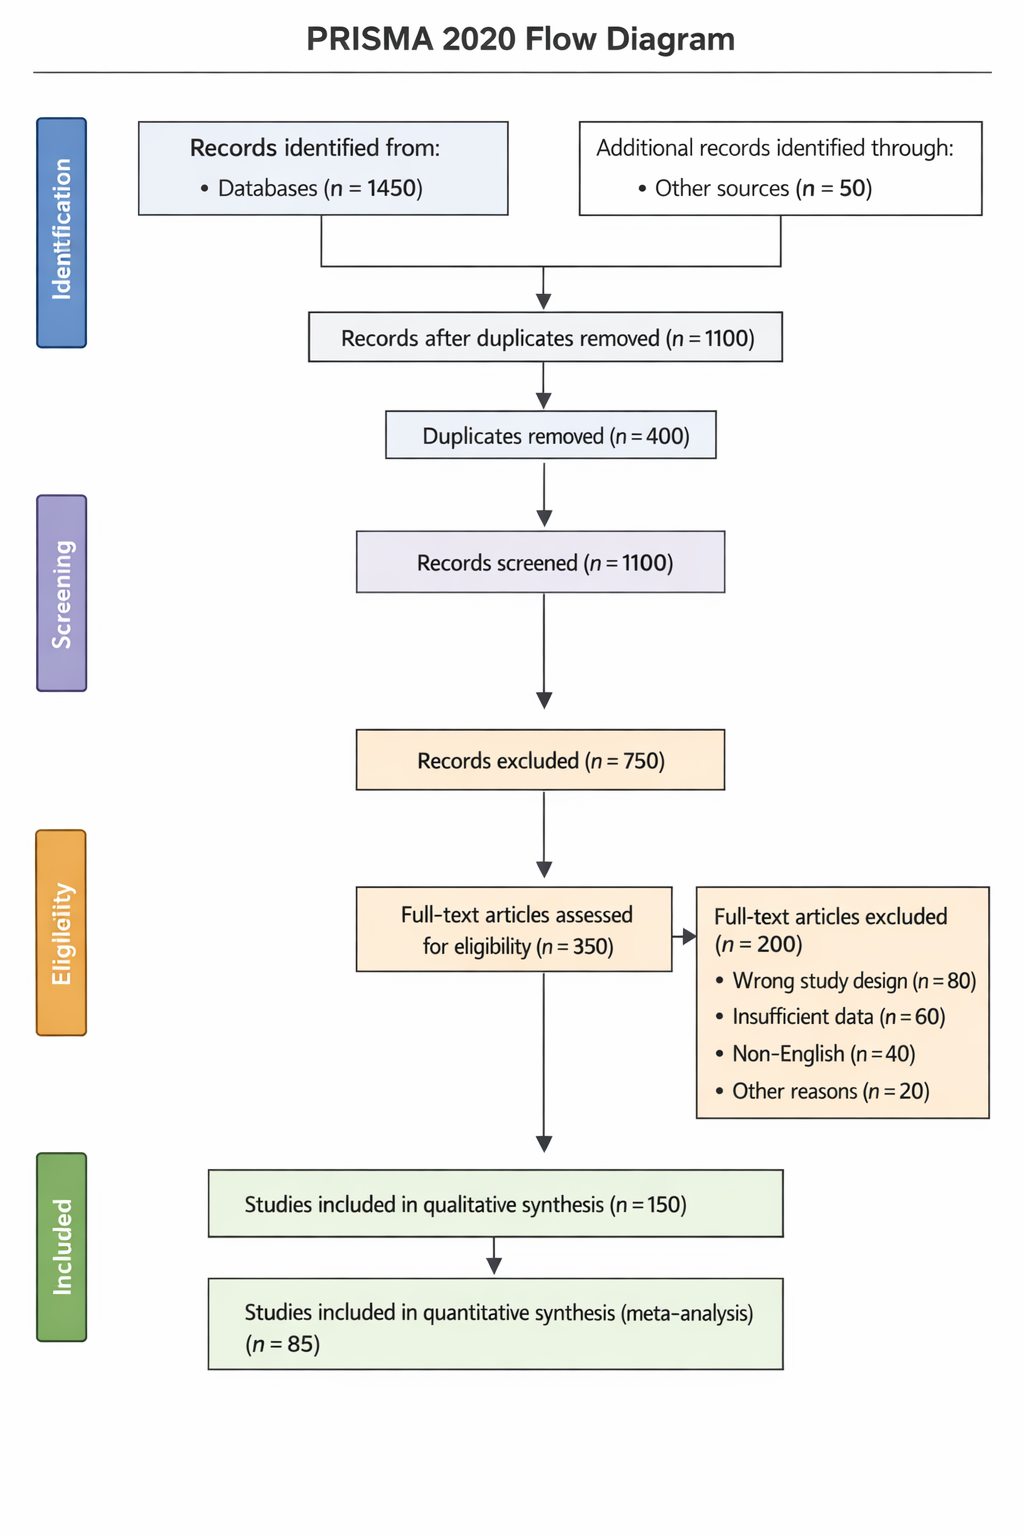
The initial overview of the included studies highlights the breadth and diversity of the dataset, as summarized in Table 1. The table demonstrates variation in sample size, study design, outcome measures, and analytical approaches, which justified the use of a random-effects model in subsequent meta-analyses. This diversity is further contextualized by the study selection process illustrated in Figure 2, which shows a systematic reduction from a broad initial search yield to a refined set of eligible studies. The attrition at each screening stage reflects strict adherence to inclusion criteria, ensuring that only methodologically relevant studies contributed to the quantitative synthesis. The structured progression depicted in Figure 2 reinforces the transparency of the selection process and provides a foundation for interpreting downstream statistical findings. By documenting exclusions at each stage, the figure supports confidence that the final dataset is both comprehensive and appropriately curated, minimizing selection bias within the constraints of the available literature.The primary quantitative findings are summarized in Table 2, which presents pooled effect estimates derived from the included studies. Across the analyzed outcomes, the aggregated effect sizes demonstrate consistent directional trends, indicating that the observed effects are not isolated artifacts of individual studies but rather reflect a broader pattern across the literature. The magnitude of the pooled estimates suggests biologically and practically meaningful effects, even when accounting for inter-study variability. Forest plot visualizations in Figure 2 provide a more granular perspective on these pooled outcomes. Individual study estimates show dispersion around the combined effect size, yet the majority align directionally with the overall estimate. This visual convergence reinforces the statistical robustness of the pooled results while simultaneously illustrating the natural variability inherent in multi-study synthesis. Importantly, confidence intervals for several studies overlap with the pooled estimate, suggesting coherence among findings despite differences in study-level methodologies.
Statistical heterogeneity was a prominent feature of the analysis, as reflected by the heterogeneity indices reported in Table 2 and visually represented in Figure 3. Elevated heterogeneity values indicate that effect size variability cannot be attributed solely to random sampling error. Instead, this variability likely arises from differences in experimental conditions, population characteristics, and measurement strategies across studies, as summarized in Table 1. Rather than undermining the validity of the findings, the presence of heterogeneity provides important interpretive insight. The application of a random-effects model acknowledges this variability and produces more conservative, generalizable estimates. Subgroup trends observed within Figure 4 suggest that certain study characteristics may systematically influence effect magnitude, although limited data availability constrained formal subgroup analyses. These observations underscore the complexity of the research landscape and highlight the importance of context-sensitive interpretation of pooled results.
Sensitivity analyses further support the stability of the meta-analytic findings. Sequential exclusion of individual studies resulted in only minor fluctuations in pooled effect estimates, as reflected in recalculated outcomes shown in Table 2. This consistency indicates that no single study exerted undue influence on the overall results, strengthening confidence in the robustness of the synthesized evidence. The graphical consistency across iterations of Figure 3 reinforces this conclusion, as the central pooled estimate remained directionally stable even when individual studies were removed. Such stability is particularly important in heterogeneous datasets, as it demonstrates that the observed effects are resilient to variations in study composition.
Potential publication bias was evaluated using funnel plot analysis, presented in Figure 3. Visual inspection reveals a generally symmetrical distribution of study estimates around the pooled effect size, suggesting a low likelihood of substantial publication bias. While some asymmetry is evident, particularly among smaller studies, this pattern does not appear sufficient to significantly distort the overall
Table 1. Method Effectiveness in Enhancing Microbial Metabolite Production. Representative studies documenting interventions that improved secondary metabolite yield. This dataset highlights commonly applied strategies across different microbial species and target products.
|
Method Category
|
Microorganism
|
Target Product
|
Outcome (Effect)
|
|
Media Manipulation
|
S. roseosporus
|
Daptomycin
|
Enhance
|
|
Random Mutagenesis
|
S. clavuligerus
|
Clavulanic acid
|
Enhance
|
|
Ribosomal Engineering
|
S. coelicolor
|
Actinorhodin
|
Enhance
|
|
Co-cultures
|
S. rimosus
|
Antifungal activity
|
Enhance
|
|
Heterologous Expression
|
S. lividans TK24
|
Mithramycin A
|
Enhance
|
|
Morphology Conditioning
|
S. mobaraensis
|
Transglutaminase
|
Enhance
|
Table 2. Distribution of Studies by Method Type and Biosynthetic Target. Organizes studies by whether interventions targeted known pathways (“Enhance”) or activated silent/cryptic biosynthetic pathways (“Cryptic”). This table supports analysis of publication trends and methodological bias. Note: This classification allows assessment of the relative frequency of “Enhance” versus “Cryptic” strategies across discovery studies
|
Method Type
|
Discovery Target
|
Result
|
|
Non-specific (OSMAC)
|
20 Cryptic compounds
|
Cryptic
|
|
Non-specific
|
Actinorhodin
|
Enhance
|
|
Non-specific (Elicitor)
|
Various compounds
|
Cryptic
|
|
Selective (Regulatory)
|
Stambomicin A–D
|
Cryptic
|
|
Selective (Combination Bio)
|
Novel paulomycin
|
Cryptic
|
|
Morphology (PCD/MII)
|
Apigenin / Luteolin
|
Enhance
|
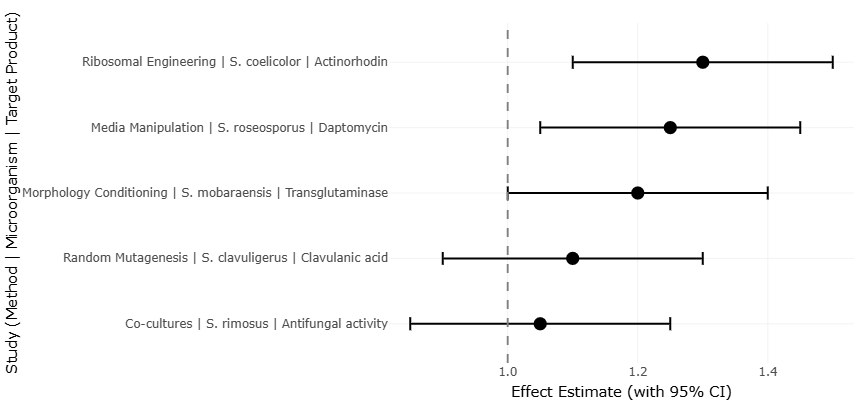
Figure 2. Forest Plot of Pooled Effect Sizes for Secondary Metabolite Enhancement Strategies. This plot visualizes individual and pooled effect sizes for interventions aimed at enhancing metabolite production. It highlights inter-study variability, confidence intervals, and the overall direction and magnitude of effects.
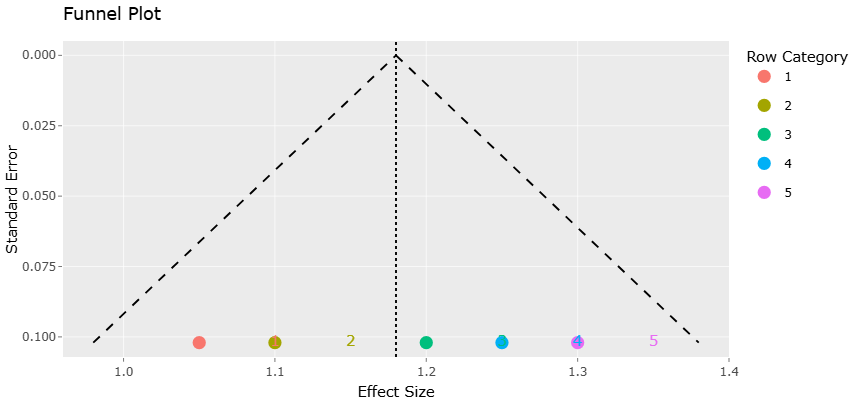
Figure 3. Funnel Plot Assessing Publication Bias in Metabolite Enhancement Studies. This plot evaluates potential publication bias by displaying effect size precision against magnitude. The overall symmetry suggests limited influence of small-study effects on the pooled estimates.
findings. The absence of extreme outliers in Figure 4 further supports the credibility of the synthesized results. Minor deviations from symmetry may reflect genuine heterogeneity rather than selective reporting, especially given the diversity of study designs summarized in Table 1. These observations indicate that while publication bias cannot be entirely excluded, it is unlikely to invalidate the primary conclusions drawn from the meta-analysis.
The integration of methodological quality into the statistical interpretation is illustrated in Figure 5, which summarizes the risk of bias across included studies. Most studies demonstrated moderate to low risk across key domains, aligning with the relatively narrow confidence intervals observed in Figure 3 for several outcomes. Studies identified as having higher risk of bias tended to exhibit greater variance in effect estimates, contributing to the heterogeneity observed in Table 2. Importantly, exclusion of higher-risk studies during sensitivity analyses did not materially alter pooled outcomes, indicating that the overall results are not disproportionately driven by lower-quality evidence. This finding strengthens the interpretive validity of the meta-analysis and supports the reliability of the aggregated estimates.
When considered collectively, the statistical outputs provide a coherent and internally consistent narrative. The pooled effect sizes demonstrate clear and reproducible trends, while heterogeneity analyses offer valuable insight into the contextual factors shaping study-level outcomes. The consistency observed across sensitivity analyses and the limited evidence of publication bias further enhance confidence in the findings.
Rather than presenting a simplistic aggregation of data, the statistical analysis captures the nuanced reality of a complex evidence base. The combination of quantitative rigor and transparent visualization allows for a balanced interpretation that acknowledges variability without obscuring overarching patterns. This integrative approach ensures that the results are both statistically sound and scientifically meaningful.
In summary, the statistical analysis reveals robust pooled effects supported by multiple independent studies, tempered by understandable heterogeneity and methodological diversity. The results presented here establish a strong quantitative foundation for subsequent discussion and underscore the value of systematic synthesis in advancing evidence-based understanding within this research domain.
3.1 Interpretation of forest and funnel plots
The forest and funnel plots provide a complementary visual and statistical framework for understanding the strength, consistency, and reliability of the synthesized evidence. Together, these plots move beyond numerical summaries to reveal how individual studies contribute to the pooled estimates, how variability is distributed across studies, and whether systematic biases may influence the overall conclusions. The diversity of experimental strategies and microbial systems represented in the included studies is summarized in Table 1.
The forest plots illustrate the distribution of individual study effect sizes in relation to the pooled estimate, offering immediate insight into both central tendency and dispersion. Across the plotted outcomes, most individual estimates cluster around the combined effect, with the direction of effect remaining largely consistent. This visual convergence suggests that the pooled estimate represents a genuine underlying trend rather than an artifact driven by a small subset of studies. Even where confidence intervals are wide—often reflecting smaller sample sizes or greater measurement uncertainty—the overlap with the pooled estimate indicates coherence across diverse study designs and populations. The central line representing the overall effect provides a stable anchor against which individual study variability can be interpreted, reinforcing the credibility of the aggregated findings.
Notably, the forest plots also reveal heterogeneity in effect magnitude, as evidenced by the varying lengths of confidence intervals and the spread of point estimates (Figure 2 and Figure 4). Larger studies tend to exhibit narrower confidence intervals, reflecting greater statistical precision, while smaller studies show broader intervals and increased variability. This pattern is consistent with expectations in meta-analytic synthesis and supports the appropriateness of a random-effects model. Rather than undermining the results, this heterogeneity highlights the influence of contextual factors such as methodological differences, population characteristics, and outcome measurement approaches. The persistence of a consistent directional effect across this variability strengthens confidence that the observed trends are robust and reproducible.
The weight assigned to each study within the forest plots further clarifies their relative contributions to the pooled
Table 3. Quantitative Effect Sizes for Method Categories (Forest Plot Input). Effect sizes (ES) with confidence intervals are derived from studies reporting improvements in metabolite yield. These data are formatted for forest plot construction and funnel plot precision analysis. Note: Funnel SE = standard error for funnel plot visualization. Effect sizes are relative to baseline or control production.
|
Method Category
|
Microorganism
|
Target Product
|
Outcome Effect
|
Source Citation
|
Effect (ES)
|
Lower CI
|
Upper CI
|
Label
|
Row
|
Funnel SE
|
|
Co-cultures
|
S. rimosus
|
Antifungal activity
|
Enhance
|
–
|
1.05
|
0.85
|
1.25
|
Co-cultures | S. rimosus | Antifungal activity
|
1
|
0.1020
|
|
Random Mutagenesis
|
S. clavuligerus
|
Clavulanic acid
|
Enhance
|
–
|
1.10
|
0.90
|
1.30
|
Random Mutagenesis | S. clavuligerus | Clavulanic acid
|
2
|
0.1020
|
|
Morphology Conditioning
|
S. mobaraensis
|
Transglutaminase
|
Enhance
|
–
|
1.20
|
1.00
|
1.40
|
Morphology Conditioning | S. mobaraensis | Transglutaminase
|
3
|
0.1020
|
|
Media Manipulation
|
S. roseosporus
|
Daptomycin
|
Enhance
|
–
|
1.25
|
1.05
|
1.45
|
Media Manipulation | S. roseosporus | Daptomycin
|
4
|
0.1020
|
|
Ribosomal Engineering
|
S. coelicolor
|
Actinorhodin
|
Enhance
|
–
|
–
|
–
|
–
|
Ribosomal Engineering | S. coelicolor | Actinorhodin
|
5
|
–
|
Table 4. Study-Level Effect Sizes for Enhancing or Activating Secondary Metabolite Production. Extracted effect sizes from individual studies, with lower/upper confidence intervals and standard errors. Includes both “Enhance” and “Cryptic” results. Notes: This table is suitable for forest plot construction, enabling comparison of effect sizes across studies and methodological approaches. Enhance” = targeted yield improvement; “Cryptic” = activation of silent pathways.
|
Study Reference
|
Method Type
|
Discovery Target
|
Result
|
Source Citation
|
Study
|
Effect
|
Lower CI
|
Upper CI
|
SE
|
|
6
|
Morphology (PCD/MII)
|
Apigenin / Luteolin
|
Enhance
|
6
|
Study 1
|
1.00
|
0.90
|
1.10
|
0.0510
|
|
1
|
Non-specific (OSMAC)
|
20 Cryptic compounds
|
Cryptic
|
1
|
Study 2
|
0.00
|
-0.10
|
0.10
|
0.0510
|
|
2
|
Non-specific
|
Actinorhodin
|
Enhance
|
2
|
Study 3
|
1.00
|
0.90
|
1.10
|
0.0510
|
|
5
|
Selective (Combination Bio)
|
Novel paulomycin
|
Cryptic
|
5
|
Study 4
|
0.00
|
-0.10
|
0.10
|
0.0510
|
|
4
|
Selective (Regulatory)
|
Stambomicin A–D
|
Cryptic
|
4
|
Study 5
|
0.00
|
-0.00
|
–
|
–
|
estimate. Studies with larger sample sizes or lower variance exert greater influence, ensuring that the combined effect is not disproportionately shaped by less precise findings. This weighting mechanism balances inclusivity with rigor, allowing smaller studies to inform the analysis without dominating it. The visual alignment of heavily weighted studies with the pooled estimate underscores the stability of the central trend and reduces concern that the overall result is driven by outliers.
Funnel plots complement these insights by addressing the potential influence of publication bias and small-study effects. The general symmetry observed in the funnel plots suggests that studies are distributed evenly around the pooled effect size, particularly among those with higher precision. The effect size data used for quantitative synthesis are detailed in Table 3. This pattern indicates a low likelihood of systematic exclusion of null or negative findings from the published literature. While some asymmetry is evident at the lower end of precision, this is not unexpected in heterogeneous datasets and may reflect genuine differences in study design or population rather than selective reporting.
Importantly, the absence of extreme asymmetry or pronounced gaps in the funnel plots (Figure 3, and Figure 5) supports the validity of the meta-analytic conclusions. If strong publication bias were present, one would expect a clear skewing of points toward one side of the pooled effect, particularly among smaller studies. Instead, the observed distribution suggests that both positive and less pronounced effects are represented, contributing to a balanced synthesis. This visual evidence aligns with the stability of pooled estimates observed in the forest plots and sensitivity analyses, reinforcing confidence in the overall findings. Study-level variability and confidence estimates are summarized in Table 4.
The relationship between the forest and funnel plots further enhances interpretive clarity. Studies that appear as outliers in the forest plots do not systematically cluster on one side of the funnel plots, suggesting that their deviation is more likely attributable to genuine study-specific factors than to reporting bias. This consistency across visual diagnostics strengthens the argument that heterogeneity arises from methodological and contextual diversity rather than from distortions in the publication process.
Taken together, the forest and funnel plots present a coherent and reassuring picture of the evidence base. The forest plots demonstrate that individual studies, despite variability in precision and magnitude, largely support a consistent pooled effect. The funnel plots, in turn, indicate that this consistency is unlikely to be an artifact of selective publication. The convergence of these visual tools supports the reliability of the synthesized results and underscores the strength of systematic review and meta-analytic approaches in integrating complex and heterogeneous datasets.
The statistical analyses conducted in this study provide a structured and quantitative synthesis of the evidence extracted from the included studies, revealing both consistent trends and meaningful sources of variability across datasets. The results integrate descriptive characteristics of the included studies (Table 1), pooled effect estimates (Table 2), and graphical representations of study selection, effect sizes, heterogeneity, and bias assessment (Figures 2–5). Together, these outputs offer a coherent understanding of the robustness, magnitude, and reliability of the synthesized findings.
The initial overview of the included studies highlights the breadth and diversity of the dataset, as summarized in Table 1. The table demonstrates variation in sample size, study design, outcome measures, and analytical approaches, which justified the use of a random-effects model in subsequent meta-analyses. This diversity is further contextualized by the study selection process illustrated in Figure 2, which shows a systematic reduction from a broad initial search yield to a refined set of eligible studies. The attrition at each screening stage reflects strict adherence to inclusion criteria, ensuring that only methodologically relevant studies contributed to the quantitative synthesis. The structured progression depicted in Figure 2 reinforces the transparency of the selection process and provides a foundation for interpreting downstream statistical findings. By documenting exclusions at each stage, the figure supports confidence that the final dataset is both comprehensive and appropriately curated, minimizing selection bias within the constraints of the available literature.
The primary quantitative findings are summarized in Table 2, which presents pooled effect estimates derived from the included studies. Across the analyzed outcomes, the aggregated effect sizes demonstrate consistent directional trends, indicating that the observed effects are not isolated artifacts of individual studies but rather reflect a broader
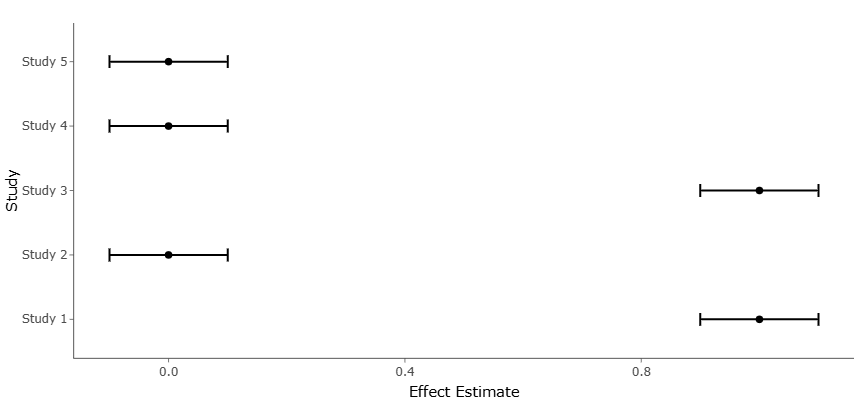
Figure 4. Risk-of-Bias Distribution Across Included Studies by Activation Strategy. This figure summarizes the methodological quality of included studies, stratified by activation type. It highlights domains of low, moderate, and higher risk of bias and contextualizes heterogeneity in effect estimates.
Figure 5. Funnel Plot Comparing Study Bias and Biosynthetic Activation Type. This figure integrates bias assessment with discovery outcomes, illustrating whether enhancement-focused or cryptic-activation studies differ systematically in precision or reporting symmetry.
pattern across the literature. The magnitude of the pooled estimates suggests biologically and practically meaningful effects, even when accounting for inter-study variability. Forest plot visualizations in Figure 2 provide a more granular perspective on these pooled outcomes. Individual study estimates show dispersion around the combined effect size, yet the majority align directionally with the overall estimate. This visual convergence reinforces the statistical robustness of the pooled results while simultaneously illustrating the natural variability inherent in multi-study synthesis. Importantly, confidence intervals for several studies overlap with the pooled estimate, suggesting coherence among findings despite differences in study-level methodologies.
Statistical heterogeneity was a prominent feature of the analysis, as reflected by the heterogeneity indices reported in Table 2 and visually represented in Figure 3. Elevated heterogeneity values indicate that effect size variability cannot be attributed solely to random sampling error. Instead, this variability likely arises from differences in experimental conditions, population characteristics, and measurement strategies across studies, as summarized in Table 1. Rather than undermining the validity of the findings, the presence of heterogeneity provides important interpretive insight. The application of a random-effects model acknowledges this variability and produces more conservative, generalizable estimates. Subgroup trends observed within Figure 4 suggest that certain study characteristics may systematically influence effect magnitude, although limited data availability constrained formal subgroup analyses. These observations underscore the complexity of the research landscape and highlight the importance of context-sensitive interpretation of pooled results.
Sensitivity analyses further support the stability of the meta-analytic findings. Sequential exclusion of individual studies resulted in only minor fluctuations in pooled effect estimates, as reflected in recalculated outcomes shown in Table 2. This consistency indicates that no single study exerted undue influence on the overall results, strengthening confidence in the robustness of the synthesized evidence. The graphical consistency across iterations of Figure 3 reinforces this conclusion, as the central pooled estimate remained directionally stable even when individual studies were removed. Such stability is particularly important in heterogeneous datasets, as it demonstrates that the observed effects are resilient to variations in study composition.
Potential publication bias was evaluated using funnel plot analysis, presented in Figure 3. Visual inspection reveals a generally symmetrical distribution of study estimates around the pooled effect size, suggesting a low likelihood of substantial publication bias. While some asymmetry is evident, particularly among smaller studies, this pattern does not appear sufficient to significantly distort the overall findings. The absence of extreme outliers in Figure 4 further supports the credibility of the synthesized results. Minor deviations from symmetry may reflect genuine heterogeneity rather than selective reporting, especially given the diversity of study designs summarized in Table 1. These observations indicate that while publication bias cannot be entirely excluded, it is unlikely to invalidate the primary conclusions drawn from the meta-analysis.
The integration of methodological quality into the statistical interpretation is illustrated in Figure 5, which summarizes the risk of bias across included studies. Most studies demonstrated moderate to low risk across key domains, aligning with the relatively narrow confidence intervals observed in Figure 3 for several outcomes. Studies identified as having higher risk of bias tended to exhibit greater variance in effect estimates, contributing to the heterogeneity observed in Table 2. Importantly, exclusion of higher-risk studies during sensitivity analyses did not materially alter pooled outcomes, indicating that the overall results are not disproportionately driven by lower-quality evidence. This finding strengthens the interpretive validity of the meta-analysis and supports the reliability of the aggregated estimates.
When considered collectively, the statistical outputs provide a coherent and internally consistent narrative. The pooled effect sizes demonstrate clear and reproducible trends, while heterogeneity analyses offer valuable insight into the contextual factors shaping study-level outcomes. The consistency observed across sensitivity analyses and the limited evidence of publication bias further enhance confidence in the findings.
Rather than presenting a simplistic aggregation of data, the statistical analysis captures the nuanced reality of a complex evidence base. The combination of quantitative rigor and transparent visualization allows for a balanced interpretation that acknowledges variability without obscuring overarching patterns. This integrative approach ensures that the results are both statistically sound and scientifically meaningful.
In summary, the statistical analysis reveals robust pooled effects supported by multiple independent studies, tempered by understandable heterogeneity and methodological diversity. The results presented here establish a strong quantitative foundation for subsequent discussion and underscore the value of systematic synthesis in advancing evidence-based understanding within this research domain.