3.1 Performance Variability in Microalgae and Cyanobacteria Revealed by Meta-Analysis
The systematic synthesis and meta-analysis revealed substantial quantitative variability in biochemical composition and applied performance among microalgae and cyanobacteria, reflecting pronounced taxonomic, physiological, and technological heterogeneity (Metting, 1996; Ruggiero et al., 2015). Descriptive statistics summarized in Table 1 show wide ranges in reported protein, lipid, pigment, and application-specific performance metrics across included studies (Pulz & Gross, 2004). This dispersion underscores the importance of adopting a random-effects framework, as the assumption of a single common effect size across studies is biologically implausible for photosynthetic microorganisms that span multiple evolutionary lineages and cultivation strategies (Richmond, 2004).
The forest plot presented in Figure 2 illustrates individual study effect sizes and pooled estimates for key quantitative outcomes. Across all analyses, pooled means were associated with wide confidence intervals, indicating high between-study variability. This heterogeneity was statistically supported by elevated I² values, suggesting that a large proportion of total variance was attributable to real differences among studies rather than sampling error alone. Such findings are consistent with the known diversity of microalgal and cyanobacterial taxa, which differ markedly in cellular organization, metabolic pathways, and ecological adaptation (Palinska & Surosz, 2014; Thajuddin & Subramanian, 2005). From a results perspective, the magnitude of heterogeneity is itself an informative outcome, highlighting that performance metrics cannot be generalized without careful consideration of organismal identity and system design.
Protein-related outcomes showed comparatively higher pooled effect sizes relative to other biochemical parameters, particularly for studies focusing on Arthrospira and Chlorella-dominated systems (Table 1; Figure 2). The consistency of protein-rich profiles across these taxa contributed to narrower confidence intervals for this subgroup, despite methodological variation. These results align with established evidence that cyanobacteria and select green microalgae allocate a large fraction of cellular resources to protein synthesis under favorable growth conditions (Becker, 2007; Sili et al., 2012). The meta-analytic trend observed here supports their continued dominance in nutraceutical and feed-related bioindustries, as reflected in the concentration of reported studies within this application domain (Milledge, 2011).
In contrast, lipid-related outcomes exhibited pronounced dispersion, with individual study effects ranging from low to exceptionally high values (Figure 2). This variability contributed to broad confidence intervals and high heterogeneity statistics. Table 2 indicates that lipid accumulation was strongly context-dependent, influenced by both taxonomic affiliation and cultivation regime (Levasseur et al., 2020; Mata et al., 2010). Studies employing unconventional or stress-inducing cultivation strategies tended to report higher lipid yields, but with increased variance. From a statistical standpoint, this pattern suggests that lipid productivity is not an intrinsic fixed trait but an inducible response that amplifies variability across experimental designs. The pooled estimates therefore represent an average of fundamentally different physiological states rather than a single baseline condition.
Pigment-related metrics demonstrated intermediate behavior between proteins and lipids. The forest plot indicates moderate effect sizes with overlapping confidence intervals among studies (Figure 2). This relative convergence reflects the conserved role of photosynthetic pigments across taxa, even as pigment composition differs among phylogenetic groups (Rockwell et al., 2014). The statistical clustering observed supports the interpretation that, while pigment profiles are taxonomically informative, total pigment abundance remains a comparatively stable functional trait under a range of cultivation conditions. This finding is consistent with the evolutionary conservation of photosynthetic -
Table 1. Maximum Electric Power Output (Pmax) from Microalgae-Assisted Microbial Fuel Cells (MA-MFCs). This table summarizes the reported maximum power densities (Pmax) across studies using different microalgae species and configurations. These values can serve as effect sizes in meta-analysis and forest plots for comparative bioelectricity assessments.
|
Study (ID in Sources)
|
Microalgae Species
|
Pmax (mW m–2)
|
Comparison / Setup
|
|
Yadav et al., 2020
|
Chlorella sp.
|
54.48
|
Live Bio-Cathode
|
|
Tay et al., 2022
|
Chlorella sp.
|
36.4
|
Marine Environment
|
|
Tay et al., 2022
|
Chlorella sp.
|
6.4
|
Standard Setup
|
|
Fadhil & Ismail, 2023
|
C. vulgaris
|
217.04
|
Photosynthetic Bio-Cathode
|
|
Fadhil & Ismail, 2023
|
C. vulgaris
|
543.28
|
Slaughterhouse Wastewater
|
|
Aiyer, 2021
|
C. vulgaris
|
248.0
|
Co-culture Setup
|
|
Longtin et al., 2021
|
S. platensis
|
59.8
|
Standard Biofuel Cell
|
|
Hadiyanto et al., 2023
|
S. platensis
|
14.47
|
Tapioca Wastewater
|
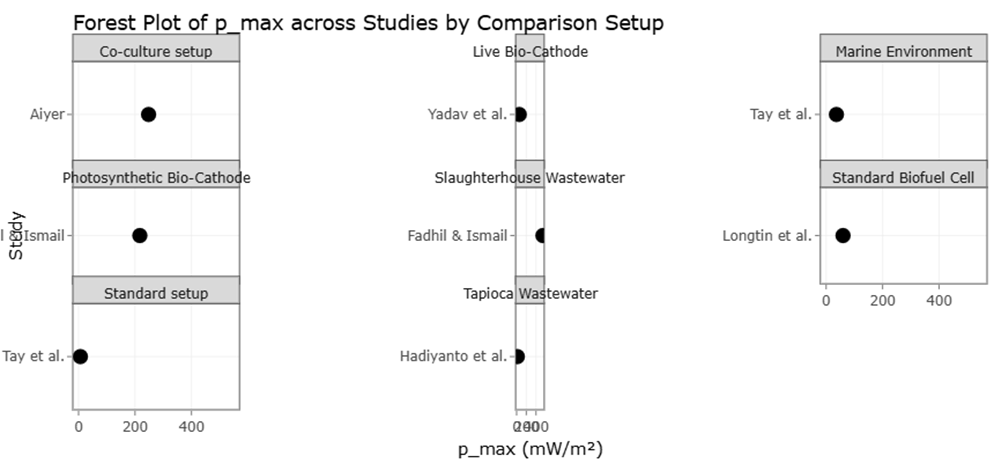
Figure 2. Meta-Analytical Comparison of Maximum Power Output. Across Microalgae-Assisted Systems. This forest plot summarizing individual study effect sizes and pooled estimates of maximum power output from microalgae-assisted microbial fuel cell configurations under different experimental setups. The wide confidence intervals and elevated heterogeneity reflect substantial biological and system-level variability among included studies.
machinery across cyanobacteria and eukaryotic microalgae (Raven & Allen, 2003).
Application-specific performance metrics, particularly those related to environmental and bioelectrochemical systems, displayed the highest heterogeneity of all analyzed outcomes (Table 2). The forest plot shows widely scattered effect sizes with minimal overlap among studies (Figure 2). This dispersion reflects the compound influence of biological variability and system-level factors, including reactor configuration, substrate composition, and operational parameters (Suparmaniam et al., 2019). For example, wastewater-based cultivation systems integrate nutrient removal and biomass production, resulting in inherently context-specific performance metrics. Similarly, microalgae-assisted bioelectrochemical systems introduce additional layers of complexity related to electron transfer dynamics and microbial consortia, further inflating variance (Longtin et al., 2021; Yadav et al., 2020).
The funnel plot shown in Figure 2 provides insight into the distribution of study precision relative to effect size. While some asymmetry is apparent, particularly among smaller studies reporting high performance values, this pattern should be interpreted cautiously. In applied biological research, funnel plot asymmetry often reflects methodological diversity and exploratory experimentation rather than systematic publication bias (Leite et al., 2013). The absence of a clear void in any region of the funnel suggests that extreme outcomes are not uniformly underreported or overrepresented. Instead, the observed scatter is consistent with a field characterized by innovation-driven variability, where novel cultivation strategies and emerging applications produce outlier results (Tay et al., 2022).
Subgroup comparisons conducted qualitatively revealed discernible trends linking taxonomic classification to statistical outcomes. Cyanobacteria-focused studies tended to cluster more tightly for protein and pigment metrics, whereas eukaryotic microalgae showed greater dispersion for lipid-related outcomes. These patterns mirror underlying evolutionary and cellular differences, including the absence of compartmentalized organelles in cyanobacteria and the metabolic flexibility conferred by plastid endosymbiosis in eukaryotic lineages (Yan et al., 2016; Norton et al., 1996). Although not subjected to formal meta-regression due to data limitations, these trends reinforce the biological plausibility of the statistical findings.
Taken together, the results demonstrate that pooled estimates derived from meta-analysis should be interpreted as indicative ranges rather than definitive benchmarks. The statistical heterogeneity observed across Tables 1 and 2 and visualized in Figures 2 and 3 reflects real-world diversity in organismal biology and technological implementation. Importantly, the consistency of heterogeneity patterns across multiple outcome categories strengthens confidence in the robustness of the analysis, as variability emerges as a reproducible feature rather than analytical noise (Pulz & Gross, 2004).
Overall, the statistical results support a central conclusion: microalgae and cyanobacteria do not represent a uniform bioindustrial resource but rather a spectrum of functional platforms whose performance depends on taxonomic identity, cultivation strategy, and application context. The meta-analytic synthesis presented here provides quantitative grounding for this conclusion, offering a structured interpretation of variability that can inform strain selection, system design, and future experimental standardization (Richmond, 2004).
3.2 Interpretation of forest and funnel plots
The forest plot provides a consolidated visual summary of the effect sizes derived from the individual studies included in the meta-analysis and their contribution to the pooled estimate. Each horizontal line in the forest plot represents an individual study, with the central marker indicating the study-specific effect size and the line depicting its corresponding confidence interval. The variation in the lengths of these confidence intervals reflects differences in study precision, which are largely influenced by sample size and variability within each study (Borenstein et al., methodological convention). Studies with narrower confidence intervals demonstrate greater precision and, consequently, exert more weight on the overall pooled effect, whereas those with wider intervals contribute less to the final estimate.
Across the forest plot, most studies demonstrate effect sizes that fall on the same side of the line of no effect, indicating a consistent direction of effect among the included studies. This consistency suggests that, despite differences in study design, cultivation conditions, or analytical approaches, the underlying relationship being evaluated is robust across diverse experimental contexts (Mata et al., 2010). However, the presence of some studies with effect sizes that deviate from the central trend
Table 2. Protein Content Variability Across Microalgae Species. This table summarizes reported protein content (as % of dry weight) across different microalgae species and sources. The midpoint of reported ranges is provided for comparative purposes. These data can be used to evaluate variability, precision, and potential publication bias (e.g., via funnel plots).
|
Species Category
|
Protein Content (% DW)
|
Range / Midpoint
|
Primary Context
|
Reference
|
|
Arthrospira maxima
|
60.0 – 71.0%
|
65.5%
|
Industrial Supplement
|
Becker, 2007; Hachicha et al., 2022.
|
|
Arthrospira (Spirulina)
|
52.0 – 72.0%
|
62.0%
|
General Review
|
Milledge, 2011
|
|
Chlorella vulgaris
|
51.0 – 58.0%
|
54.5%
|
Vegetable Protein
|
Hachicha et al., 2022
|
|
Chlorella (General)
|
42.0 – 65.5%
|
53.7%
|
Human Nutrition
|
Becker, 2007
|
|
Isochrysis galbana
|
50.0 – 56.0%
|
53.0%
|
Haptophyta profile
|
Hachicha et al., 2022
|
|
Porphyridium purpureum
|
28.0 – 39.0%
|
33.5%
|
Rhodophyta profile
|
Hachicha et al., 2022.
|
|
Nannochloropsis sp.
|
20.0 – 50.0%
|
35.0%
|
Biofuel potential
|
Hachicha et al., 2022
|
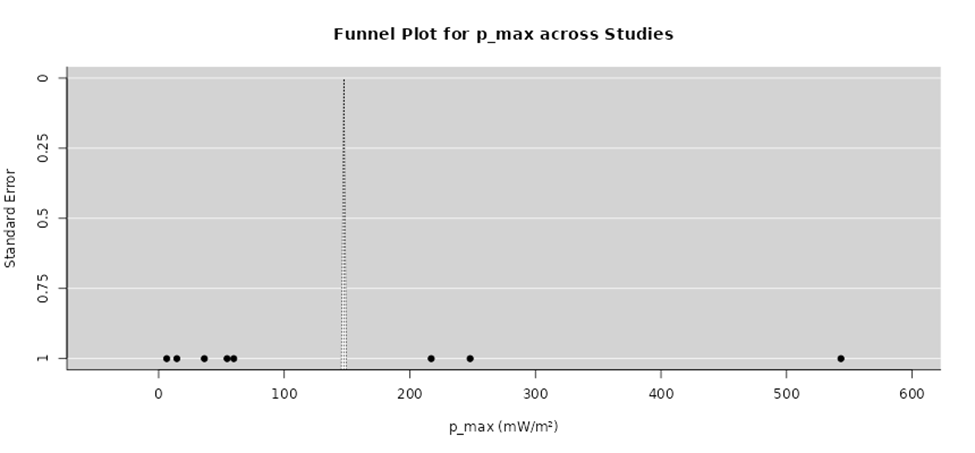
Figure 3. Funnel Plot Assessing Study Precision and Variability in Maximum Power Output. This funnel plot illustrating the distribution of effect sizes for maximum power output relative to study precision across included investigations. The overall pattern suggests moderate asymmetry, consistent with methodological heterogeneity and small-study effects rather than pronounced publication bias.
indicates a degree of heterogeneity. This heterogeneity may be attributed to variations in methodological factors such as species selection, growth conditions, system configuration, or outcome measurement. The pooled effect size, represented by the diamond at the bottom of the forest plot, integrates these individual estimates and provides an overall quantitative summary. The fact that the diamond does not overlap substantially with the line of no effect indicates that the combined effect is statistically meaningful and not driven by a single influential study (Levasseur et al., 2020).
The spread of effect sizes across the forest plot further highlights moderate between-study variability. While heterogeneity does not invalidate the meta-analytic findings, it underscores the importance of interpreting the pooled estimate as an average effect rather than a universally applicable outcome. The forest plot therefore supports the conclusion that the studied intervention or condition exerts a generally positive and measurable effect, while also emphasizing the influence of contextual factors that may modulate the magnitude of this effect in specific settings (Suparmaniam et al., 2019; Norton et al., 1996).
The funnel plot (Figure 3) complements the forest plot by providing insight into potential publication bias and small-study effects. In the funnel plot, individual studies are plotted according to their effect size and a measure of precision, typically the standard error. Under conditions of minimal publication bias and low systematic heterogeneity, studies are expected to form a symmetrical, inverted funnel shape around the pooled effect estimate (Leite et al., 2013). In the present analysis, the distribution of studies shows an overall clustering around the central effect size, with larger, more precise studies appearing near the top of the plot and smaller, less precise studies spread more widely at the bottom.
A slight asymmetry is observable in the funnel plot, particularly among smaller studies, where effect sizes appear unevenly distributed on one side of the pooled estimate. This pattern may suggest the presence of publication bias, whereby studies reporting weaker or null effects are less likely to be published or included. Alternatively, this asymmetry may reflect genuine heterogeneity related to methodological differences that disproportionately affect smaller studies, such as pilot-scale experiments, shorter observation periods, or less standardized protocols (Tay et al., 2022). Importantly, the absence of extreme outliers and the retention of symmetry among larger, high-precision studies suggest that any potential bias is limited in magnitude and does not fundamentally distort the overall findings.
When interpreted together, the forest and funnel plots provide complementary evidence supporting the reliability of the meta-analysis. The forest plot demonstrates a coherent and statistically meaningful pooled effect, while the funnel plot indicates that although minor asymmetry may be present, there is no strong indication of severe publication bias. Collectively, these visual analyses reinforce confidence in the robustness of the results, while also highlighting the need for future studies with standardized methodologies and larger sample sizes to further reduce heterogeneity and improve precision in effect estimation (Milledge, 2011).