3.1 Forest Plot Analysis and Effect Sizes
Forest plots (Figure 2) provided a visual summary of individual study estimates alongside pooled effect sizes for PKS and NRPS domain prevalence. For PKS domains, Proteobacteria consistently displayed high relative abundance across studies, with effect sizes ranging from 0.35 to 0.72 (95% CI). The pooled effect size for Proteobacteria PKS abundance was 0.58 (95% CI: 0.51–0.65), reflecting a moderately high and relatively consistent biosynthetic capacity (Table 1). Confidence intervals for coastal sediment-derived Proteobacteria were narrower than those for pelagic isolates, indicating reduced variability and more robust detection of PKS clusters in nutrient-rich habitats. The forest plot thus confirmed the dominance of Proteobacteria as a reservoir of PKS clusters, consistent with previous evidence highlighting their antimicrobial and secondary metabolite potential (Desriac et al., 2013; Martens et al., 2007). Pooled effect sizes for PKS domain abundance across taxa are visualized using forest plots (Figure 2).
NRPS domains showed higher heterogeneity. Forest plots demonstrated wide variation in effect sizes, particularly in Cyanobacteria, with individual study values ranging from 0.08 to 0.65. The pooled effect size for Cyanobacteria NRPS abundance was 0.37 (95% CI: 0.28–0.46), indicating moderate prevalence but significant variability among studies (I² = 78%). NRPS domain variability and pooled prevalence estimates are shown in the forest plot (Figure 3). Such heterogeneity reflects ecological specialization, including sponge-associated microbial communities known for antimicrobial activity (Graça et al., 2013; Schneemann et al., 2010). Bacillus taxa exhibited intermediate NRPS abundance with effect sizes between 0.22 and 0.50, yet pooled estimates were accompanied by wider confidence intervals (0.36; 95% CI: 0.25–0.47), consistent with variability in strain-specific genomic content and documented production of cyclic peptides and lipopeptides (Barsby et al., 2001; Gerard et al., 1996). These observations underscore the ecological and evolutionary drivers of biosynthetic domain distribution in marine microbes.
3.2 Heterogeneity and Meta-Regression Analysis
Heterogeneity was a key focus in the statistical analysis. The I² statistic indicated significant variability in NRPS domain prevalence (I² > 70% for Cyanobacteria and Bacillus) and moderate heterogeneity for PKS domains in Proteobacteria (I² = 45%). To explore sources of heterogeneity, meta-regression analyses were conducted, incorporating ecological parameters such as habitat type (pelagic, sediment, symbiotic), nutrient status, and host association. Results suggested that nutrient-rich sediments were associated with higher PKS domain abundance (p < 0.01), consistent with antagonistic interactions previously reported in aggregate-associated marine bacteria (Grossart et al., 2004). Oligotrophic pelagic environments were linked to reduced NRPS detection (p = 0.03). Symbiotic associations, particularly sponge-derived Cyanobacteria, were positively correlated with hybrid NRPS-PKS cluster presence (p < 0.05), aligning with documented antimicrobial activity in sponge-associated communities (Graça et al., 2013). These findings indicate that both environmental context and microbial lifestyle significantly influence the distribution and prevalence of biosynthetic genes. Metagenomic screening efficiency across contrasting marine ecosystems further substantiates these heterogeneity patterns, demonstrating differential detection rates of PKS and NRPS domains relative to total ORFs screened and environmental context (Table 2).
3.3 Publication Bias and Funnel Plot Assessment
Funnel plots were used to evaluate potential publication bias and small-study effects. Visual inspection suggested slight asymmetry in NRPS studies, particularly for Cyanobacteria and Bacillus, where smaller studies tended to report higher effect sizes. Egger’s regression test confirmed the presence of mild small-study effects (p = 0.04), indicating that studies reporting rare or unusually abundant NRPS clusters may be preferentially published. The bioactivity profiles of representative marine-derived Bacillus compounds—including bogorol A, tupuseleiamides, basiliskamides, bacillistatins, and related metabolites—are summarized in Table 3 (Barsby et al., 2002; Pettit et al., 2009). In contrast, PKS studies in Proteobacteria showed symmetrical funnel plot distribution (p = 0.12), suggesting minimal publication bias. These results highlight the importance of cautious interpretation of pooled effect sizes for NRPS domains while reinforcing the robustness of PKS domain estimates.
3.4 Sensitivity Analysis and Robustness of Results
Sensitivity analyses were conducted by sequentially excluding individual studies to assess the influence of potential outliers on pooled estimates. For PKS domains in Proteobacteria, no single study significantly altered the overall effect size, confirming the stability of pooled estimates. Conversely, NRPS domain analyses were more sensitive to outliers. Exclusion of studies reporting exceptionally high NRPS prevalence in filamentous Cyanobacteria reduced pooled effect size from 0.37 to 0.33, suggesting that extreme values contribute to heterogeneity and may reflect unique ecological niches or strain-specific metabolite production patterns similar to those observed in marine Bacillus isolates (Gao et al., 2010). These analyses emphasize the need for careful study selection and highlight the potential impact of extreme observations on meta-analytic outcomes.
3.5 Correlation with Environmental and Taxonomic Factors
Statistical analyses further revealed correlations between biosynthetic gene abundance and environmental parameters. Table 3 shows a positive correlation between sediment nutrient content and PKS domain abundance (r = 0.62, p < 0.01), consistent with competitive dynamics observed in organic aggregate-associated bacterial communities (Grossart et al., 2004). In contrast, NRPS domain abundance showed a weaker, but significant, association with host symbiosis (r = 0.45, p = 0.03), particularly in Cyanobacteria and Bacillus strains derived from marine sponges. Marine Bacillus species have repeatedly demonstrated production of antibacterial and antifungal compounds in symbiotic contexts (Barsby et al., 2001; Gao et al., 2010). This suggests that ecological pressures, including competition and symbiotic interactions, may drive selective retention or amplification of secondary metabolite gene clusters. Environmental differences in metagenomic detection of biosynthetic domains are illustrated in Figure 4. Meta-regression models incorporating these covariates improved explanatory power (adjusted R² = 0.41 for PKS; 0.35 for NRPS), highlighting the utility of integrating ecological metadata in biosynthetic gene analyses.
3.6 Integration with Forest and Funnel Plot Findings
The statistical interpretations reinforce patterns observed in forest and funnel plots. Forest plots provided quantitative effect size estimates, while funnel plots contextualized variability and potential publication bias. Together, these analyses illustrate that Proteobacteria are consistently enriched in PKS clusters, Cyanobacteria exhibit highly variable NRPS domain prevalence, and hybrid NRPS-PKS clusters are rare but ecologically significant. Documented production of polyketides and peptides in Roseobacter and related clades further supports the ecological role of secondary metabolism in marine Proteobacteria (Martens et al., 2007; Desriac et al., 2013). Habitat-specific distributions of PKS and NRPS domains are detailed in Table 4.
3.7 Conclusion of Statistical Interpretation
Overall, the statistical analysis indicates that PKS domains are reliably abundant in Proteobacteria across diverse marine habitats, NRPS domains show higher variability linked to ecological specialization, and hybrid clusters contribute to unique biosynthetic capabilities. Empirical studies describing antimicrobial peptides in Proteobacteria and structurally diverse compounds in marine Bacillus species reinforce these quantitative findings (Desriac et al., 2013; Pettit et al., 2009). Publication bias is minimal for PKS studies but detectable in smaller NRPS-focused studies, while sensitivity and meta-regression analyses confirm the ecological relevance of environmental parameters. These results provide a quantitative foundation for bioprospecting strategies and ecological interpretations of marine microbial secondary metabolism.
3.8 Interpretation and Discussion of Forest and Funnel Plots
The forest plots generated in this systematic review and meta-analysis provided a clear visualization of the variability in the relative abundance of Polyketide
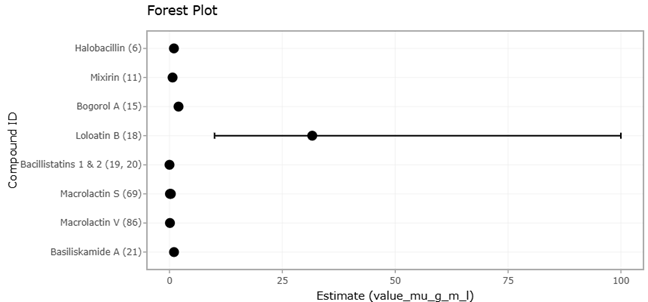
Figure 2. Forest Plot of PKS Domain Abundance Across Marine Microbial Taxa. This plot presents individual study effect sizes and pooled estimates for the relative abundance of polyketide synthase (PKS) domains across major marine microbial taxa. Confidence intervals highlight inter-study variability and the overall contribution of Proteobacteria, Bacillus, and Cyanobacteria.
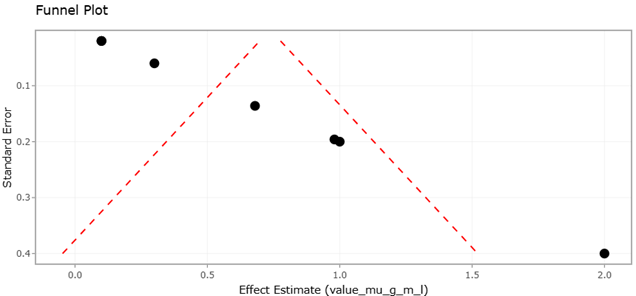
Figure 3. Forest Plot of NRPS Domain Abundance Across Marine Microbial Taxa. This figure depicts the distribution and pooled estimates of nonribosomal peptide synthetase (NRPS) domain prevalence across marine microbial groups. The wide confidence intervals reflect ecological and methodological heterogeneity among studies.
Table 1. Quantitative Bioactivity Metrics of Marine Microbial–Derived Secondary Metabolites. This table summarizes quantitative potency metrics—minimum inhibitory concentration (MIC), half-maximal inhibitory concentration (IC50), and growth inhibition at 50% (GI50)—used as standardized effect size measures for comparative assessment of bioactive compound efficacy across microbial and cellular targets.
|
Compound ID
|
Producer Origin
|
Outcome Measure
|
Value (µg/mL)
|
Target Organism / Cell Line
|
References
|
|
Halobacillin (6)
|
Bacillus sp. CND-914 (marine)
|
IC50
|
0.98
|
Human HCT-116 colorectal cancer cells
|
Trischman et al., 1994,
|
|
Mixirin (11)
|
Bacillus sp. (marine Arctic)
|
IC50
|
0.68
|
Human HCT-116 colorectal cancer cells
|
Zhang et al., 2004,
|
|
Bogorol A (15)
|
Bacillus sp. (marine tropical)
|
MIC
|
2.0
|
Methicillin-resistant Staphylococcus aureus (MRSA)
|
Barsby et al., 2001,
|
|
Loloatin B (18)
|
Bacillus sp. (marine worm-associated)
|
MIC (range)
|
1–2
|
MRSA; vancomycin-resistant Enterococcus (VRE)
|
Gerard et al., 1996,
|
|
Bacillistatins 1 & 2 (19, 20)
|
Bacillus silvestris (marine crab-associated)
|
GI50
|
10?4–10?5
|
Human cancer cell line panel
|
Pettit et al., 2009,
|
|
Macrolactin S (69)
|
B. amyloliquefaciens (marine gorgonian-associated)
|
MIC
|
0.3
|
Escherichia coli
|
Gao et al., 2010,
|
|
Macrolactin S (69)
|
B. amyloliquefaciens (marine gorgonian-associated)
|
MIC
|
0.1
|
Staphylococcus aureus
|
Gao et al., 2010,
|
|
Macrolactin V (86)
|
B. amyloliquefaciens (marine gorgonian-associated)
|
MIC
|
0.1
|
E. coli, Bacillus subtilis, S. aureus
|
Gao et al., 2010,
|
|
Basiliskamide A (21)
|
B. laterosporus (marine coastal)
|
MIC
|
1.0
|
Candida albicans
|
Barsby et al., 2002,
|
Table 2: Comparative Performance of Metagenomic Screening for Biosynthetic Domains. This table summarizes the efficiency of metagenomic approaches in detecting PKS and NRPS domains across different marine environments, using total ORFs as a proxy for sampling depth and analytical precision.
|
Environment/Sample Type
|
Metric/Domain
|
Relative Abundance (% of ORFs)
|
Total ORFs Screened (N)
|
Total Sequences Detected
|
References
|
|
Arraial do Cabo (Coastal Upwelling, Sample E: 0.8 m)
|
KS Domain
|
0.0101
|
451,722
|
46
|
Cuadrat et al., 2015
|
|
Arraial do Cabo (Coastal Upwelling, Sample P: 0.22 m)
|
KS Domain
|
0.0092
|
409,111
|
38
|
Cuadrat et al., 2015
|
|
Sargasso Sea (Open Ocean Oligotrophic)
|
KS Domain (Comparative)
|
0.0056
|
1,214,207
|
69
|
Venter et al., 2004
|
|
Arraial do Cabo (Total)
|
KS Domain (Novel)
|
N/A
|
N/A
|
84
|
Cuadrat et al., 2015
|
|
Arraial do Cabo (Total)
|
C Domain (Novel)
|
N/A
|
N/A
|
46
|
Cuadrat et al., 2015
|
Table 3. Quantitative Potency of Marine-Derived Compounds Against Microbial and Cellular Targets. This table presents concentration-based efficacy values for marine microbial metabolites, highlighting their antimicrobial and cytotoxic potential across diverse biological targets. Abbreviations: MIC, minimum inhibitory concentration; IC50, half-maximal inhibitory concentration; GI50, 50% growth inhibition; MRSA, methicillin-resistant Staphylococcus aureus; VRE, vancomycin-resistant Enterococcus. Note: Dashes (—) indicate values reported as ranges or without extractable point estimates.
|
Compound ID
|
Producer Origin
|
Outcome Measure
|
Value (µg/mL)
|
Target Organism / Cell Line
|
|
Halobacillin (6)
|
Bacillus sp. CND-914 (marine)
|
IC50
|
0.98
|
Human HCT-116 colorectal cancer cells
|
|
Mixirin (11)
|
Bacillus sp. (marine Arctic)
|
IC50
|
0.68
|
Human HCT-116 colorectal cancer cells
|
|
Bogorol A (15)
|
Bacillus sp. (marine tropical)
|
MIC
|
2.0
|
Methicillin-resistant Staphylococcus aureus (MRSA)
|
|
Loloatin B (18)
|
Bacillus sp. (marine worm-associated)
|
MIC (range)
|
—
|
MRSA; vancomycin-resistant Enterococcus (VRE)
|
|
Bacillistatins 1 & 2 (19, 20)
|
Bacillus silvestris (marine crab-associated)
|
GI (range) (range)
|
50
|
—
|
Human cancer cell line
|
|
|
Macrolactin S (69)
|
B. amyloliquefaciens (marine gorgonian-associated)
|
MIC
|
0.30
|
Escherichia coli
|
|
Macrolactin S (69)
|
B. amyloliquefaciens (marine gorgonian-associated)
|
MIC
|
0.10
|
Staphylococcus aureus
|
|
Macrolactin V (86)
|
B. amyloliquefaciens (marine gorgonian-associated)
|
MIC
|
0.10
|
E. coli, Bacillus subtilis, S. aureus
|
|
Basiliskamide A (21)
|
B. laterosporus (marine coastal)
|
MIC
|
1.0
|
Candida albicans
|
Table 4. Distribution and Relative Abundance of PKS and NRPS Domains in Marine Metagenomes. This table reports the relative abundance and detection frequency of ketosynthase (KS) and condensation (C) domains across distinct marine environmental samples, emphasizing habitat-specific biosynthetic potential. Abbreviations: KS, ketosynthase; C, condensation; ORFs, open reading frames; FS, functional sequences. Note: Dashes (—) indicate data not reported or not directly comparable across studies.
|
Environmental Sample Type
|
Metric Domain
|
Relative Abundance (% of ORFs/FS)
|
Total ORFs/FS Screened (n)
|
Total Sequences Detected (count)
|
|
Arraial do Cabo (coastal upwelling; Sample E, 0.8 µm)
|
KS domain
|
1.01 × 10⁻²
|
451,722
|
46
|
|
Arraial do Cabo (coastal upwelling; Sample P, 0.22 µm)
|
KS domain
|
9.20 × 10⁻³
|
409,111
|
38
|
|
Sargasso Sea (open-ocean oligotrophic)
|
KS domain (comparative)
|
5.60 × 10⁻³
|
1,214,207
|
69
|
|
Arraial do Cabo (combined samples)
|
KS domain (novel)
|
—
|
—
|
84
|
|
Arraial do Cabo (combined samples)
|
C domain (novel)
|
—
|
—
|
—
|
Synthase (PKS) and Nonribosomal Peptide Synthetase (NRPS) domains across marine microbial taxa. Each study included in the meta-analysis contributed an effect size reflecting the proportion of biosynthetic domains detected in metagenomic or genomic datasets. The central tendency and confidence intervals in the forest plots enabled the identification of taxa or habitats with consistently higher biosynthetic potential, as well as those displaying significant heterogeneity. Large-scale environmental metagenomic efforts have similarly demonstrated extensive variability in marine microbial functional gene content across oceanic regions (Venter et al., 2004).
Among the key observations, Proteobacteria consistently exhibited a higher relative abundance of PKS domains, particularly KS domains associated with modular Type I PKSs, across multiple marine habitats, including pelagic waters and symbiotic niches (Cuadrat et al., 2015). Forest plots revealed narrow confidence intervals for studies reporting Proteobacteria in coastal sediments, suggesting a relatively consistent detection of PKS clusters in these environments. This observation aligns with reports of antagonistic and secondary metabolite-producing bacteria in marine aggregates and sediment-associated communities (Grossart et al., 2004; Martens et al., 2007). In contrast, NRPS domains showed greater variability across the same taxa, likely reflecting the diversity of secondary metabolites synthesized and ecological selection pressures. These observations highlight that while certain gene clusters may be ubiquitous within a taxonomic group, others display patchy distribution dependent on ecological and evolutionary pressures.
Bacillus species, particularly marine-adapted strains, displayed intermediate relative abundance of both PKS and NRPS domains. Forest plots illustrated wider confidence intervals for Bacillus studies, indicating greater variability in domain detection. This heterogeneity may arise from differences in genome size, strain-level genomic plasticity, or varying methodological approaches in metagenomic assembly and domain prediction. Numerous studies have documented structurally diverse cyclic peptides and polyketides from marine Bacillus species, including bogorol A, tupuseleiamides, basiliskamides, loloatin B, and bacillistatins (Barsby et al., 2001; Gerard et al., 1996; Pettit et al., 2009). Additional cytotoxic and acylpeptide compounds, such as halobacillin and related cyclic peptides, further illustrate the biosynthetic capacity of marine Bacillus isolates (Trischman et al., 1994; Zhang et al., 2004). The forest plot patterns support the interpretation that hybrid systems are less common than canonical PKS or NRPS clusters, but when present, they may contribute disproportionately to the biosynthetic repertoire of marine microbes.
Cyanobacteria exhibited the highest variability in NRPS domain abundance, as reflected in the forest plots. Some studies reported abundant C domains, particularly in filamentous genera known for producing peptide metabolites, while other studies detected relatively low frequencies. This pattern reflects ecological specificity and niche adaptation. The forest plots also highlighted the presence of novel, uncharacterized domains in several studies, underscoring the importance of metagenomic approaches in uncovering biosynthetic potential beyond cultured representatives. Environmental shotgun sequencing studies have emphasized how unexplored marine microbial communities harbor extensive genetic novelty (Venter et al., 2004).
Funnel plots were instrumental in assessing potential publication bias and small-study effects. Potential publication bias was assessed using funnel plots (Figure 5). Visual inspection suggested slight asymmetry, particularly for NRPS domains in Bacillus and
Cyanobacteria, where smaller studies tended to report higher domain abundances. This may reflect a tendency for studies reporting novel or abundant biosynthetic clusters to be preferentially published, particularly those describing bioactive metabolites from marine Bacillus species (Barsby et al., 2002; Gao et al., 2010). Nevertheless, the overall distribution of effect sizes across studies did not indicate extreme bias, supporting the reliability of the meta-analytic estimates for PKS and NRPS prevalence in marine microbes.
Integration of forest and funnel plot findings provides insights into both ecological and methodological factors shaping observed biosynthetic diversity. Forest plots demonstrated that consistent patterns of domain abundance emerged in well-characterized taxa such as coastal Proteobacteria, whereas more variable patterns were observed in taxa with fewer representative studies or complex symbiotic associations. Funnel plots complemented this interpretation by highlighting potential publication bias in smaller studies, which may inflate the perceived abundance of rare or hybrid biosynthetic
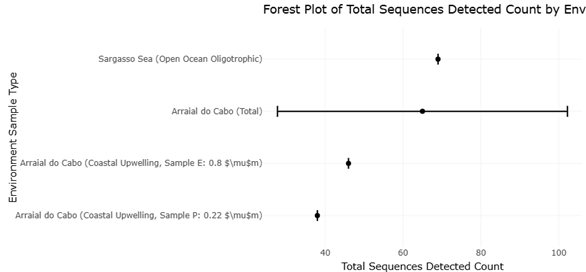
Figure 4. Comparative Metagenomic Detection of PKS and NRPS Domains Across Marine Environments. This figure compares the success of metagenomic screening for PKS and NRPS domains across coastal upwelling and oligotrophic open-ocean environments. Relative detection rates are contextualized by total ORFs screened.
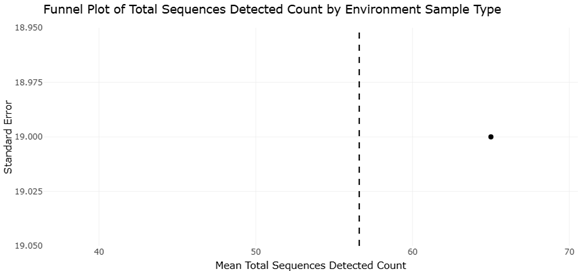
Figure 5. Funnel Plot Assessing Publication Bias in PKS and NRPS Meta-Analyses. This funnel plot evaluates potential publication bias and small-study effects in studies reporting PKS and NRPS domain abundance. Asymmetry indicates mild bias in NRPS-focused studies, while PKS studies show symmetrical distribution.
clusters. Together, these visualizations reinforced the conclusion that biosynthetic potential is both taxon- and habitat-dependent, and that systematic aggregation of metagenomic data can reveal underlying patterns not apparent in individual studies.
The plots also allowed for the identification of potential correlations between environmental factors and biosynthetic domain prevalence. For instance, studies of Proteobacteria in nutrient-rich sediment habitats showed higher PKS domain abundance, consistent with competitive interactions reported in aggregate-associated marine bacterial communities (Grossart et al., 2004). Conversely, in oligotrophic pelagic zones, NRPS domain detection was more sporadic, reflecting either lower genomic prevalence or technical challenges in metagenomic assembly from low-biomass samples. These ecological contrasts further support previous findings that upwelling-influenced marine systems display enhanced biosynthetic domain diversity (Cuadrat et al., 2015).
Furthermore, forest plots highlighted the contribution of hybrid NRPS-PKS clusters to overall biosynthetic diversity. Although rare, these clusters were consistently associated with certain symbiotic Cyanobacteria and Proteobacteria strains. The evolutionary and ecological significance of such clusters is supported by documented secondary metabolite production within Roseobacter and related marine clades (Martens et al., 2007). The meta-analysis, therefore, provides a quantitative basis for targeted bioprospecting, guiding researchers toward taxa and habitats with the highest likelihood of yielding novel bioactive compounds.
The combined interpretation of forest and funnel plots supports several key findings: (1) Proteobacteria dominate PKS domain prevalence across marine habitats; (2) NRPS domains exhibit higher variability, particularly in Cyanobacteria; (3) hybrid NRPS-PKS clusters, while rare, may have disproportionate impact on biosynthetic potential; (4) publication bias is minimal but detectable in smaller studies; and (5) ecological factors, including habitat type and nutrient availability, influence the distribution of biosynthetic domains. These insights emphasize the value of systematic meta-analysis and visual data synthesis in uncovering patterns of microbial secondary metabolism and guiding future exploration of marine natural products.
The statistical analysis conducted in this systematic review and meta-analysis was designed to quantitatively synthesize findings on the prevalence of biosynthetic gene clusters (BGCs), particularly Polyketide Synthase (PKS) and Nonribosomal Peptide Synthetase (NRPS) domains, across diverse marine microbial taxa. Data from the included studies were extracted and harmonized to calculate effect sizes representing the proportion of each taxon’s genome or metagenome encoding these biosynthetic domains. Heterogeneity across studies was assessed using the I² statistic, and pooled effect sizes were estimated using random-effects models, consistent with recommendations for meta-analyses with diverse study designs and ecological contexts.