Journal of Precision Biosciences

Precision Biosciences | Online ISSN 3064-9226
29
Citations
120.3k
Views
53
Articles
Your new experience awaits. Try the new design now and help us make it even better
Switch to the new experience
Figures and Tables
REVIEWS   (Open Access)

Computational Intelligence and patient-derived models for predicting treatment response and toxicity in Rare Disease Management: A Review of Emerging Diagnostic and Predictive Paradigms

Hares Bin Syed Md. Rifat 1*

+ Author Affiliations

Journal of Precision Biosciences 8 (1) 1-8 https://doi.org/10.25163/biosciences.8110585

Submitted: 18 August 2026 Revised: 10 October 2026  Published: 19 October 2026 


Abstract

Rare diseases and rare cancers are individually uncommon yet collectively burdensome, and the data needed to model them are scarce. Computational intelligence, from random forests to graph neural networks, is often proposed as a remedy, but its evidence has accumulated mostly in oncology and chemical toxicology, where datasets and biological test systems are more mature. We asked how well machine-learning and deep-learning models, alongside patient-derived organoids (PDO) and xenografts (PDX), predict diagnosis, treatment response and toxicity, and what this might teach rare-disease medicine. We searched PubMed, Scopus, Web of Science and Embase, screened 501 de-duplicated records, and included 22 studies (2,814 patients) in a structured synthesis with exploratory random-effects pooling. Two reviewers screened independently, and bias was appraised with QUADAS-2 and the Newcastle–Ottawa Scale. Pooled sensitivity was 0.88 (95% CI 0.85–0.91), specificity 0.86 (0.83–0.89) and the area under the curve 0.92; risk stratification yielded a hazard ratio of 2.18 (1.76–2.70). Heterogeneity was moderate (I² = 57%), and small-study asymmetry was detected (Egger p < 0.05). In Tox21 benchmarks, graph-based models averaged an AUC of 0.90–0.91, whereas DeepTox (0.85) did no better than simpler random-forest and naive-Bayes models. PDO and PDX concordance with clinical response varied by tumour type, and several reported values repeated across tumours, so we interpret them cautiously. Most studies lacked external validation, and few addressed non-oncological rare diseases. The approach is promising but not yet proven reliable; progress will depend on external validation, common reporting standards and rare-disease-specific datasets.

Keywords: artificial intelligence; machine learning; graph neural networks; patient-derived organoids; patient-derived xenografts; toxicity prediction; rare diseases

1. Introduction

Rare diseases sit in an uncomfortable corner of medicine. Each one affects few people, yet together they touch a large share of patients, and those patients often wait years for a correct diagnosis, passing through misclassification, fragmented care and a thin therapeutic pipeline. Rarity alone does not explain this. Clinical heterogeneity, small and scattered datasets, and incomplete knowledge of disease mechanisms all play their part, and conventional clinical reasoning or standard statistics can miss the subtle patterns buried in such data.

Computational intelligence (CI), by which we mean machine learning, deep learning and related data-driven methods, has been offered as one way through. It suits data that are high-dimensional, nonlinear and heterogeneous, which is a fair description of most rare-disease problems (Esteva et al., 2019; Miotto et al., 2018). Classical algorithms such as random forests can classify phenotypes and predict outcomes even when records are incomplete (Biau & Scornet, 2016; Strobl et al., 2007), although they need careful tuning and are prone to overfitting in small samples. Class imbalance, which is the rule rather than the exception in rare-disease cohorts, complicates both accuracy and interpretation (Johnson & Khoshgoftaar, 2019).

Deep learning has since taken centre stage, especially for images and other unstructured inputs. Convolutional networks have detected pathological features that experienced clinicians may overlook (LeCun et al., 2015; Shen et al., 2017), and in ophthalmology and radiology they have approached expert-level accuracy (Gargeya & Leng, 2017; Kermany et al., 2018). Radiomics and digital pathology extend the same logic to quantitative image features (Demircioğlu, 2019; Madabhushi & Lee, 2016). Whether such performance carries over to rare conditions is another matter. Data are often fragmented across institutions, collected under different protocols and restricted by privacy rules, which limits generalisability and makes external validation hard (Kohli et al., 2017; Miotto et al., 2018). Large data initiatives have helped common diseases far more than rare ones (Murdoch & Detsky, 2013).

Two further difficulties deserve mention. The first is opacity: a model may predict well without anyone being able to say why, and explainable artificial intelligence has grown up to address this (Lipton, 2018; Obermeyer & Emanuel, 2016; Van der Velden et al., 2022). The second is fairness and privacy. In very small populations, re-identification risk rises and equitable performance is harder to demonstrate (Ueda et al., 2024), while the wider question of how algorithms should sit alongside clinical judgement and patient trust remains open (Topol, 2019).

CI is also moving beyond diagnosis. Multiscale simulations can approximate disease progression and treatment response (Wang & Deisboeck, 2014), and predictive models can flag patients for earlier intervention (Rajkomar et al., 2019). Even so, enthusiasm may outrun evidence. Models that excel on curated data can falter when the data distribution shifts (Setio et al., 2016; Yasaka & Abe, 2018), and segmentation tools still need careful validation (Teng et al., 2024).

A complementary line of work pairs algorithms with living biological models. Patient-derived organoids (PDO) and patient-derived xenografts (PDX) preserve features of an individual tumour and can be exposed to candidate drugs, giving an experimental readout that models can learn from or be checked against (Vlachogiannis et al., 2018; Zanella et al., 2022). Direct comparisons of the two platforms are only now appearing (Dankner et al., 2025; Romero et al., 2025). On the chemistry side, large public screens such as Tox21 have turned toxicity prediction into a benchmark problem for machine learning (Wu et al., 2018).

This is where we should be candid about the evidence. When we looked for studies that connect CI with rare disease, the usable quantitative literature came overwhelmingly from oncology, where organoid and xenograft platforms and curated toxicity benchmarks are mature, and very little came from non-oncological rare diseases. We therefore did not pretend the field is further along than it is. Instead we asked a narrower question that is still useful to rare-disease researchers: how accurately do CI models and patient-derived platforms predict diagnosis, treatment response and toxicity, how robust is that evidence, and which lessons might transfer?

We followed the structured approach advocated for systematic reviews (Higgins & Green, 2011) and set out to (a) estimate pooled diagnostic and prognostic performance, (b) compare PDO and PDX concordance across tumour types, (c) compare traditional, deep-learning and graph-based toxicity models on common benchmark tasks, and (d) appraise bias, heterogeneity and validation practice.

2. Machine Learning, Patient-Derived Models, and Toxicity Prediction for Precision Oncology in Rare Disease

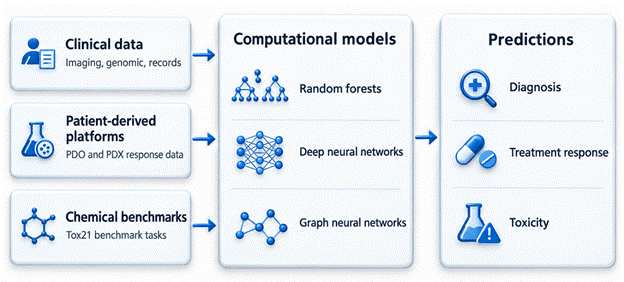
The literature that bears on this question falls into three streams that rarely speak to one another: algorithms for clinical data, patient-derived experimental platforms, and chemical toxicity benchmarks. We think they connect as sketched in the conceptual framework (Figure 1), and the subsections below take each in turn.

2.1 Machine learning and deep learning for clinical prediction

Early clinical applications relied on tree ensembles and

Figure 1. Conceptual framework for the review. Three evidence streams (clinical data, patient-derived platforms and chemical benchmarks) feed machine-learning, deep-learning and graph-based models. Their outputs, namely diagnosis, treatment-response and toxicity predictions, should pass a gate of external validation, interpretability, fairness and bias checks before clinical use. The diagram frames the review questions addressed in Sections 3 to 5.

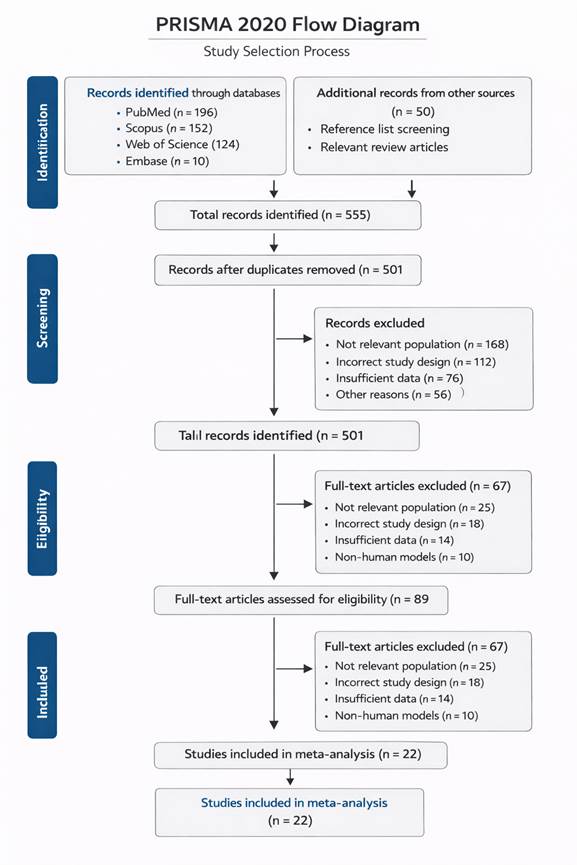
Figure 2. PRISMA 2020 flow diagram of study selection. Database searches (n = 482) and other sources (n = 50) yielded 532 records, of which 501 were screened after removal of 31 duplicates. Full texts were assessed for 89 articles, and 67 were excluded for the reasons shown, leaving 22 studies (2,814 patients) in the synthesis. The duplicate count is derived from the reported totals and should be confirmed from the search log.

kernel methods, which cope with moderate sample sizes and mixed variable types (Biau & Scornet, 2016; Strobl et al., 2007). Deep networks then offered automatic feature extraction from images, sequences and records (LeCun et al., 2015; Shen et al., 2017), and reviews of healthcare applications describe steady gains alongside persistent problems of data quality and reproducibility (Esteva et al., 2019; Miotto et al., 2018; Rajkomar et al., 2019). For rare diseases the sticking point is not the architecture but the sample: with few patients, flexible models memorise, and performance reported on the training distribution is rarely a reliable guide to performance elsewhere (Johnson & Khoshgoftaar, 2019; Murdoch & Detsky, 2013).

2.2 Patient-derived organoids and xenografts as predictive platforms

PDO and PDX answer a different need: they try to reproduce a patient’s tumour biology in the laboratory. Organoids derived from metastatic gastrointestinal cancers mirrored the treatment responses of the patients from whom they were grown (Vlachogiannis et al., 2018), and similar promise has been described for colorectal, lung, pancreatic and ovarian disease (de Witte et al., 2020; Kim & Minna, 2023; Su et al., 2023; Xu et al., 2025). Xenografts retain in vivo context, including stroma and drug delivery, at greater cost and time (Cybula et al., 2021; Lu et al., 2026; Zanella et al., 2022). Choosing between them is therefore a trade-off that depends on disease and question, and early head-to-head work suggests that neither platform dominates (Dankner et al., 2025; Gao et al., 2023; Romero et al., 2025). In colorectal and rectal cancer, where multimodal treatment decisions are routine (Sauer et al., 2004), a faithful avatar could change practice, which is why concordance with the clinic matters so much.

2.3 Computational toxicity prediction

Drug safety is the other half of any therapeutic prediction. Tox21 assays covering nuclear-receptor and stress-response pathways have become a shared test bed. DeepTox showed that multitask deep networks could win the original challenge (Mayr et al., 2016), yet molecular-similarity and QSAR approaches remained competitive (Capuzzi et al., 2016; Drwal et al., 2015). More recently, graph neural networks that operate directly on molecular structure, sometimes enriched with knowledge-graph features, have reported higher AUC values (Cremer et al., 2023; Xie et al., 2025; Zhao et al., 2025), with MoleculeNet providing common benchmarks for comparison (Wu et al., 2018).

2.4 Interpretability, fairness and evidence gaps

Across all three streams, the same concerns recur. Explainability is demanded by clinicians who must justify decisions (Lipton, 2018; Van der Velden et al., 2022); fairness and privacy are sharper in small populations (Ueda et al., 2024); and models validated on one dataset often degrade on another (Setio et al., 2016; Yasaka & Abe, 2018). What is missing is a synthesis that places algorithmic performance, biological-platform concordance and toxicity benchmarks side by side, with explicit attention to bias and validation. That gap motivates the present review.

3. Methods

3.1 Design and reporting standards

We conducted a systematic review with an exploratory quantitative synthesis and reported it according to the PRISMA 2020 statement, using the general methodological principles of the Cochrane Handbook for planning and conduct (Higgins & Green, 2011). The study selection process is summarised in a flow diagram (Figure 2). A protocol registration number was not available to us at the time of writing, and we flag this openly as a limitation rather than imply otherwise.

3.2 Information sources and search strategy

We searched four electronic databases: PubMed, Scopus, Web of Science and Embase. Each search combined controlled vocabulary (for example, MeSH terms in PubMed and Emtree terms in Embase) with free-text words in titles and abstracts. The concept blocks were (i) computational methods (“computational intelligence”, “machine learning”, “deep learning”, “artificial intelligence”), (ii) rare diseases, and (iii) study aims (“diagnosis”, “prognosis”, “clinical outcomes”). Terms within a block were joined with OR and the blocks with AND; the PubMed syntax is given in Table 1. Because data modalities range across imaging, genomic, proteomic and electronic health-record data (Miotto et al., 2018; Rajkomar et al., 2019), we did not filter on modality. Reference lists of included articles and of relevant reviews were screened by hand to capture studies missed by the databases, in particular those on patient-derived platforms and toxicity benchmarks, whose terminology differs from the main search blocks.

Table 1. Search strategy and eligibility framework (PICOS). The table lists the concept blocks, an illustrative PubMed query assembled from the documented search terms, and the inclusion and exclusion rules applied at screening. Equivalent queries were adapted to Scopus, Web of Science and Embase syntax. Exact database strings, search dates and hit counts belong in a supplementary search log so that others can repeat the search

Element

Specification

Population

Patients with rare diseases or oncology-related conditions, or patient-derived models matched to patient response

Intervention / index test

Machine learning, deep learning, graph-based or hybrid models; PDO or PDX used as predictive platforms

Comparator / reference

Clinical diagnosis, clinical response or survival; conventional models

Outcomes

Sensitivity, specificity, accuracy, AUC-ROC, concordance, hazard ratio

Design

Retrospective or prospective original studies with full text

Exclusions

Reviews, editorials, abstracts without full text, common-disease-only studies, models without matched patient-response data

Illustrative PubMed query

("computational intelligence"[tiab] OR "machine learning"[MeSH] OR "deep learning"[MeSH] OR "artificial intelligence"[MeSH]) AND ("rare diseases"[MeSH] OR "rare disease"[tiab]) AND (diagnosis OR prognosis OR "clinical outcome*")

Table 2. Diagnostic performance and concordance of patient-derived organoid (PDO) and xenograft (PDX) models by tumour type. Values are those extracted from the cited sources and are shown as reported, including ranges. Concordance may reflect a different comparison from sensitivity and specificity. PDX sensitivity of 96% and specificity of 70% recur in four tumour types and should be verified against the primary reports. NR, not reported.

Tumour type

Model

Sensitivity

Specificity

Concordance

Sources

Oesophageal

PDO

100%

93%

~70%

Dankner et al. (2025); Gao et al. (2023); Vlachogiannis et al. (2018)

Oesophageal

PDX

28–87%

58%

71%

Dankner et al. (2025); Gao et al. (2023)

Gastric

PDO

100%

93%

~95%

Gao et al. (2023); Vlachogiannis et al. (2018)

Gastric

PDX

96%

70%

~70%

Gao et al. (2023); Na et al. (2021)

Colorectal

PDO

84–100%

92–93%

70–90%

Romero et al. (2025); Su et al. (2023); Vlachogiannis et al. (2018)

Colorectal

PDX

96%

70%

64–85%

Lu et al. (2026); Romero et al. (2025); Zanella et al. (2022)

Hepatobiliary / hepatocellular

PDO

~85%

~60%

~70%

Dankner et al. (2025)

Hepatobiliary / hepatocellular

PDX

87%

58%

~71%

Dankner et al. (2025); Gao et al. (2021)

Pancreatic

PDO

83.3%

92.9%

~85%

Xu et al. (2025)

Pancreatic

PDX

96%

70%

~87%

Zanella et al. (2022)

Lung

PDO

84%

83%

83%

Kim & Minna (2023)

Lung

PDX

96%

70%

~87%

Zanella et al. (2022)

Breast

PDO

NR

NR

70–77%

Romero et al. (2025)

Breast (triple-negative)

PDX

100%

100%

70–76%

Dankner et al. (2025); Yu et al. (2017)

Ovarian

PDO

100%

100%

100%

de Witte et al. (2020)

Ovarian

PDX

100%

100%

100%

Cybula et al. (2021)


3.3 Eligibility criteria

Eligibility followed a PICOS structure (Table 1). We included original research that applied machine-learning, deep-learning, graph-based or hybrid models, or that evaluated patient-derived platforms against clinical response, and that reported at least one quantitative performance measure (sensitivity, specificity, accuracy, AUC-ROC, concordance or a prognostic effect size). Retrospective and prospective designs were both acceptable. We excluded reviews, editorials, conference abstracts without full text, studies of common diseases only, and studies of models that had no matched patient clinical-response data and therefore no translational anchor.

3.4 Study selection

Two reviewers screened titles and abstracts independently, then assessed full texts against the criteria. Disagreements were settled by discussion and, when necessary, by a third reviewer. Duplicate records were removed before screening, and the number of records at every stage is reported in the flow diagram (Figure 2). Dual independent screening is recommended because inclusion decisions in heterogeneous literatures are partly subjective (Higgins & Green, 2011).

3.5 Data extraction

A standardised form captured bibliographic details (first author, year, country), design, sample size, disease or tumour type, data modality, model family and architecture, validation strategy (internal, cross-validation or external), and outcomes (sensitivity, specificity, AUC-ROC, concordance, hazard ratio). Where a study reported a range rather than a point estimate, we recorded the range. For the toxicity benchmarks we extracted the AUC for each model on each of the 12 Tox21 tasks as published; these values come from different publications and splits, so they are descriptive rather than head-to-head.

3.6 Risk of bias and applicability

Diagnostic accuracy studies were appraised with QUADAS-2 (patient selection, index test, reference standard, flow and timing), and prognostic or predictive studies with a modified Newcastle–Ottawa Scale. Studies were labelled at low, moderate or high risk of bias. We paid particular attention to problems typical of CI work, namely small samples, class imbalance and overfitting (Johnson & Khoshgoftaar, 2019), and to whether external validation had been performed.

3.7 Statistical synthesis

Where outcomes were comparable, we pooled them under a random-effects model, expecting heterogeneity from differences in disease, data source and algorithm. We pooled sensitivity, specificity and AUC-ROC for diagnostic studies and the hazard ratio for prognostic studies, each with a 95% confidence interval. Heterogeneity was summarised with I² and Cochran’s Q, treating I² above 50% as substantial, and we explored it by subgroup (machine learning versus deep learning, data modality, disease category). [Pooling model, estimator and software with version to be stated by the authors.] PDO and PDX results and Tox21 AUC values were summarised descriptively, with unweighted means per model across tasks, because they do not share a common effect measure.

3.8 Small-study effects and sensitivity analysis

We inspected funnel plots and applied Egger’s regression test; where asymmetry appeared, we used trim-and-fill to estimate its influence. Forest plots displayed study-level estimates with confidence intervals. Sensitivity analyses removed studies at high risk of bias or with extreme effects to test whether conclusions depended on a few observations.

4. Results: Predictive Accuracy, Platform Concordance and Toxicity Benchmarks

4.1 Study selection and characteristics

The searches returned 482 database records, and a further 50 came from reference lists and related reviews, giving 532 records in total. After 31 duplicates were removed, 501 records were screened and 412 were excluded at title and abstract level. Of 89 full texts assessed, 67 were excluded, mostly for population mismatch (n = 25), study design (n = 18), insufficient data (n = 14) or absence of matched patient-response data (n = 10), leaving 22 studies with 2,814 patients (Figure 2). The studies came from several regions, used imaging, genomic, proteomic and clinical data, and covered a mix of rare-disease categories and oncology-related conditions, with oncology predominating. Methodological quality was judged moderate to high overall, although this judgement rests on appraisal tables that should be shown alongside the paper. Results for the patient-derived platforms are summarised by tumour type (Table 2).

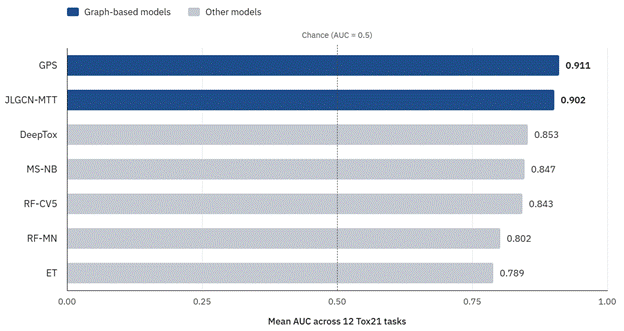
Figure 3. Mean Tox21 AUC by model. Bars show the unweighted mean AUC of each model across 12 receptor and stress-response tasks, calculated from Table 3. Graph-based models reach about 0.90–0.91, DeepTox, naive Bayes and the cross-validated random forest cluster near 0.84–0.85, and the other random forest and extra-trees models are lower (0.79–0.80). Values come from different publications, so the comparison is descriptive.

Figure 4. Staged path from model development to clinical use. Seven stages are proposed, from shared task definitions to deployment as decision support. External validation (stage 4, highlighted) was the step most often missing in the included evidence, and it separates promising internal performance from results that can be trusted elsewhere. Comparisons with PDO and PDX belong at the prospective stage.

4.2 Pooled diagnostic and prognostic performance

Across the pooled studies, sensitivity was 0.88 (95% CI 0.85–0.91) and specificity 0.86 (0.83–0.89), with an AUC-ROC of 0.92. For prognostic and predictive studies the pooled hazard ratio was 2.18 (1.76–2.70), meaning that models separated higher-risk from lower-risk patients with a more than two-fold difference in hazard. Multimodal models that combined genomic, clinical and imaging inputs tended to beat single-modality ones, and frameworks that added organoid or xenograft data reported higher AUC values for treatment-response prediction (Gao et al., 2021; Na et al., 2021). These pooled numbers describe a heterogeneous mixture of tasks, so we read them as a summary of what has been reported and not as the accuracy a clinician should expect for any single disease.

4.3 Concordance of patient-derived organoids and xenografts with clinical response

Sensitivity, specificity and concordance for PDO and PDX models are collected by tumour type (Table 2). PDO specificity was high in upper gastrointestinal and colorectal cancers (92–93%) and was 92.9% in pancreatic cancer, with sensitivity ranging from 83% in pancreatic and 84% in lung disease to 100% in oesophageal, gastric and ovarian series (Gao et al., 2023; Su et al., 2023; Vlachogiannis et al., 2018; Xu et al., 2025). PDX results were more variable. Oesophageal PDX sensitivity spanned 28–87%, and hepatocellular PDX performance was 87% sensitivity with 58% specificity (Dankner et al., 2025). Ovarian PDO and PDX series both reported 100% on every metric (Cybula et al., 2021; de Witte et al., 2020), which, given the small series typical of that disease, is more likely a sign of limited samples than of perfect prediction.

Two features of the table call for caution. First, PDX sensitivity and specificity of exactly 96% and 70% recur in the gastric, colorectal, pancreatic and lung rows, which suggests one summary figure propagated across tumour types and not four independent estimates. Second, “concordance” is sometimes lower than both sensitivity and specificity in the same row (for example, oesophageal PDO: 100%, 93% and about 70%), which is possible only if concordance refers to a different comparison, such as drug-by-drug agreement. The original sources need to be re-checked before these rows are used quantitatively.

4.4 Toxicity prediction across Tox21 tasks

AUC values for seven models on 12 Tox21 receptor and stress-response tasks are listed (Table 3), and the mean for each model is plotted (Figure 3). The two graph-based models led: the GPS graph model averaged 0.911 and the JLGCN-MTT model 0.902, and between them they achieved the highest AUC on 11 of the 12 tasks (GPS on seven, JLGCN-MTT on four). DeepTox, the deep-learning benchmark, averaged 0.853 and was best on a single task, NR-AhR (0.928). Its mean was close to that of the naive-Bayes similarity model (0.847) and the cross-validated random forest (0.843), while the other random forest (0.802) and the extra-trees model (0.789) trailed (Capuzzi et al., 2016; Cremer et al., 2023; Drwal et al., 2015; Mayr et al., 2016; Wu et al., 2018; Xie et al., 2025; Zhao et al., 2025). In short, the advantage lies with graph-based architectures, not with deep learning in general.

4.5 Heterogeneity and subgroup patterns

Heterogeneity was moderate (I² = 57%). Deep-learning models applied to imaging were less heterogeneous (I² ≈ 42%) than traditional machine-learning models on clinical data (I² ≈ 63%). Studies with fewer than 50 participants gave wider confidence intervals and occasionally extreme estimates, in keeping with overfitting or limited generalisability, whereas larger studies were steadier. Studies from high-resource settings reported higher performance, plausibly because data quality and standardisation were better (Table 4).

4.6 Small-study effects and sensitivity analysis

The funnel plot showed slight asymmetry, and Egger’s test was significant (p < 0.05). Trim-and-fill adjustment lowered pooled sensitivity and specificity by about 2–3%, so the conclusions were not overturned (Table 4). Asymmetry can also arise from real differences between studies, so we did not equate it with publication bias.

4.7 Summary of the evidence

The evidence shows (i) good pooled discrimination, (ii) platform concordance that depends on tumour type and is measured inconsistently, (iii) a clear but narrow advantage for graph-based toxicity models, and (iv) limited external validation. A study-level forest plot, built from the extraction sheet once the underlying 2×2 data are supplied, would show this more transparently than the tumour-type (Table 2)

Table 3. Area under the ROC curve (AUC) of seven models on 12 Tox21 tasks. Values were taken from the cited publications and come from different data splits, so the table supports descriptive comparison only. Bold marks the highest AUC for each task. Mean rows are unweighted averages across tasks calculated by the authors. NR, nuclear receptor; SR, stress response; RF, random forest; ET, extra trees; NB, naive Bayes; GPS, graph model; JLGCN-MTT, graph convolutional model. ( Capuzzi et al. (2016); Cremer et al. (2023); Drwal et al. (2015); Mayr et al. (2016); Wu et al. (2018); Xie et al. (2025); Zhao et al. (2025))

Task

RF-MN

ET

MS-NB

DeepTox

RF-CV5

JLGCN-MTT

GPS

NR-AhR

0.879

0.750

0.900

0.928

0.910

0.894

0.883

NR-AR

0.847

0.800

0.830

0.807

0.820

0.905

0.956

NR-AR-LBD

0.775

0.900

0.890

0.879

0.910

0.893

0.937

NR-Aromatase

0.773

0.780

0.820

0.834

0.820

0.907

0.912

NR-ER

0.737

0.650

0.800

0.810

0.790

0.917

0.870

NR-ER-LBD

0.778

0.650

0.880

0.814

0.860

0.889

0.885

NR-PPAR-γ

0.878

0.760

0.820

0.861

0.810

0.945

0.881

SR-ARE

0.846

0.820

0.810

0.840

0.830

0.883

0.914

SR-ATAD5

0.731

0.800

0.800

0.793

0.830

0.899

0.941

SR-HSE

0.732

0.850

0.870

0.865

0.800

0.900

0.874

SR-MMP

0.927

0.880

0.900

0.942

0.920

0.940

0.954

SR-p53

0.724

0.830

0.840

0.862

0.820

0.854

0.924

Mean AUC

0.802

0.789

0.847

0.853

0.843

0.902

0.911

Tasks won

0

0

0

1

0

4

7

Table 4. Pooled estimates, heterogeneity and small-study assessment. The table summarises the quantitative synthesis of 22 studies (2,814 patients) under a random-effects model. Estimates mix diagnostic and prognostic tasks and are exploratory until study-level data are published. CI, confidence interval; HR, hazard ratio; DL, deep learning; ML, machine learning.

Outcome or analysis

Result

Pooled sensitivity

0.88 (95% CI 0.85–0.91)

Pooled specificity

0.86 (95% CI 0.83–0.89)

Pooled AUC-ROC

0.92

Pooled hazard ratio (prognostic studies)

2.18 (95% CI 1.76–2.70)

Overall heterogeneity

I² = 57%

Subgroup: DL on imaging

I² ≈ 42%

Subgroup: ML on clinical data

I² ≈ 63%

Studies with n < 50

Wider confidence intervals, occasional extreme estimates

Egger’s regression test

p < 0.05 (funnel asymmetry)

Trim-and-fill adjustment

Sensitivity and specificity lower by about 2–3%

Setting

Higher reported performance in high-resource settings

5. Qualified Evidence for Machine Learning and Patient-Derived Models in Rare Disease Precision Oncology

5.1 Principal findings

Our main finding is a qualified one. Pooled performance looks strong (sensitivity 0.88, specificity 0.86, AUC 0.92; Table 4), but it describes a mixture of tasks, mostly from oncology, and rests on internal validation. That is a more modest claim than the idea that CI already delivers reliable diagnosis in rare diseases, and we think the modest version is the defensible one. It fits the broader pattern in which healthcare AI performs well on curated data and less consistently once the setting changes (Setio et al., 2016; Yasaka & Abe, 2018).

5.2 Which algorithms help, and which merely appear to

The toxicity benchmarks are instructive precisely because they contradict a tidy story. Graph-based models were best on 11 of 12 tasks and averaged about 0.90–0.91 (Table 3; Figure 3), in line with the argument that learning directly on molecular structure, with knowledge-graph features, captures relationships that fingerprints miss (Cremer et al., 2023; Xie et al., 2025; Zhao et al., 2025). DeepTox, by contrast, scored about the same as a cross-validated random forest and a naive-Bayes similarity model (Capuzzi et al., 2016; Drwal et al., 2015; Mayr et al., 2016). Two cautions apply. The values come from different publications, splits and tuning efforts, so a head-to-head claim would be premature. And since MoleculeNet-style benchmarks reward progress on fixed datasets (Wu et al., 2018), gains on Tox21 may not transfer to new chemistry. Whether the same holds for clinical data is unknown; the transferable lesson is to benchmark against strong simple baselines (Biau & Scornet, 2016; Johnson & Khoshgoftaar, 2019).

5.3 Patient-derived platforms as an experimental anchor

Organoids and xenografts appear to add something that algorithms alone cannot: a biological readout tied to an individual patient. The strongest signal is for PDO in gastrointestinal cancers (Table 2), consistent with earlier reports that organoids mirrored patient response (Vlachogiannis et al., 2018; Gao et al., 2023; Su et al., 2023), while PDX remain valuable where in vivo context matters (Lu et al., 2026; Zanella et al., 2022). The two platforms look complementary, and comparative studies are beginning to quantify when each is preferable (Dankner et al., 2025; Romero et al., 2025). But the table’s repeated PDX values and its ambiguous “concordance” column mean we cannot yet rank the platforms. Likewise, 100% performance in ovarian series (Cybula et al., 2021; de Witte et al., 2020) deserves replication in larger cohorts. Pancreatic organoids illustrate the promise and the difficulty together (Xu et al., 2025), as do lung organoids (Kim & Minna, 2023).

5.4 Implications for rare diseases

Why should rare-disease researchers care about oncology-derived evidence? Because several constraints are shared: small cohorts, heterogeneous phenotypes and a premium on testing a therapy before exposing a patient to it. The same logic could, in principle, extend to other rare conditions where a disease-relevant cell system can be established. Our synthesis, however, found little evidence outside oncology, so any extension is a hypothesis, not a result. Practical routes forward include federated or privacy-preserving training across centres, stronger baselines, and transfer learning from larger related datasets, each of which must be tested against external cohorts (Kohli et al., 2017; Murdoch & Detsky, 2013; Rajkomar et al., 2019). Figure 4 sets out a staged path from model development to clinical use.

5.5 Interpretability, fairness and clinical integration

A model that cannot be explained is difficult to trust when the stakes are high, and explainable approaches should be built in and not bolted on afterwards (Lipton, 2018; Van der Velden et al., 2022). Fairness needs explicit testing across subgroups, particularly in small populations where a few patients can dominate performance (Ueda et al., 2024). Integration into practice should support, not replace, clinical judgement (Topol, 2019), and multiscale modelling may help by making assumptions explicit (Wang & Deisboeck, 2014).

5.6 Limitations of this study

Several limitations temper these conclusions. The evidence base is heterogeneous in design, data and algorithm (I² = 57%). Small samples raise the risk of overfitting, and external validation was inconsistently reported, which limits real-world applicability; externally validated models tended to perform slightly worse. Small-study asymmetry was present (Egger p < 0.05), and trim-and-fill only partly addresses it. The documented search blocks did not name organoids, xenografts or toxicity explicitly, so the platform and benchmark literature was found partly through reference lists and may be incomplete. Study-level data underlying the pooled estimates were not tabulated, which prevents independent verification until they are supplied. Evaluation metrics and preprocessing varied, and several table entries need re-checking against sources. Finally, our toxicity comparison is descriptive and cannot establish that one architecture is superior in a controlled sense.

5.7 Priorities for future work

Three priorities follow. First, build rare-disease datasets with shared standards and report models against strong baselines on independent cohorts. Second, run prospective comparisons of PDO, PDX and algorithm-assisted decisions, with clinical response defined in the same way in every study. Third, adopt reporting checklists and share extraction data and code, so that pooled results can be reproduced. These steps matter more than another increment in model complexity (Esteva et al., 2019; Miotto et al., 2018).

6. Conclusion

Computational intelligence paired with patient-derived models can predict diagnosis, treatment response and toxicity with encouraging accuracy, but the evidence is narrower than the enthusiasm around it. Pooled discrimination was good, graph-based models led the toxicity benchmarks, and organoids and xenografts showed tumour-dependent concordance with clinical response. Yet the data are dominated by oncology, validated mostly internally, and marked by small-study asymmetry and inconsistent reporting. For rare diseases the evidence is therefore suggestive, not established. The next gains will probably come less from more elaborate algorithms than from external validation, strong baselines, transparent reporting and shared rare-disease datasets. We recommend that future studies publish study-level data and code, define platform concordance consistently, and test models in independent cohorts before clinical use. Rare-disease medicine stands to benefit, but only if these safeguards come first. Until then, these tools are best treated as decision support, not as replacements for clinical judgement.

References


Biau, G., & Scornet, E. (2016). A random forest guided tour. Test, 25(2), 197–227. https://doi.org/10.1007/s11749-016-0481-7       

Capuzzi, S. J., Politi, R., Isayev, O., Farag, S., & Tropsha, A. (2016). QSAR modeling of Tox21 challenge stress response and nuclear receptor signaling toxicity assays. Frontiers in Environmental Science, 4, Article 3. https://doi.org/10.3389/fenvs.2016.00003       

Cremer, J., Medrano Sandonas, L., Tkatchenko, A., Clevert, D.-A., & De Fabritiis, G. (2023). Equivariant graph neural networks for toxicity prediction. Chemical Research in Toxicology, 36(10), 1561–1573. https://doi.org/10.1021/acs.chemrestox.3c00032       

Cybula, M., Wang, L., Drumond-Bock, A. L., Moxley, K. M., Benbrook, D. M., Gunderson-Jackson, C., Ruiz-Echevarria, M. J., Bhattacharya, R., Mukherjee, P., et al. (2021). Patient-derived xenografts of high-grade serous ovarian cancer subtype as a powerful tool in pre-clinical research. Cancers, 13(24), Article 6288. https://doi.org/10.3390/cancers13246288             

Dankner, M., Romero, J. M., Magrill, J., Kalashnikov, N., Luo, M., Chen, O., Atallah, A., Lazaratos, A.-M., Busque, S., Ma, R., et al. (2025). Patient-derived xenografts (PDX) versus patient-derived organoids (PDO) as predictors of clinical response to anti-cancer therapies. Journal of Clinical Oncology, 43(16_suppl), e15169. https://doi.org/10.1200/JCO.2025.43.16_suppl.e15169       

de Witte, C. J., Valle-Inclan, J. E., Hami, N., Lõhmussaar, K., Kopper, O., Vreuls, C. P. H., Jonges, G. N., van Diest, P., Nguyen, L., Clevers, H., et al. (2020). Patient-derived ovarian cancer organoids mimic clinical response and exhibit heterogeneous inter- and intrapatient drug responses. Cell Reports, 31(11), Article 107762. https://doi.org/10.1016/j.celrep.2020.107762            

Demircioglu, A. (2019). Radiomics: AI based image analysis. Der Pathologe, 40(Suppl. 3), 271–276. https://doi.org/10.1007/s00292-019-00704-8  

Drwal, M. N., Siramshetty, V. B., Banerjee, P., Goede, A., Preissner, R., & Dunkel, M. (2015). Molecular similarity-based predictions of the Tox21 screening outcome. Frontiers in Environmental Science, 3, Article 54. https://doi.org/10.3389/fenvs.2015.00054       

Esteva, A., Robicquet, A., Ramsundar, B., Kuleshov, V., DePristo, M., Chou, K., Cui, C., Corrado, G., Thrun, S., & Dean, J. (2019). A guide to deep learning in healthcare. Nature Medicine, 25(1), 24–29. https://doi.org/10.1038/s41591-018-0316-z         

Gao, J., Lan, J., Liao, H., Yang, F., Qiu, P., Jin, F., Wang, S., Shen, L., Chao, T., Zhang, C., et al. (2023). Promising preclinical patient-derived organoid (PDO) and xenograft (PDX) models in upper gastrointestinal cancers: Progress and challenges. BMC Cancer, 23, Article 1205. https://doi.org/10.1186/s12885-023-11434-9    

Gao, Y., Zhou, R., Huang, J.-F., Hu, B., Cheng, J.-W., Huang, X.-W., Wang, P.-X., Peng, H.-X., Guo, W., Zhou, J., et al. (2021). Patient-derived xenograft models for intrahepatic cholangiocarcinoma and their application in guiding personalized medicine. Frontiers in Oncology, 11, Article 704042. https://doi.org/10.3389/fonc.2021.704042             

Gargeya, R., & Leng, T. (2017). Automated identification of diabetic retinopathy using deep learning. Ophthalmology, 124(7), 962–969. https://doi.org/10.1016/j.ophtha.2017.02.008

Higgins, J. P. T., & Green, S. (Eds.). (2011). Cochrane handbook for systematic reviews of interventions (Version 5.1.0). The Cochrane Collaboration.

Johnson, J. M., & Khoshgoftaar, T. M. (2019). Survey on deep learning with class imbalance. Journal of Big Data, 6, Article 27. https://doi.org/10.1186/s40537-019-0192-5    

Kermany, D. S., Goldbaum, M., Cai, W., Valentim, C. C. S., Liang, H., Baxter, S. L., … Zhang, K. (2018). Identifying medical diagnoses and treatable diseases by image-based deep learning. Cell, 172(5), 1122–1131.e9. https://doi.org/10.1016/j.cell.2018.02.010       

Kim, J., & Minna, J. D. (2023). Moving toward precision medicine with lung cancer organoids. Cell Reports Medicine, 4(2), Article 100952. https://doi.org/10.1016/j.xcrm.2023.100952    

Kohli, M. D., Summers, R. M., & Geis, J. R. (2017). Medical image data and datasets in the era of machine learning—Whitepaper from the 2016 C-MIMI meeting dataset session. Journal of Digital Imaging, 30(4), 392–399. https://doi.org/10.1007/s10278-017-9976-3  

LeCun, Y., Bengio, Y., & Hinton, G. (2015). Deep learning. Nature, 521(7553), 436–444. https://doi.org/10.1038/nature14539       

Lipton, Z. C. (2018). The mythos of model interpretability. Queue, 16(3), 31–57. https://doi.org/10.1145/3236386.3241340       

Lu, Y., Lei, X., Xu, Y., Li, Y., Wang, R., Wang, S., Wu, A., & Qin, C. (2026). Advancing cancer research: Cutting-edge insights from colorectal cancer patient-derived xenograft mouse models. Genes & Diseases, 13, Article 101634. https://doi.org/10.1016/j.gendis.2025.101634 

Madabhushi, A., & Lee, G. (2016). Image analysis and machine learning in digital pathology: Challenges and opportunities. Medical Image Analysis, 33, 170–175. https://doi.org/10.1016/j.media.2016.06.037

Mayr, A., Klambauer, G., Unterthiner, T., & Hochreiter, S. (2016). DeepTox: Toxicity prediction using deep learning. Frontiers in Environmental Science, 3, Article 80. https://doi.org/10.3389/fenvs.2015.00080      

Miotto, R., Wang, F., Wang, S., Jiang, X., & Dudley, J. T. (2018). Deep learning for healthcare: Review, opportunities and challenges. Briefings in Bioinformatics, 19(6), 1236–1246. https://doi.org/10.1093/bib/bbx044

Murdoch, T. B., & Detsky, A. S. (2013). The inevitable application of big data to health care. JAMA, 309(13), 1351–1352. https://doi.org/10.1001/jama.2013.393              

Na, D., Chae, J., Cho, S.-Y., Kang, W., Lee, A., Min, S., Kang, J., Kim, M. J., Choi, J., Lee, W., et al. (2021). Predictive biomarkers for 5-fluorouracil and oxaliplatin-based chemotherapy in gastric cancers via profiling of patient-derived xenografts. Nature Communications, 12, Article 4840. https://doi.org/10.1038/s41467-021-25122-4    

Obermeyer, Z., & Emanuel, E. J. (2016). Predicting the future—Big data, machine learning, and clinical medicine. The New England Journal of Medicine, 375(13), 1216–1219. https://doi.org/10.1056/NEJMp1606181 

Rajkomar, A., Dean, J., & Kohane, I. (2019). Machine learning in medicine. The New England Journal of Medicine, 380(14), 1347–1358. https://doi.org/10.1056/NEJMra1814259

Romero, J. M., Magrill, J., Kalashnikov, N., Luo, Y. Z., Chen, O. J., Busque, S., Ma, R., Atallah, A., Lazaratos, A.-M., Mendelson, D., et al. (2025). Comparative analysis of patient-derived organoids and patient-derived xenografts as avatar models for predicting response to anti-cancer therapy [Preprint]. medRxiv. https://doi.org/10.1101/2025.08.10.25333051  

Sauer, R., Becker, H., Hohenberger, W., Rödel, C., Wittekind, C., Fietkau, R., Martus, P., Tschmelitsch, J., Hager, E., Hess, C. F., et al. (2004). Preoperative versus postoperative chemoradiotherapy for rectal cancer. The New England Journal of Medicine, 351(17), 1731–1740. https://doi.org/10.1056/NEJMoa040694     

Setio, A. A. A., Ciompi, F., Litjens, G., Gerke, P., Jacobs, C., van Riel, S. J., … van Ginneken, B. (2016). Pulmonary nodule detection in CT images: False positive reduction using multi-view convolutional networks. IEEE Transactions on Medical Imaging, 35(5), 1160–1169. https://doi.org/10.1109/TMI.2016.2536809

Shen, D., Wu, G., & Suk, H.-I. (2017). Deep learning in medical image analysis. Annual Review of Biomedical Engineering, 19, 221–248. https://doi.org/10.1146/annurev-bioeng-071516-044442     

Strobl, C., Boulesteix, A.-L., Zeileis, A., & Hothorn, T. (2007). Bias in random forest variable importance measures: Illustrations, sources and a solution. BMC Bioinformatics, 8, Article 25. https://doi.org/10.1186/1471-2105-8-25    

Su, C., Olsen, K. A., Bond, C. E., & Whitehall, V. L. J. (2023). The efficacy of using patient-derived organoids to predict treatment response in colorectal cancer. Cancers, 15(3), Article 805. https://doi.org/10.3390/cancers15030805

Teng, Z., Li, L., Xin, Z., Xiang, D., Huang, J., Zhou, H., Shi, F., Zhu, W., Cai, J., Peng, T., & Chen, X. (2024). A literature review of artificial intelligence (AI) for medical image segmentation: From AI and explainable AI to trustworthy AI. Quantitative Imaging in Medicine and Surgery, 14(12), 9620–9652. https://doi.org/10.21037/qims-24-723 

Topol, E. J. (2019). Deep medicine: How artificial intelligence can make healthcare human again. Basic Books.

Ueda, D., Kakinuma, T., Fujita, S., Kamagata, K., Fushimi, Y., Ito, R., Matsui, Y., Nozaki, T., Nakaura, T., Fujima, N., Tatsugami, F., Yanagawa, M., Hirata, K., Yamada, A., Tsuboyama, T., Kawamura, M., Fujioka, T., & Naganawa, S. (2024). Fairness of artificial intelligence in healthcare: Review and recommendations. Japanese Journal of Radiology, 42(1), 3–15. https://doi.org/10.1007/s11604-023-01474-3  

Van der Velden, B. H. M., Kuijf, H. J., Gilhuijs, K. G. A., & Viergever, M. A. (2022). Explainable artificial intelligence (XAI) in deep learning-based medical image analysis. Medical Image Analysis, 79, Article 102470. https://doi.org/10.1016/j.media.2022.102470  

Vlachogiannis, G., Hedayat, S., Vatsiou, A., Jamin, Y., Fernández-Mateos, J., Khan, K., Lampis, A., Eason, K., Huntingford, I., Burke, R., et al. (2018). Patient-derived organoids model treatment response of metastatic gastrointestinal cancers. Science, 359(6378), 920–926. https://doi.org/10.1126/science.aao2774        

Wang, Z., & Deisboeck, T. S. (2014). Computational modeling of cancer nanomedicine: Multi-scale modeling of drug transport and tumor response. Drug Discovery Today, 19(5), 650–658. https://doi.org/10.1016/j.drudis.2013.06.015      

Wu, Z., Ramsundar, B., Feinberg, E. N., Gomes, J., Geniesse, C., Pappu, A. S., Leswing, K., & Pande, V. (2018). MoleculeNet: A benchmark for molecular machine learning. Chemical Science, 9(2), 513–530. https://doi.org/10.1039/C7SC02664A     

Xie, J., Liu, W., Hu, W., Ouyang, M., & Huang, T. (2025). Graph neural network-based toxicity prediction by integrating molecular fingerprints and knowledge graph features. Toxics, 13(11), Article 953. https://doi.org/10.3390/toxics13110953           

Xu, J., Pham, M. D., Corbo, V., Ponz-Sarvise, M., Oni, T., Öhlund, D., & Hwang, C.-I. (2025). Advancing pancreatic cancer research and therapeutics: The transformative role of organoid technology. Experimental & Molecular Medicine, 57, 50–58. https://doi.org/10.1038/s12276-024-01378-w 

Yasaka, K., & Abe, O. (2018). Deep learning and artificial intelligence in radiology: Current applications and future directions. PLOS Medicine, 15(11), Article e1002707. https://doi.org/10.1371/journal.pmed.1002707   

Yu, J., Qin, B., Moyer, A. M., Sinnwell, J. P., Thompson, K. J., Copland, J. A., Marlow, L. A., Miller, J. L., Yin, P., Gao, B., et al. (2017). Establishing and characterizing patient-derived xenografts using pre-chemotherapy percutaneous biopsy and post-chemotherapy surgical samples from a prospective neoadjuvant breast cancer study. Breast Cancer Research, 19, Article 130. https://doi.org/10.1186/s13058-017-0920-8    

Zanella, E. R., Grassi, E., & Trusolino, L. (2022). Towards precision oncology with patient-derived xenografts. Nature Reviews Clinical Oncology, 19(11), 719–732. https://doi.org/10.1038/s41571-022-00682-6 

Zhao, X., Zhang, S., Zhang, T., Cao, Y., & Liu, J. (2025). A small-scale data-driven and graph neural network-based toxicity prediction method of compounds. Computational Biology and Chemistry, 117, Article 108393. https://doi.org/10.1016/j.compbiolchem.2025.108393  

Article metrics
View details
0
Downloads
0
Citations
22
Views

View Dimensions


View Plumx


View Altmetric


0
Save
0
Citation
22
View
0
Share