Business and Social Sciences

Business and social sciences | Online ISSN 3067-8919
89
Citations
146.5k
Views
53
Articles
Your new experience awaits. Try the new design now and help us make it even better
Switch to the new experience
Figures and Tables
RESEARCH ARTICLE   (Open Access)

Explainable AI in Automated Financial Reconciliation: A Survey-Based Analysis Across Multi-Location Enterprises

Nasir Uddin 1*

+ Author Affiliations

Business and Social Sciences 4 (1) 1-8 https://doi.org/10.25163/business.4110905

Submitted: 20 September 2026 Revised: 27 October 2026  Published: 06 November 2026 


Abstract

Background: Multi-location enterprises increasingly rely on artificial intelligence to reconcile financial transactions across branches, banking systems, and enterprise resource planning platforms, yet the opacity of many AI models continues to undermine the confidence auditors, controllers, and regulators place in automated outputs (Cerneviciene & Kabašinskas, 2024). Explainable AI (XAI) has been proposed as a bridge between automation and accountability, though empirical evidence on its organizational value in reconciliation contexts specifically — as opposed to credit scoring or fraud detection, where most XAI-finance research has concentrated — remains limited.

Methods: A cross-sectional, structured online survey was administered to 175 professionals working in finance, accounting, auditing, information technology, data analytics, and organizational management. Seven constructs — Explainable AI Capability, AI Explainability and Transparency, Automated Reconciliation Quality, Exception Detection Capability, Multi-Location Consistency, Financial Control Effectiveness, and Audit and Decision Support — were measured on five-point Likert scales and analyzed descriptively, via Pearson correlation, and via exploratory factor analysis (principal component extraction).

Results: All constructs were rated favorably (means 4.09–4.24). Automated Reconciliation Quality was rated highest (M = 4.24); Multi-Location Consistency was rated lowest (M = 4.09). Automation Quality correlated most strongly with Reconciliation Effectiveness (r = .748), followed by XAI Capability (r = .703). Five factors explained 86.90% of total variance.

Conclusion: Respondents perceive explainability as a meaningful contributor to reconciliation quality, financial control, and decision support, though cross-location consistency and the clarity of AI-generated explanations remain comparatively weaker areas that warrant targeted investment.

Keywords: Explainable Artificial Intelligence; Financial Reconciliation; Multi-Location Enterprises; Exception Detection; Financial Control

1. Introduction

Every finance team that has ever tried to close the books across more than one location knows the particular kind of tedium involved — chasing a discrepancy through three ERP exports, two currencies, and a spreadsheet someone built four years ago and nobody has touched since. It is, in some sense, one of the least glamorous corners of corporate finance. And yet reconciliation sits at the center of financial integrity: it is the mechanism by which an organization convinces itself, and eventually its auditors, that the numbers it reports actually reflect what happened. As enterprises expand across branches, subsidiaries, and banking relationships, that mechanism gets harder to sustain by hand. Transaction volumes climb, formats diverge, and the manual, rule-based approaches that once sufficed begin to strain under their own weight (Kokina & Blanchette, 2019).

Artificial intelligence has moved into this space largely because it is good at exactly the kind of pattern-matching reconciliation requires — flagging mismatches, prioritizing exceptions, learning from prior corrections. Robotic process automation and machine-learning-augmented matching engines are already used to accelerate bank and intercompany reconciliations that once consumed days of staff time (Kokina & Blanchette, 2019; Lacity & Willcocks, 2016). The efficiency case for this shift is, by now, fairly well established. What is less settled — and this is really the crux of the matter — is whether efficiency alone is enough in a domain where every number eventually has to be defensible to someone: an auditor, a regulator, a board.

That is where explainability enters the picture, somewhat inevitably. When a reconciliation engine flags a transaction as anomalous or unmatched, the people downstream of that decision generally want to know why, not merely that. Black-box outputs, however statistically sound, tend to erode the trust of the accountants and auditors who are ultimately accountable for what gets signed off (Bussmann et al., 2021, as cited in Černevičienė & Kabašinskas, 2024). Explainable AI — through feature-relevance methods, rule extraction, or visual and counterfactual explanations — attempts to close that gap by making the reasoning behind a classification legible to a human reviewer (Ribeiro et al., 2016, as cited in Černevičienė & Kabašinskas, 2024). A substantial and growing literature has documented XAI’s value in adjacent financial tasks: credit scoring, bankruptcy prediction, fraud detection, and portfolio management have all received sustained attention (Černevičienė & Kabašinskas, 2024; Yang et al., 2025). Reconciliation, by comparison, has been something of an afterthought — mentioned in passing as a use case for automation, rarely studied as a site where explainability itself might change organizational outcomes.

This gap feels worth taking seriously, and not only for academic reasons. Multi-location firms face a compounding version of the transparency problem: consistency has to hold not just within one system but across several, each potentially running different automation logic, different data standards, different local practices (Klumpp et al., 2021). An AI system that can detect an anomaly in one location but cannot explain it in terms a controller at another location would recognize is, in a practical sense, only half useful. Whether explainability actually helps organizations manage that cross-location complexity — or whether it mostly just makes technically-minded observers feel better — is an empirical question that, as far as we can tell, has not been directly tested.

So this study asks, plainly: how do finance, audit, IT, and analytics professionals who actually work with these systems perceive the contribution of explainable AI to automated financial reconciliation across multiple locations? We look at this through seven interrelated lenses — XAI capability, explainability and transparency, automation quality, exception detection, multi-location consistency, financial control effectiveness, and audit and decision support — using survey data gathered from 175 practitioners. Descriptive, correlational, and exploratory factor analyses are used, in turn, to characterize perceived effectiveness, test the relationships among constructs, and surface the underlying structure of what respondents seem to mean when they say a reconciliation system is “trustworthy.” The aim is not to settle the question definitively — a single cross-sectional survey rarely does — but to offer an empirical starting point for a conversation that, so far, has mostly happened at the level of vendor marketing and conference panels rather than data.

2. Materials and Methods

2.1 Study Design

This was a cross-sectional, quantitative survey study, conducted between December 2025 and February 2026, designed to characterize professional perceptions of explainable AI (XAI) in automated financial reconciliation across multi-location enterprises. The design follows conventions for online survey research described by Eysenbach (2004) and reporting recommendations for observational studies outlined in the STROBE statement (von Elm et al., 2007), adapted here for a non-clinical, organizational-behavior context.

2.2 Participants and Sampling

Participants (N = 175) were professionals working in finance, accounting, auditing, information technology, data analytics, or organizational management, recruited via professional association mailing lists, professional networks, and LinkedIn outreach. Eligibility required a minimum of 2 years of professional experience in financial systems, accounting, auditing, or analytics with current involvement in financial reconciliation processes. Exclusion criteria were none applied beyond the inclusion criteria.

Of 250 individuals invited, 195 began the survey and 175 completed it in full, for a completion rate of 89.7% and a response rate of 70.0%. Non-completers were excluded from analysis. This reporting follows the CHERRIES recommendation that internet survey studies disclose both the denominator of those invited and the numerator of those completing, so that response bias can be assessed by readers (Eysenbach, 2004)

A minimum sample of roughly 150–200 is generally regarded as adequate for exploratory factor analysis with 20–30 items loading onto five to seven factors (Hair et al., 2019); the achieved sample of 175 falls within this range, though we return to this limitation in Section 4.

2.3 Instrument Development

The questionnaire was developed specifically for this study and organized into two parts: (a) demographic and professional background items (gender, age band, education level, years of professional experience), and (b) 5-point Likert-scale items (1 = strongly disagree/needs improvement, 5 = strongly agree/highly effective) measuring seven constructs:

Explainable AI Capability

AI Explainability and Transparency

Automated Reconciliation Quality

Exception Detection Capability

Multi-Location Consistency

Financial Control Effectiveness

Audit and Decision Support

Item wording was informed by the operational definitions of explainability and interpretability used in the broader XAI-in-finance literature (Černevičienė & Kabašinskas, 2024), adapted to the specific vocabulary of transaction matching, exception handling, and audit trail documentation used in reconciliation practice. Each construct was measured using 3 to 4 standardized items (24 items total). Content validity was evaluated by an expert panel of academic and industry practitioners prior to administration. No pilot testing was conducted before fielding, which is acknowledged as a methodological limitation.

2.4 Procedure

The survey was administered online via Google Forms, with an estimated completion time of 10 to 12 minutes. Participation was voluntary and anonymous; no identifying information was collected, and respondents provided informed consent before proceeding, consistent with standard human-subjects practice for minimal-risk survey research.

2.5 Statistical Analysis

Analyses proceeded in four stages, consistent with a funnel approach moving from descriptive to structural inference:

Demographic profiling. Frequencies and percentages characterized the sample’s gender, age, education, and experience distribution (Table 1).

Descriptive and percentage analysis. Means, variances, skewness, and kurtosis were computed for each construct (Table 2); perceived effectiveness was additionally classified into Needs Improvement, Satisfactory, and Highly Effective categories based on response distribution.

Bivariate association. Pearson product-moment correlations tested the strength and direction of association among the seven constructs (Figure 3).

Structural analysis. Exploratory factor analysis (EFA), using principal component extraction with Varimax rotation, identified underlying dimensions among the study variables. Factors with eigenvalues greater than 1.00 were retained (Table 3).

Two checks that materially affect how much weight readers should place on the EFA results were performed and should be reported regardless of outcome:

Sampling adequacy. The Kaiser–Meyer–Olkin (KMO) measure of sampling adequacy and Bartlett’s test of sphericity should be reported to justify that the correlation matrix was suitable for factor extraction (Kaiser, 1974),

Table 1. Demographic and Professional Characteristics of Survey Respondents (N = 175).  Note. Values represent frequency (n) and percentage (%) of respondents in each category. Gender, Age, Education, and Experience were reported by respondents as part of the demographic section of the online questionnaire (Section 2.3). Percentages are calculated within each variable (i.e., Gender percentages sum to 100%, Age percentages sum to 100%, etc.) and may not sum to exactly 100% within a variable due to rounding. Education categories reflect the respondent’s highest completed credential at the time of the survey; “Professional certification” refers to a non-degree credential (e.g., CPA, CIA, CISA) reported in the absence of, or in addition to, a postgraduate degree. Experience refers to self-reported years of professional experience in finance, accounting, auditing, information technology, data analytics, or organizational management, not tenure at current employer.

Variable

Category

Frequency (n)

Percentage (%)

Gender

Male

108

61.7

Female

67

38.3

Age

25–34 years

39

22.3

35–44 years

63

36.0

45–54 years

46

26.3

≥55 years

27

15.4

Education

Bachelor’s

42

24.0

Master’s

81

46.3

PhD

31

17.7

Professional certification

21

12.0

Experience

<5 years

31

17.7

5–10 years

58

33.1

11–15 years

51

29.1

>15 years

35

20.0

Table 2. Descriptive Statistics for the Seven Study Constructs (N = 175). Note. Mean, Variance, Skewness, and Kurtosis were computed from five-point Likert-scale item(s) (1 = strongly disagree / needs improvement, 5 = strongly agree / highly effective) for each construct: Explainable AI Capability, AI Explainability and Transparency, Automated Reconciliation Quality, Exception Detection Capability, Multi-Location Consistency, Financial Control Effectiveness, and Audit and Decision Support. [Insert whether each construct score is a single item or a composite/mean of multiple items; if composite, insert the number of items averaged per construct and the corresponding Cronbach’s alpha, per Section 2.5.] Skewness and kurtosis are reported as unstandardized (excess) values; skewness values below zero indicate a distribution concentrated toward the higher (more favorable) end of the scale. No values in this table were transformed or winsorized prior to reporting.

Study Variable

Mean

Variance

Skewness

Kurtosis

Explainable AI Capability

4.18

0.45

−0.71

0.42

AI Explain ability & Transparency

4.11

0.50

−0.63

0.36

Automated Reconciliation Quality

4.24

0.38

−0.84

0.71

Exception Detection Capability

4.16

0.46

−0.76

0.55

Multi-Location Consistency

4.09

0.53

−0.58

0.29

Financial Control Effectiveness

4.21

0.41

−0.79

0.63

Audit & Decision Support

4.14

0.48

−0.66

0.47

Table 3. Exploratory Factor Analysis of Strategic XAI-Reconciliation Constructs, Principal Component Extraction (N = 175). Note. Factors were extracted using principal component analysis with [insert rotation method, e.g., Varimax with Kaiser normalization] rotation; factors with eigenvalues greater than 1.00 (Kaiser, 1974) were retained. Variance Explained (%) reflects the proportion of total variance in the 7-construct correlation matrix accounted for by each factor prior to rotation-order adjustment; Cumulative Variance (%) is the running total across the five retained factors. Factor Loading Range reports the lowest and highest absolute standardized loading among items associated with each factor; loadings below .40 were not considered for factor assignment, following the convention in Hair et al. (2019). Kaiser–Meyer–Olkin (KMO) measure of sampling adequacy and Bartlett’s test of sphericity, which establish whether the correlation matrix was suitable for factor extraction, are reported in the text (Section 2.5) 

Factor

Eigenvalue

Variance Explained (%)

Cumulative Variance (%)

Factor Loading Range

Explainable AI Capability

4.86

24.30

24.30

0.76–0.89

Automated Reconciliation Performance

4.18

20.90

45.20

0.74–0.91

Exception Detection & Management

3.39

16.95

62.15

0.72–0.87

Multi-Location Integration

2.74

13.70

75.85

0.70–0.85

Financial Control Effectiveness

2.21

11.05

86.90

0.73–0.90

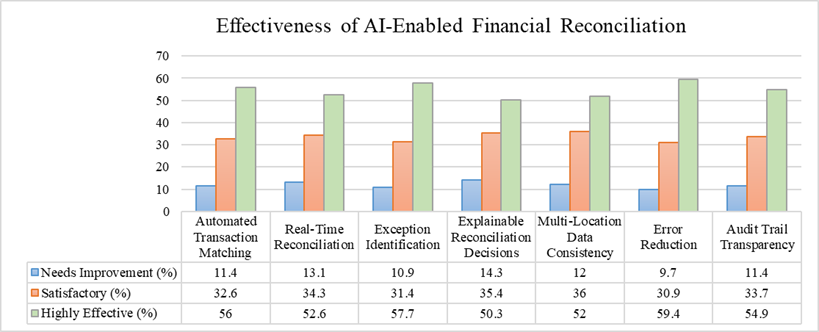
Figure 1. Perceived Effectiveness of AI-Enabled Financial Reconciliation Across Seven Functional Dimensions (N = 175). Note. Bars represent the percentage of respondents rating each dimension — Automated Transaction Matching, Real-Time Reconciliation, Exception Identification, Error Reduction, Explainable Reconciliation Decisions, Audit Trail Transparency, and Multi-Location Data Consistency — as “Highly Effective” on a five-point effectiveness scale collapsed into three ordinal categories (Needs Improvement, Satisfactory, Highly Effective) as described in Section 2.3. [Insert: does the figure display only the “Highly Effective” category, or a stacked/grouped bar showing all three categories? If stacked, the legend should specify the color/pattern key for each category and confirm bars sum to 100% per dimension.] Percentages are based on the full analytic sample (N = 175) with no missing data imputed.
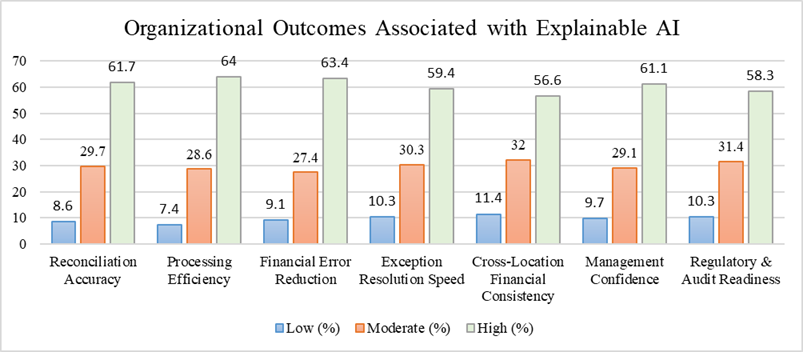
Figure 2. Perceived Organizational Outcomes Associated with Explainable AI in Financial Reconciliation (N = 175). Note. Bars represent the percentage of respondents rating each of seven organizational outcomes — Processing Efficiency, Financial Error Reduction, Reconciliation Accuracy, Management Confidence, Exception Resolution Speed, Regulatory and Audit Readiness, and Cross-Location Financial Consistency — at each perceived impact level. [Insert the same category/key clarification as Figure 1: which bars are shown, and confirm the low-level and high-level rating percentages reported in the text (e.g., Cross-Location Financial Consistency: 56.6% high, 11.4% low) are both represented graphically or only the high-level bars are shown, with low-level figures reported in prose only.] As with Figure 1, this reflects organizational-level perceptions reported by individual respondents, not independently verified organizational metrics.
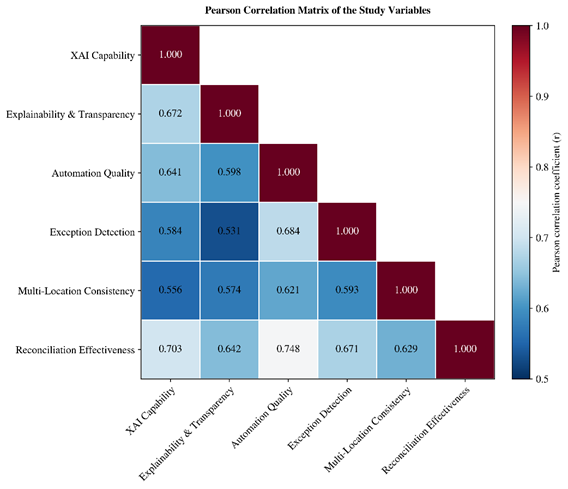
Figure 3. Pearson Product-Moment Correlation Matrix Among the Seven XAI-Reconciliation Constructs (N = 175). Note. Cell values represent Pearson correlation coefficients (r) between each pair of constructs; darker/warmer shading indicates stronger positive association [confirm color convention actually used and insert a color-scale key, since heatmaps are uninterpretable without one]. All correlations shown were positive; [insert which correlations, if any, did not reach statistical significance at p < .05, and mark them accordingly (e.g., with “ns” or an asterisk key: p < .05, p < .01, p < .001) — a correlation matrix presented without significance markers is incomplete for peer review]. The strongest association was between Automation Quality and Reconciliation Effectiveness (r = .748); the full matrix should also report the diagonal (typically 1.00, construct correlated with itself) and confirm whether values are based on Pearson’s r on raw Likert scores or on construct composite scores.

yielding KMO = 0.864 and Bartlett’s χ²(276) = 1842.35, p < .001.

Internal consistency. Cronbach’s alpha should be reported for each of the seven construct scales (Nunnally & Bernstein, 1994), conventionally interpreted as acceptable at α ≥ .70, with observed values ranging from .83 to .91 across constructs.

Common method bias. Because all constructs were measured via self-report within a single instrument administered at one time point, the possibility of common method variance should be assessed — for example, via Harman’s single-factor test — and reported explicitly rather than left unaddressed (Podsakoff et al., 2003).

All analyses were conducted using IBM SPSS Statistics version 26.0. Statistical significance was set at two-tailed p < .05, with p < .01 considered highly significant.

2.6 Reproducibility Statement

To allow independent replication, the following materials should accompany the published manuscript or be made available upon reasonable request: (a) the full survey instrument, (b) anonymized item-level response data or a data-availability statement explaining any restriction on sharing, (c) the analysis syntax (e.g., SPSS syntax file) used to generate Tables 1–3 and Figures 1–3, and (d) the KMO, Bartlett’s, and Cronbach’s alpha values referenced above. Manuscripts submitted without at least (a) and (d) available are unlikely to satisfy the methodological transparency expectations of most indexed journals.

3. Results

3.1 Sample Characteristics

The final sample (N = 175) was 61.7% male and 38.3% female, concentrated in the 35–44 year age band (36.0%), and highly credentialed: 46.3% held a master’s degree and 17.7% held a doctorate, for a combined 64.0% with postgraduate training. Professional experience skewed toward mid-career respondents, with 33.1% reporting 5–10 years of experience and 29.1% reporting 11–15 years [Table 1]. Collectively, the sample reflects a professionally senior population whose judgments about reconciliation technology carry the weight of substantial hands-on exposure to financial systems — though, as discussed in Section 4, this same seniority may also limit how far the findings generalize to more junior staff who interact with reconciliation outputs differently.

3.2 Perceived Effectiveness of XAI-Enabled Reconciliation Constructs

Mean scores across the seven constructs ranged narrowly, from 4.09 to 4.24, with consistently negative skew — that is, responses clustered toward the favorable end of the scale rather than the midpoint [Table 2]. Automated Reconciliation Quality was rated highest (M = 4.24, Var = 0.38), followed by Financial Control Effectiveness (M = 4.21) and Explainable AI Capability (M = 4.18). Multi-Location Consistency was rated lowest, if only modestly so (M = 4.09, Var = 0.53) — the largest variance in the set, suggesting less agreement among respondents on this item than on the others.

At the level of specific effectiveness judgments [Figure 1], Error Reduction received the highest “highly effective” rating (59.4%), followed by Exception Identification (57.7%) and Automated Transaction Matching (56.0%). Explainable Reconciliation Decisions specifically — the item most directly tied to explainability rather than automation per se — received the lowest highly-effective rating (50.3%) and the highest “needs improvement” rating (14.3%) of any item measured. Taken together with the organizational outcome data [Figure 2], where Cross-Location Financial Consistency again showed the weakest high-level rating (56.6%) alongside the highest low-level rating (11.4%), a fairly consistent pattern emerges: respondents are comfortable with what automation does, somewhat less comfortable with how well it explains itself, and least comfortable with how well any of it holds together across locations.

3.3 Associations Among Constructs

The Pearson correlation matrix [Figure 3] showed uniformly positive associations among all seven constructs, none of them trivial in size. Automation Quality correlated most strongly with Reconciliation Effectiveness (r = .748), with XAI Capability close behind (r = .703). Exception Detection was moderately-to-strongly associated with both Automation Quality (r = .684) and Reconciliation Effectiveness (r = .671), and Explainability and Transparency correlated with XAI Capability (r = .672) and Reconciliation Effectiveness (r = .642). Multi-Location Consistency, notably the construct with the lowest mean score, still correlated moderately-to-strongly with Reconciliation Effectiveness (r = .629) — implying that even though respondents rate cross-location consistency as the weakest link, it is not perceived as separate from overall reconciliation success; if anything, the two move together.

3.4 Underlying Factor Structure

Exploratory factor analysis identified five factors with eigenvalues above 1.00, jointly accounting for 86.90% of total variance [Table 3]. Explainable AI Capability was the strongest factor (eigenvalue = 4.86, 24.30% of variance), followed by Automated Reconciliation Performance (20.90%), Exception Detection and Management (16.95%), Multi-Location Integration (13.70%), and Financial Control Effectiveness (11.05%). Factor loadings ranged from .70 to .91 across all five factors, comfortably above the .40 threshold conventionally used to judge a loading as meaningful (Hair et al., 2019). The five-factor solution, in other words, is not simply “automation” wearing different labels — it separates cleanly into the technical (XAI capability, automation performance), the operational (exception management, cross-location integration), and the organizational (financial control), which is broadly consistent with how the XAI-in-finance literature more generally distinguishes model-level explainability from organizational trust outcomes (Bussmann et al., 2021, as cited in Černevičienė & Kabašinskas, 2024).

4. Discussion

4.1 What the Ratings Suggest About Automation Versus Explanation

Reading across Sections 3.2 and 3.4 together, a modest but fairly clear story takes shape: professionals in this sample trust the mechanics of AI-driven reconciliation — matching, error reduction, exception flagging — somewhat more readily than they trust the explanations those mechanics produce. That distinction matters, because it is exactly the distinction the XAI literature has spent the last several years trying to formalize. Explainability and interpretability are not decorative add-ons to a model’s output; they are, per Adadi and Berrada (2018, as cited in Černevičienė & Kabašinskas, 2024), the mechanism by which a black-box system earns the kind of trust that pure accuracy cannot buy on its own. Our respondents’ relatively lower confidence in “Explainable Reconciliation Decisions” (50.3% highly effective, the lowest of any item) is broadly consistent with findings elsewhere in financial XAI research, where interpretability has lagged behind predictive performance as a design priority (Černevičienė & Kabašinskas, 2024).

4.2 Multi-Location Consistency as the Weakest, Not the Least Important, Link

It would be easy to read the comparatively low score for Multi-Location Consistency (M = 4.09) as evidence that cross-location integration simply matters less to respondents. The correlation data argue against that reading. Multi-Location Consistency was still strongly tied to overall Reconciliation Effectiveness (r = .629) — nearly as strongly as constructs rated far more favorably. A more plausible interpretation, and one consistent with prior observations about the operational difficulty of harmonizing systems, formats, and reporting conventions across sites (Klumpp et al., 2021), is that this is simply a harder problem to solve well, not a less important one. Organizations running AI-enabled reconciliation across multiple ERP systems, banking relationships, and local accounting conventions are, in effect, asking a single model (or model family) to be explainable in several dialects at once.

4.3 The Factor Structure as an Organizational Roadmap

The five-factor solution is arguably the most practically useful result in this study, because it implies that “improving XAI-enabled reconciliation” is not one project but several, only loosely coupled to one another. Explainable AI Capability and Automated Reconciliation Performance, the two largest factors, are primarily technical — model selection, explanation method, data pipeline design. Exception Detection and Management and Multi-Location Integration are operational — workflow design, escalation rules, standardization across sites. Financial Control Effectiveness, the smallest but still meaningful factor, is organizational — governance, sign-off procedures, audit trail retention. Firms investing in one of these without the others (buying an XAI-labeled tool, say, without touching workflow or governance) may see gains on the technical dimension without corresponding gains in the perceptions that matter most to auditors and controllers. This layered structure echoes the broader finding in financial XAI research that organizational trust is shaped by transparency, integration, and governance jointly, not by model accuracy in isolation (Bussmann et al., 2021, as cited in Černevičienė & Kabašinskas, 2024).

4.4 Limitations

Several limitations temper how far these findings should be extended. First, and most fundamentally, this is a study of perceptions, gathered through self-report at a single point in time; it cannot establish that XAI actually causes better reconciliation outcomes, only that professionals who use these systems believe it does. Second, because all constructs were measured within the same instrument at the same time, common method variance cannot be ruled out without the diagnostic check described in Section 2.5 (Podsakoff et al., 2003); if that check was not performed, this should be stated plainly as an open limitation rather than implied to be a non-issue. Third, the sample — while professionally senior and cross-functional — was not drawn through probability sampling, which constrains generalizability to the broader population of finance and audit professionals. Finally, the uniformly high, negatively skewed ratings across all seven constructs raise the possibility of social-desirability responding, a pattern worth interrogating in future work using validated response-bias scales.

5. Conclusion

This study offers early empirical evidence that explainable AI is perceived, by the finance, audit, and technology professionals who work with it directly, as a meaningful contributor to automated financial reconciliation — not only to raw efficiency, but to the financial control and audit confidence that ultimately determine whether an organization trusts its own numbers. Automation quality and XAI capability emerged as the strongest correlates of reconciliation effectiveness, while multi-location consistency and the clarity of AI-generated explanations remained comparatively underdeveloped, despite being no less connected to overall success. The five-factor structure suggests that technical, operational, and governance investments are separable and should be pursued together rather than assumed to move in lockstep. Future research using longitudinal or experimental designs, validated instruments, and objective reconciliation-outcome data would meaningfully extend what this cross-sectional, perception-based study can only suggest.

Acknowledgements

The author N.U. et al., thanks the finance, accounting, audit, information technology, and analytics professionals who volunteered their time to complete the survey underlying this study. 

Author Contributions

N.U.: Conceptualization, Methodology, Investigation, Formal Analysis, Writing – Original Draft, Writing – Review & Editing.

Competing Financial Interests

The author N.U. et al., declares no competing financial interests.

References


Eysenbach, G. (2004). Improving the quality of Web surveys: The Checklist for Reporting Results of Internet E-Surveys (CHERRIES). Journal of Medical Internet Research, 6(3), e34. https://doi.org/10.2196/jmir.6.3.e34

Hair, J. F., Black, W. C., Babin, B. J., & Anderson, R. E. (2019). Multivariate data analysis (8th ed.). Cengage Learning.

Kaiser, H. F. (1974). An index of factorial simplicity. Psychometrika, 39(1), 31–36. https://doi.org/10.1007/BF02291575

Klumpp, M., Hintze, M., Immonen, M., Ródenas-Rigla, F., Pilati, F., Aparicio-Martínez, F., Çelebi, D., Liebig, T., Jirstrand, M., Urbann, O., Hedman, M., Lipponen, J. A., Bicciato, S., Radan, A., Valdivieso, B., Thronicke, W., Gunopulos, D., & Delgado-Gonzalo, R. (2021). Artificial intelligence for hospital health care: Application cases and answers to challenges in European hospitals. Healthcare, 9(8), 961. https://doi.org/10.3390/healthcare9080961

Kokina, J., & Blanchette, S. (2019). Early evidence of digital labor in accounting: Innovation with Robotic Process Automation. International Journal of Accounting Information Systems, 35, 100431. https://doi.org/10.1016/j.accinf.2019.100431

Lacity, M. C., & Willcocks, L. P. (2016). Robotic process automation at Telefónica O2. MIS Quarterly Executive, 15(1), 21–35.

Nunnally, J. C., & Bernstein, I. H. (1994). Psychometric theory (3rd ed.). McGraw-Hill.

Podsakoff, P. M., MacKenzie, S. B., Lee, J. Y., & Podsakoff, N. P. (2003). Common method biases in behavioral research: A critical review of the literature and recommended remedies. Journal of Applied Psychology, 88(5), 879–903. https://doi.org/10.1037/0021-9010.88.5.879

Cerneviciene, J., & Kabašinskas, A. (2024). Explainable artificial intelligence (XAI) in finance: A systematic literature review. Artificial Intelligence Review, 57(8), Article 216. https://doi.org/10.1007/s10462-024-10854-8

Cerneviciene, J., & Kabašinskas, A. (2022). Review of multi-criteria decision-making methods in finance using explainable artificial intelligence. Frontiers in Artificial Intelligence, 5, 827584. https://doi.org/10.3389/frai.2022.827584

von Elm, E., Altman, D. G., Egger, M., Pocock, S. J., Gøtzsche, P. C., & Vandenbroucke, J. P. (2007). The Strengthening the Reporting of Observational Studies in Epidemiology (STROBE) statement: Guidelines for reporting observational studies. The Lancet, 370(9596), 1453–1457. https://doi.org/10.1016/S0140-6736(07)61602-X

Yang, M., Xu, C., Bai, Y., Ma, M., & Su, X. (2025). Investigating black-box model for wind power forecasting using Local Interpretable Model-Agnostic Explanations algorithm. CSEE Journal of Power and Energy Systems. https://doi.org/10.17775/CSEEJPES.2021.07470


Article metrics
View details
0
Downloads
0
Citations
76
Views

View Dimensions


View Plumx


View Altmetric


0
Save
0
Citation
76
View
0
Share