Data Modeling

Mathematical and Computational Data Modeling | Online ISSN 3143-9217
2
Citations
10.2k
Views
45
Articles
Your new experience awaits. Try the new design now and help us make it even better
Switch to the new experience
Figures and Tables
RESEARCH ARTICLE   (Open Access)

Exploratory Analysis of Government Employee Financial Data in Bangladesh: A Case Study for Evidence-Based Budget Forecasting

Sabya Sachee Das 1*

+ Author Affiliations

Data Modeling 2 (1) 1-8 https://doi.org/10.25163/data.2110894

Submitted: 15 April 2021 Revised: 02 June 2021  Published: 12 June 2021 


Abstract

Background: Public-sector wage and benefit spending is one of the largest recurring items in Bangladesh's national budget, yet allocation for pay, allowances, provident-fund nominees, and staff loans is often planned without systematic reference to the demographic composition of the workforce that draws on it. Methods: This case study applies exploratory data analysis (EDA) to administrative records for 200 employees of a single Bangladeshi government office, examining associations between age and four variables: pay grade, General Provident Fund (GPF) nominee type, loan category, and religious affiliation. Histograms, scatter plots, and a correlation heat map were used to summarise distributions and relationships. Results: Loan uptake and nominee choice varied by age band and by grade, with spouse most commonly recorded as nominee and house-building loans concentrated among mid-career employees. The office's religious composition was overwhelmingly Muslim (98%), with a small Hindu minority (2%), a pattern relevant chiefly to festival-allowance planning at this site. Conclusion: Even a modest, office-level EDA can surface patterns useful for local budget planning, though the small, single-site, non-random sample limits generalisation to the national civil service. We argue that scaling this approach across ministries, with proper sampling and inferential modelling, could meaningfully improve forecasting of pay-related expenditure.

Keywords: exploratory data analysis; public expenditure management; Bangladesh civil service; provident fund; budget forecasting

1. Introduction

Every June, budget officials in Dhaka run into the same familiar tension, and it rarely gets easier with practice. The national budget has to be large enough to cover the government's wage bill in full, yet not so padded that money sits idle while other sectors go wanting. For fiscal year 2020-21, Bangladesh's operating expenditure alone ran into the hundreds of thousands of crore Taka, a substantial share of which was earmarked for pay, allowances, and pension obligations covering well over a million public employees (Ministry of Finance, 2020). Put that way, the figure can feel almost too large to reason about, abstract, distant, more a headline number than a lived reality. But underneath it sits a fairly ordinary administrative problem, one that has less to do with macroeconomics than with bookkeeping: nobody, it seems, has a clean, data-driven picture of who is actually drawing on which benefit, at what age, and in what pattern.

That gap matters more than it might first appear, and perhaps more than officials themselves would readily admit. For years, ministries have leaned on largely manual, precedent-based estimation when projecting pay-related expenditure (Ministry of Finance, 2024), a method that is not unreasonable in the absence of better tools, but one that inevitably drifts as workforce demographics shift underneath it. It is not that officials lack data. Personnel files exist. Provident-fund records exist. Loan ledgers exist. What seems to be missing is the habit of bringing these records together and examining them as a single analytic object, rather than as separate filing exercises. The consequence shows up, somewhat predictably, in the fiscal reporting itself: certain line items sit under-spent for much of the year before requiring late re-appropriation, while others run short and need supplementary allocation as the fiscal period closes (Finance Division, 2021). Neither outcome is catastrophic on its own. Together, though, they chip away at the precision of budget planning, and, in principle at least, they are avoidable.

It is worth stepping back for a moment to note that this tension, matching resource allocation to underlying demand under conditions of uncertainty, is hardly unique to Bangladesh's civil service. A substantial body of research on organisational strategy during periods of economic constraint suggests that firms which respond adaptively to shifting internal and external conditions tend to weather downturns more effectively than those that stick rigidly to precedent (Latham, 2009; Latham & Braun, 2011). Studies of software firms navigating the 2008-2010 global recession, for example, found that human-resource and operational decisions grounded in closer monitoring of workforce data tended to outperform decisions made by habit alone (Wickramasinghe & Perera, 2012; Ahmed et al., 2014). Broadly similar patterns have been documented among small firms (Lai et al., 2016) and across Central and Eastern European economies (Burger et al., 2017), while research on information-technology expenditure during the Greek financial crisis reaches a comparable conclusion (Arvanitis & Loukis, 2017). None of these studies concern public payroll specifically, but together they make a modest, transferable point: organisations that ground planning in their own internal data tend to allocate resources more precisely than those that do not, and there is little reason to assume government offices are the exception.

That transferable point has, over the past decade or so, acquired real institutional backing. Governments around the world have shown growing interest in data analytics and artificial intelligence as tools for public decision-making, not as a replacement for administrative judgement but as a way of sharpening it (Duan et al., 2019). The European Commission's own review of artificial intelligence in the public sphere frames this shift fairly explicitly, treating evidence-based, data-informed governance as increasingly close to standard practice rather than novelty (Craglia et al., 2018). The OECD has reached a broadly similar conclusion, cataloguing a wide range of national efforts to embed data-driven methods into public administration (OECD, 2019), while practitioner-facing analyses describe an emerging, if unevenly adopted, model of "AI-augmented government" (Eggers et al., 2017). Bangladesh's public finance system has, so far, largely sat outside that conversation.

Exploratory data analysis (EDA), as formalised by Tukey (1977), offers a natural, and comparatively low-cost, entry point into that conversation. Rather than beginning with a hypothesis and testing it, EDA asks the analyst to look: to plot distributions, to eyeball relationships between variables, to let the data suggest what deserves closer attention (Behrens, 1997). It is, as Tukey himself put it, closer to detective work than to formal inference, and that is arguably its chief virtue in a setting like this one, where almost no prior systematic analysis exists to build on. Framed this way, EDA is best understood as a first step within, rather than apart from, the wider data-science toolkit described in standard references on data mining and predictive analytics (Witten et al., 2017; Siegel, 2013) and in more recent treatments of the mathematical foundations of data science (Blum et al., 2020) - the exploratory stage that, done carefully, tells you what is worth modelling before you attempt to model it. We searched, admittedly not exhaustively, for prior published work applying this kind of analysis to Bangladeshi civil-service data and found very little; most existing treatments of the national budget remain macro-level and descriptive (Ministry of Finance, 2020), rather than grounded in employee-level administrative records.

This paper reports a small, deliberately modest step in that direction. Using records for 200 employees at a single government office, we apply EDA techniques, histograms, scatter plots, and a correlation heat map, to examine how age relates to pay grade, GPF nominee type, loan category, and religious affiliation. We should be upfront about the ambition here, or rather the lack of it: this is not a national survey, and we make no claim that the patterns we find generalise beyond the office studied. What we do claim, more cautiously, is that this kind of office-level exploratory work is feasible, inexpensive, and informative enough to be worth doing more broadly, and that the patterns observed, however local, illustrate the sort of demographic-financial linkage that budget planners could usefully track. The remainder of the paper sets out our data and methods, reports what the exploratory plots showed, and closes with a discussion of what would be needed to extend this approach toward something closer to a genuine national forecasting tool.
2. Methods

2.1 Study design and setting

This is a descriptive, cross-sectional case study of administrative personnel data from a single government office in Bangladesh. We did not seek to draw a probability sample of the national civil service; rather, the intent was to test, at manageable scale, whether routinely collected personnel and finance records could support useful exploratory analysis. The office is not named here to preserve the confidentiality of individual employee records.

2.2 Data source and variables

The dataset comprised de-identified administrative records for 200 employees, extracted from the office's personnel and finance registers for the 2020-21 fiscal year. Each record included, among other fields, employee age, pay grade (16 grade categories, following the national pay scale), General Provident Fund (GPF) nominee type, loan category (house-building, motorcycle, computer, or bicycle loan), and self-reported religious affiliation. Employee names and other directly identifying fields were removed before analysis; no additional demographic variables (e.g., sex, tenure, department) were available in the extract we received, which we note as a limitation below.

2.3 Data preparation

Records were checked for completeness and internal consistency (e.g., age values within a plausible working-age range, grade values within the valid 1-16 range). We did not identify missing values severe enough to warrant imputation; a small number of records with implausible age-grade combinations were reviewed manually and retained after verification against the underlying register. All analysis was performed in Python 3 using pandas for data handling, matplotlib and seaborn for visualisation, and NumPy for basic descriptive statistics.

2.4 Analytic approach

We followed the exploratory data analysis (EDA) tradition described by Tukey (1977), which prioritises visual and descriptive summarisation of a dataset's structure ahead of any confirmatory hypothesis testing (Behrens, 1997). Specifically: (i) univariate distributions of age were examined using histograms, stratified by grade, nominee type, loan type, and religion; (ii) bivariate relationships between age and each of the four categorical variables were examined using scatter plots; and (iii) a correlation heat map was produced across the numeric and encoded categorical fields to give an at-a-glance view of which variable pairs showed the strongest association. No formal significance testing or predictive modelling was undertaken at this stage; consistent with the exploratory framing, our aim was pattern description, not inference or prediction.

2.5 Reproducibility and data availability

To support reproducibility, the analysis pipeline (data-cleaning and plotting scripts) is available from the corresponding author on reasonable request, subject to the confidentiality constraints noted above; the underlying employee-level dataset cannot be shared publicly because it contains sensitive personal and financial information, but a synthetic version replicating its structure can be made available for methods verification. We report this limitation explicitly rather than presenting the dataset as openly reproducible, in line with good-practice expectations for administrative-data research.

2.6 Ethical considerations

Because the dataset contains identifiable employee financial and demographic information, records were anonymised prior to analysis, and no individual-level results are reported. Institutional permission was obtained from the office concerned to use de-identified records for this analysis.

3. Results and Discussion

Before turning to the individual plots, it is worth flagging what this section can and cannot support. With 200 records from one office, we are describing a local pattern, not estimating a population parameter — so the discussion below is deliberately cautious about how far each observation should be pushed.

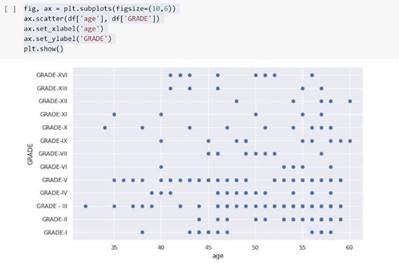
Table 1. Minimum and maximum recorded ages within the loan-eligible cohort, broken down by each of the 16 national pay grades observed in the sample. Grades are ordered from the most senior (Grade 1) to the most junior (Grade 16), and the reported ranges reflect the youngest and oldest employees drawing loan benefits within each grade. The table is intended to show, at a glance, how the age span of loan-eligible staff narrows or widens as grade seniority changes. It underlies the age-and-grade discussion in Section 3.1 and is visualised as a scatter plot in Figure 2.

Grade

Age range (loan-eligible cohort)

Grade 1

50–60

Grade 2

44–59

Grade 3

38–59

Grade 4

39–58

Grade 5

36–57

Grade 6

40–58

Grade 9

45–59

Grade 10

34–58

Grade 11

35–57

Grade 12

48–60

Grade 13

41–57

Grade 16

41–56


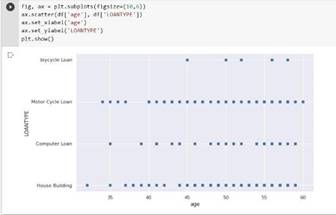
Table 2. Minimum and maximum borrower ages recorded for each of the four staff loan categories available at the office: house-building, motorcycle, computer, and bicycle loans. Ranges are calculated across all borrowers in a given loan category, regardless of pay grade or nominee type. The table highlights how loan uptake clusters at different career stages, with housing loans skewing older and computer loans skewing somewhat younger. It supports the age-and-loan-type discussion in Section 3.3 and is illustrated further in the histogram and scatter plot in Figures 4 and 5.

Loan type

Age range of borrowers

House Building Loan

39–59

Motorcycle Loan

40–59

Computer Loan

35–58

Bicycle Loan

45–58


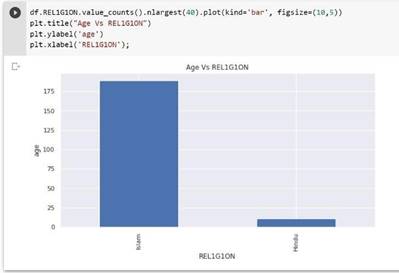
Figure 1. Histogram of employee age, stratified by self-reported religious affiliation (Muslim or Hindu), showing the count of employees within each five-year age band for both groups. The chart is intended to reveal whether the two religious groups differ noticeably in their age composition, rather than to describe overall religious representation, which is reported separately in the text. Bar height reflects raw employee counts, not proportions, so the smaller Hindu subgroup appears visually compressed relative to the Muslim majority. This figure supports the discussion of age and religious composition in Section 3.2.


Figure 2. Scatter plot of individual employee age against pay grade, with each point representing one of the 200 employees in the sample. Grade is plotted on one axis and age on the other, allowing the spread and clustering of ages within each grade to be seen directly rather than summarised as a single range. The plot is the visual counterpart to Table 1 and makes the seniority-linked age pattern described in Section 3.1 easier to inspect. Overlapping points at similar ages and grades are shown without jitter, so dense clusters indicate genuinely common age-grade combinations.

3.1 Age and pay grade

Age distributions differed noticeably across the 16 pay grades sampled, as summarised in Table 1 and visualised in the age-by-grade scatter plot in Figure 2. Employees in the most senior grade recorded (Grade 1) clustered at the older end of the range (50-60 years), while several mid-tier grades (e.g., Grades 9-13) spanned a wider band stretching into the mid-thirties, a spread that Figure 2 shows more clearly than the tabulated ranges alone. This is broadly consistent with a seniority-linked promotion structure, where reaching the highest grade typically requires accumulated years of service, though we cannot confirm a causal seniority mechanism from cross-sectional data alone; a longitudinal, within-employee dataset would be needed to establish that promotion, rather than age itself, is doing the work here.

3.2 Age and religious composition

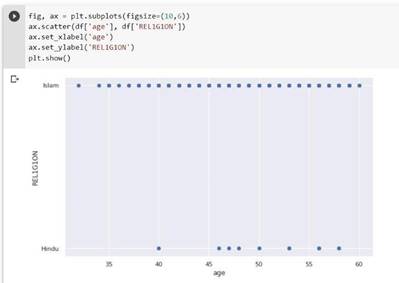
The office's religious composition was heavily skewed: 98% of records were coded Muslim and 2% Hindu, with no other religious categories represented in this extract, a split that is immediately visible in the age-stratified histogram in Figure 1. Age did not appear to differentiate the two groups substantially in the accompanying scatter plot (Figure 3). Practically, this composition is more a reflection of local hiring history and regional demographics than a generalisable feature of the Bangladeshi civil service, and we would caution strongly against treating it as representative beyond this office; national workforce diversity data, where available, would be a more appropriate basis for allowance planning at scale (e.g., festival bonus provisioning) than a 200-person sample from a single site.

3.3 Age and loan type

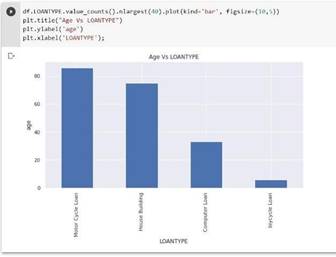
Loan uptake varied by age band, as reported in Table 2 and illustrated by the histogram and scatter plot in Figures 4 and 5 respectively. House-building loans were most common among employees aged roughly 39-59, consistent with a life-stage pattern in which housing investment tends to occur mid-to-late career, once income and seniority have risen; this concentration is the most visually distinct feature of Figure 5. Motorcycle and computer loans showed a similarly broad but slightly younger-skewing range, while bicycle loans were concentrated at the older end (45-58), a pattern also visible in Figure 4. We note these as descriptive tendencies rather than statistically tested differences, since no formal test of group difference was conducted at this exploratory stage.

3.4 Age and GPF nominee type

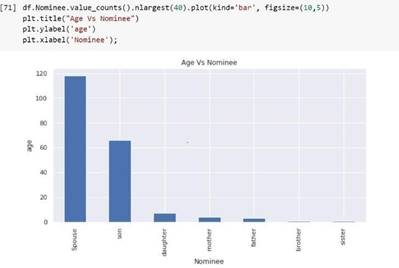
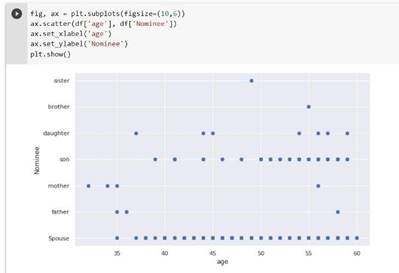
Most employees recorded a spouse as their General Provident Fund nominee, a pattern that held fairly consistently across age bands in both the histogram (Figure 6) and the scatter plot (Figure 7), with some indication in Figure 7 that younger employees were somewhat more likely to name a parent. This is unsurprising given typical family-formation timing, but it is precisely the kind of pattern that, aggregated across a ministry, could inform how survivor-benefit and nominee-related administrative processes are resourced.

3.5 Integrating the findings

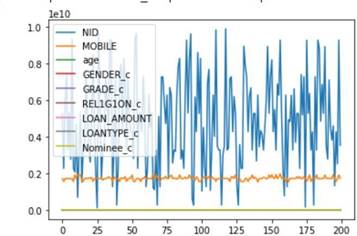
Taken together, the four exploratory analyses summarised in Tables 1 and 2 and Figures 1 through 7, along with the broader time-series trend plotted in Figure 8, suggest that age, grade, loan uptake, and nominee choice are not independent of one another at this office, a finding that, however local, supports the paper's underlying premise: that employee financial facilities follow patterns structured enough to be worth modelling, rather than allocated on a purely ad hoc basis. What the current analysis cannot yet offer is a forecast. Moving from "these variables appear related" to "here is next year's likely expenditure" would require, at minimum, a multi-office or nationally representative sample, formal statistical modelling (e.g., regression or time-series methods) rather than visual EDA alone, and validation against at least one prior fiscal year's actual outturns. We see the present study as motivation for that next step rather than as a substitute for it.

4. Conclusion

This case study used exploratory data analysis to examine how age relates to pay grade, provident-fund nominee choice, loan uptake, and religious composition among 200 employees at a single Bangladeshi government office. The patterns observed — seniority-linked grade distribution, life-stage-linked loan uptake, and spouse-dominant nominee selection — are plausible and locally useful, but they rest on a small, non-random, single-site sample, and should not be read as representative of the national civil service. We conclude that office-level EDA is a low-cost, feasible first step toward more systematic, evidence-based budgeting for employee financial facilities in Bangladesh, and that its real value will only be realised once it is


Figure 3. Scatter plot of individual employee age plotted against religious affiliation, with each point representing one employee. The two-category horizontal axis (Muslim, Hindu) allows the vertical spread of ages within each group to be compared directly at the individual level. Unlike Figure 1, which groups employees into age bands, this plot preserves each employee's exact recorded age. It accompanies the discussion of age and religious composition in Section 3.2 and shows that age does not clearly separate the two groups. 


Figure 4. Histogram of borrower age, stratified by loan category (house-building, motorcycle, computer, and bicycle loans), with bars grouped by five-year age bands. The chart shows how the concentration of borrowers within each loan type shifts across the working-age range, without adjusting for the differing number of borrowers per loan category. It is the distributional companion to Table 2 and to the individual-level scatter plot in Figure 5. This figure underlies the age-and-loan-type discussion in Section 3.3.


Figure 5. Scatter plot of individual borrower age against loan category, with each point representing one loan-holding employee. Because loan category is a discrete variable, points for each category are shown along a shared vertical age axis, making within-category age spread and between-category differences visible side by side. The plot complements the age ranges reported in Table 2 by showing the underlying distribution rather than only the minimum and maximum. It supports the age-and-loan-type discussion in Section 3.3.


Figure 6. Histogram of employee age, stratified by the type of General Provident Fund (GPF) nominee recorded (spouse, parent, or other eligible relative), grouped into five-year age bands. The chart shows how nominee type varies across the age distribution, with spouse nominees dominating most bands. Bar heights represent raw counts rather than proportions within each age band. This figure underlies the age-and-nominee-type discussion in Section 3.4 and is complemented by the scatter plot in Figure 7.


Figure 7. Scatter plot of individual employee age against General Provident Fund nominee type, with each point representing one employee's recorded nominee category. The plot allows the age spread within each nominee category to be inspected directly, including the modest tendency for younger employees to name a parent rather than a spouse. It is the individual-level counterpart to the histogram in Figure 6. This figure supports the discussion of age and nominee choice in Section 3.4.


Figure 8. Time-series plot summarising trends across the expenditure-related variables examined in this study over the 2020-21 fiscal year reporting period. The chart is intended to give an at-a-glance view of how age-linked benefit categories track together over time, complementing the cross-sectional snapshots shown in Figures 1 through 7. It does not represent a forecast; rather, it visualises observed patterns within the single fiscal year covered by the dataset. This figure is referenced in the integrative discussion in Section 3.5.

extended to larger, more representative samples and paired with formal predictive modelling.

References


Ahmed, M. U., Kristal, M. M., & Pagell, M. (2014). Impact of operational and marketing capabilities on firm performance: Evidence from economic growth and downturns. International Journal of Production Economics, 154, 59–71. https://doi.org/10.1016/j.ijpe.2014.03.025

Arvanitis, S., & Loukis, E. (2017). Factors explaining ICT expenditure behaviour of Greek firms during the economic crisis 2009–2014. In Proceedings of the 7th International Conference on eDemocracy.

Behrens, J. T. (1997). Principles and procedures of exploratory data analysis. Psychological Methods, 2(2), 131-160. https://doi.org/10.1037/1082-989X.2.2.131

Blum, A., Hopcroft, J., & Kannan, R. (2020). Foundations of data science. Cambridge University Press. https://doi.org/10.1017/9781108755528

Burger, A., Damijan, J. P., Kostevc, C., & Rojec, M. (2017). Determinants of firm performance and growth during economic recession: The case of Central and Eastern European countries. Economic Systems, 41(4), 569–590. https://doi.org/10.1016/j.ecosys.2017.05.003

Craglia, M., De Nigris, S., Nepelski, D., van Bavel, R., & Pedersen, K. (Eds.). (2018). Artificial intelligence: A European perspective (EUR 29425 EN). Publications Office of the European Union.

Duan, Y., Edwards, J. S., & Dwivedi, Y. K. (2019). Artificial intelligence for decision making in the era of Big Data—Evolution, challenges and research agenda. International Journal of Information Management, 48, 63–71. https://doi.org/10.1016/j.ijinfomgt.2019.01.021

Eggers, W. D., Schatsky, D., & Viechnicki, P. (2017). AI-augmented government: Using cognitive technologies to redesign public sector work. Deloitte University Press.

Finance Division, Ministry of Finance, Government of Bangladesh. (2021). Monthly report on fiscal position, September 2020, fiscal year 2020-21. Government of Bangladesh.

Lai, Y., Saridakis, G., Blackburn, R., & Johnstone, S. (2016). Are the HR responses of small firms different from large firms in times of recession? Journal of Business Venturing, 31(1), 113–131. https://doi.org/10.1016/j.jbusvent.2015.04.005

Latham, S. (2009). Contrasting strategic response to economic recession in start-up versus established software firms. Journal of Small Business Management, 47(2), 180–201. https://doi.org/10.1111/j.1540-627X.2009.00267.x

Latham, S., & Braun, M. (2011). Economic recessions, strategy, and performance: A synthesis. Journal of Strategy and Management, 4(2), 96–115. https://doi.org/10.1108/17554251111128592

Ministry of Finance, Government of Bangladesh. (2020). Budget speech 2020-21: Economic transition and pathway to progress. Government of Bangladesh. https://mof.portal.gov.bd

Ministry of Finance, Government of Bangladesh. (2024). Budget in brief. Finance Division. https://mof.gov.bd

Organisation for Economic Co-operation and Development. (2019). Artificial intelligence in society. OECD Publishing.

Siegel, E. (2013). Predictive analytics: The power to predict who will click, buy, lie, or die. Wiley.

Tukey, J. W. (1977). Exploratory data analysis. Addison-Wesley.

Wickramasinghe, V., & Perera, G. (2012). HRM practices during the global recession (2008–2010): Evidence from globally distributed software development firms in Sri Lanka. Strategic Outsourcing: An International Journal, 5(3), 188–212. https://doi.org/10.1108/17538291211291747

Witten, I. H., Frank, E., Hall, M. A., & Pal, C. J. (2017). Data mining: Practical machine learning tools and techniques. Morgan Kaufmann.


Article metrics
View details
0
Downloads
0
Citations
8
Views

View Dimensions


View Plumx


View Altmetric


0
Save
0
Citation
8
View
0
Share