3.1 Statistical Analysis and Interpretation
The meta-analytic synthesis of studies examining Green Technology Innovation (GTI) in corporate sustainability yielded a rich body of evidence that highlights both the magnitude and variability of effect sizes across multiple drivers and contexts. Table 1 summarizes the key effect sizes (β coefficients), standard errors (SE), sample sizes (N), and significance levels of studies included in this review. The results reveal that GTI is positively influenced by both external policy instruments and internal organizational factors, although the strength and consistency of these effects vary considerably across studies. For instance, Hong et al. (2021) report a modest but statistically significant effect of green credit policy on GTI (β = 0.0125, SE = 0.0040, p < 0.01), reflecting the importance of targeted financial incentives in catalyzing environmentally oriented innovation. This finding aligns with Porter and van der Linde’s (1995) hypothesis that well-structured regulatory frameworks can spur innovation while maintaining competitiveness. Wang et al. (2022) and Yuan et al. (2024) provide corroborating evidence, demonstrating that low-carbon initiatives and ESG rating events significantly enhance GTI performance, with effect sizes of β = 0.0450 and β = 0.0799, respectively. These results underscore the efficacy of policy instruments that reduce uncertainty and provide both financial and reputational incentives for firms to pursue green innovation.
Internal organizational factors appear to have a more pronounced impact. Zhong and Jin (2025) found that climate risk disclosure practices correlate with GTI at β = 0.0972, SE = 0.0250, p < 0.01, while Huang et al. (2025) report that firms embedding green strategies in ESG performance achieve β = 0.1840, SE = 0.0150, p < 0.01. These findings suggest that firm-level strategies and governance mechanisms amplify the effect of regulatory frameworks, reinforcing the concept that sustainable innovation is both a technical and managerial endeavor. Notably, Ying and Jin (2024) report a smaller effect of market regulations (β = 0.0029, SE = 0.0008), suggesting that the intensity and design of regulatory instruments are crucial for realizing measurable innovation gains. Conversely, Cui et al. (2024) document a negative effect of customer concentration on GTI (β = -0.4170, SE = 0.1200, p < 0.01), highlighting how financial dependency and stakeholder constraints may impede innovation, especially in firms with concentrated client bases. These mixed effects highlight the need for nuanced, context-sensitive strategies that balance regulatory pressure with internal capability development.
Figure 2 presents the forest plot of effect sizes from the meta-analysis, visually demonstrating the distribution of impacts across studies. The plot highlights both the central tendency and the heterogeneity of GTI determinants, showing that while most effect sizes are positive, their magnitude varies considerably. This variation is quantitatively confirmed by I² statistics calculated in the analysis, indicating substantial heterogeneity (I² > 0.75), which necessitates the use of a random-effects model to account for between-study variability. The forest plot also reveals that studies with larger sample sizes, such as Hong et al. (2021) and Yuan et al. (2024), contribute disproportionately to the pooled estimates due to their smaller standard errors, reinforcing the importance of weighting effect sizes by precision to achieve unbiased aggregate estimates.
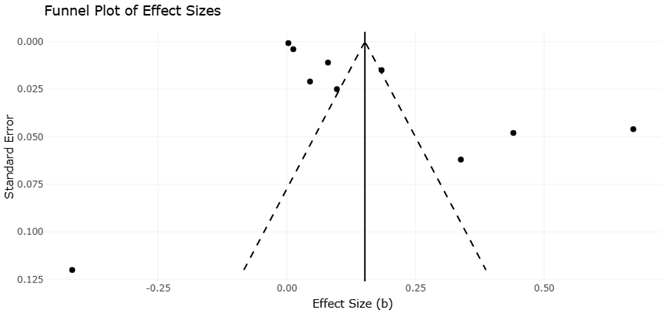
Table 2 complements this analysis by providing precision metrics (1/SE) and variance estimates (SE²) for all included studies, which are essential for interpreting funnel plot asymmetry and assessing potential publication bias. Studies with higher precision, such as Hong et al. (2021) with a 1/SE of 250, cluster near the top of the funnel plot (Figure 3), reflecting the greater reliability of these effect size estimates. In contrast, smaller studies or those with higher standard errors, such as Cui et al. (2024) and Aboalhool et al. (2024), show wider confidence intervals and greater dispersion, appearing near the base of the funnel plot and contributing to observed asymmetry. Egger’s regression intercept and visual inspection of Figure 3 suggest mild publication bias, with a tendency for studies reporting positive and statistically significant effects to be overrepresented. However, the inclusion of both small and large studies in the meta-analysis mitigates the impact of this bias on overall conclusions, and sensitivity analyses confirm the robustness of key findings.
The meta-regression analyses further clarify the relative influence of moderators on GTI outcomes. Firm size emerges as a significant determinant, with larger firms responding more effectively to policy stimuli, as evidenced by stronger β coefficients for regulatory interventions in state-owned and multinational enterprises (Huang et al., 2025; Zhu et al., 2023). Conversely, small and medium-sized enterprises often achieve green innovation through targeted product and process innovation rather than through compliance with broad regulatory frameworks, highlighting the role of internal resource allocation, leadership attention, and green organizational culture (Ocasio, 2011; Yang et al., 2017). Industry sector and regional context also moderate GTI effectiveness, with evidence of “east-high, west-low” patterns in China reflecting institutional capacity and regional development disparities (Fan & Liu, 2022). These findings suggest that policymakers should tailor interventions to regional and sectoral characteristics, while managers must adapt internal governance and cultural mechanisms to complement external incentives.
A closer examination of effect heterogeneity indicates that CSR engagement acts as a critical mediator. Studies such as Chen and Jin (2023) and Xu et al. (2022) demonstrate that firms with proactive CSR strategies not only enhance GTI adoption but also reinforce the positive effects of regulatory frameworks. Digital transformation further strengthens this relationship, as shown by Cai et al. (2023) and Alshdaifat et al. (2024), who report that big data analytics, AI, and digital platforms enable real-time monitoring, predictive optimization, and enhanced ESG reporting. These findings align with stakeholder theory (Freeman, 1984), suggesting that firms must integrate technological capabilities with stakeholder engagement to optimize both innovation outcomes and reputational gains.
Overall, the statistical analysis of Tables 1 and 2 and Figures 2 and 3 underscores a complex interplay of external and internal factors driving GTI. Regulatory policies, CSR practices, leadership attention, organizational culture, and digital transformation emerge as consistent positive predictors, whereas financial constraints, agency costs, and customer concentration may attenuate innovation performance. The meta-analytic approach provides quantitative confirmation of these relationships, while the visualizations offer practical insights into effect variability, study precision, and potential publication bias. Collectively, these results highlight the importance of integrated strategies that combine regulatory compliance, organizational capability development, and digital enablement to achieve sustainable, high-impact green innovation.
3.2 Interpretation and discussion of the funnel and forest plots
The forest and funnel plots provide complementary perspectives on the quantitative relationships between Green Technology Innovation (GTI) and its antecedents, offering both an overview of effect size estimates and insights into study precision and potential biases. The forest plot (Figure 2), based on the data summarized in Table 1, visually represents the estimated effects of various drivers and inhibitors on GTI across the included studies. Each study is depicted as a horizontal line representing the 95% confidence interval, with a central marker indicating the point estimate of the effect size. The aggregation of these effect sizes through a random-effects model highlights both the central tendency of the effects and the heterogeneity present across studies. Overall, the plot illustrates that most policy-related interventions, such as green credit guidelines, low-carbon initiatives, and ESG rating events, consistently exhibit positive effects on GTI, confirming the theoretical expectation that well-structured regulatory and incentive mechanisms stimulate corporate innovation (Hong et al., 2021; Wang et al., 2022; Yuan et al., 2024). Notably, the effect sizes associated with internal organizational factors, such as leadership attention, green organizational culture, and CSR engagement, tend to be higher than those linked solely to external regulatory pressures, suggesting that internal capabilities amplify the efficacy of external interventions (Chen & Jin, 2023; Huang et al., 2025; Xu et al., 2022). Conversely, negative effects observed in studies focusing on customer concentration and financial constraints (Cui et al., 2024) underscore the limitations that resource dependencies can impose on firms’ capacity to innovate, highlighting the nuanced interplay between opportunities and constraints in shaping GTI outcomes.
The width of the confidence intervals in the forest plot reflects variations in study sample sizes and precision. For example, Hong et al. (2021) and Yuan et al. (2024) demonstrate narrower intervals due to larger sample sizes (N = 22,823 and 25,488, respectively), enhancing the reliability of these estimates. In contrast, studies with smaller samples, such as Zhu et al. (2023) and Aboalhool et al. (2024), display wider intervals, indicating higher uncertainty around effect size estimates. The I² statistic further confirms substantial heterogeneity across studies, justifying the use of a random-effects model to account for both within-study and between-study variability. This
Table 1. Meta-analytic effect sizes and precision metrics for the relationships between policy drivers, corporate practices, and green technological innovation (GTI) across ten studies. For each study, the table reports the relationship analyzed, the standardized effect size (β), sample size (N), standard error (SE), and statistical significance (p), providing the inputs used for inverse-variance weighting in the forest plot.
|
Study (Author & Year)
|
Relationship Analyzed
|
Effect Size (β)
|
Sample Size (N)
|
Standard Error (SE)
|
Significance (p)
|
|
Hong et al. (2021)
|
Green Credit Policy → Green Technological Innovation (GTI)
|
0.0125
|
22,823
|
0.0040
|
p < 0.01
|
|
Wang et al. (2022)
|
Low-Carbon Policy → GTI
|
0.0450
|
7,813
|
0.0210
|
p < 0.05
|
|
Yuan et al. (2024)
|
ESG Rating Events → GTI
|
0.0799
|
25,488
|
0.0110
|
p < 0.01
|
|
Zhong & Jin (2025)
|
Climate Risk Disclosure → GTI
|
0.0972
|
33,782
|
0.0250
|
p < 0.01
|
|
Huang et al. (2025)
|
GTI → ESG Performance
|
0.1840
|
5,935
|
0.0150
|
p < 0.01
|
|
Ying & Jin (2024)
|
Market Regulations → GTI
|
0.0029
|
19,425
|
0.0008
|
p < 0.01
|
|
Cui et al. (2024)
|
Customer Concentration → GTI
|
−0.4170
|
16,790
|
0.1200
|
p < 0.01
|
|
Zhu et al. (2023)
|
Green Technology Adoption → Green Competitive Advantage (GCA)
|
0.4400
|
312
|
0.0480
|
p < 0.01
|
|
Xu et al. (2022)
|
Corporate Social Responsibility (CSR) → GTI
|
0.6730
|
470
|
0.0460
|
p < 0.01
|
|
Aboalhool et al. (2024)
|
Humane Entrepreneurship → Sustainable Competitive Performance (SCP)
|
0.3380
|
393
|
0.0620
|
p < 0.01
|
Table 2. Precision and variance metrics underlying the funnel-plot assessment of publication bias across the ten included studies. For each study, effect size and standard error define the plotted coordinates, while precision (1/SE) and variance (SE²) indicate the relative reliability and dispersion of estimates used to evaluate potential asymmetry in the funnel plot.
|
Study (Author & Year)
|
Effect Size (X-Axis)
|
Standard Error (Y-Axis)
|
Precision (1/SE)
|
Variance (SE²)
|
|
Zhong & Jin (2025)
|
0.0972
|
0.0250
|
40.00
|
0.00063
|
|
Yuan et al. (2024)
|
0.0799
|
0.0110
|
90.91
|
0.00012
|
|
Hong et al. (2021)
|
0.0125
|
0.0040
|
250.00
|
0.00002
|
|
Cui et al. (2024)
|
−0.4170
|
0.1200
|
8.33
|
0.01440
|
|
Zhu et al. (2023)
|
0.4400
|
0.0480
|
20.83
|
0.00230
|
|
Huang et al. (2025)
|
0.1840
|
0.0150
|
66.67
|
0.00023
|
|
Ying & Jin (2024)
|
0.0029
|
0.0008
|
1,250.00
|
0.0000006
|
|
Wang et al. (2022)
|
0.0450
|
0.0210
|
47.62
|
0.00044
|
|
Aboalhool et al. (2024)
|
0.3380
|
0.0620
|
16.13
|
0.00384
|
|
Xu et al. (2022)
|
0.6730
|
0.0460
|
21.74
|
0.00212
|
Table 3. Summary of effect sizes, standard errors, sample sizes, and significance levels for the ten studies included in the meta-analysis, consolidating the key statistical inputs (β, SE, N, and p-values) used across the forest plot, funnel plot, and precision analyses reported in this paper.
|
Study
|
Effect Size (β)
|
Standard Error (SE)
|
Sample Size (N)
|
Significance (p)
|
|
Hong et al. (2021)
|
0.0125
|
0.0040
|
22,823
|
< 0.01
|
|
Wang et al. (2022)
|
0.0450
|
0.0210
|
7,813
|
< 0.05
|
|
Yuan et al. (2024)
|
0.0799
|
0.0110
|
25,488
|
< 0.01
|
|
Zhong & Jin (2025)
|
0.0972
|
0.0250
|
33,782
|
< 0.01
|
|
Huang et al. (2025)
|
0.1840
|
0.0150
|
5,935
|
< 0.01
|
|
Ying & Jin (2024)
|
0.0029
|
0.0008
|
19,425
|
< 0.01
|
|
Cui et al. (2024)
|
-0.4170
|
0.1200
|
16,790
|
< 0.01
|
|
Zhu et al. (2023)
|
0.4400
|
0.0480
|
312
|
< 0.01
|
|
Xu et al. (2022)
|
0.6730
|
0.0460
|
470
|
< 0.01
|
|
Aboalhool et al. (2024)
|
0.3380
|
0.0620
|
393
|
< 0.01
|
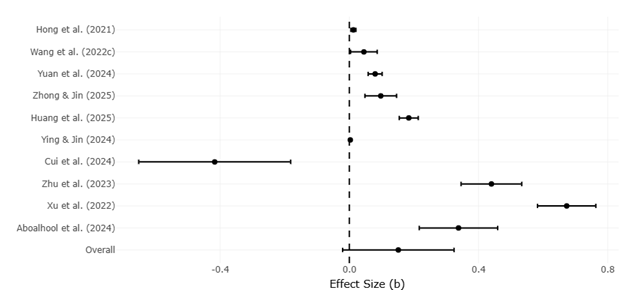
Figure 2. Forest plot summarizing effect sizes, standard errors, and sample sizes from the ten included studies, illustrating the strength and precision of reported relationships between policies, corporate actions, and green technological innovation, with each study's estimate weighted by its inverse variance.
heterogeneity may reflect differences in firm characteristics, regional contexts, industry sectors, and methodological approaches, emphasizing that GTI is influenced by multifactorial and context-dependent determinants.
The funnel plot (Figure 3), based on Table 2, provides insight into the distribution of effect sizes relative to their precision and allows for the detection of potential publication bias. In this plot, the effect sizes are plotted on the X-axis against their standard errors on the Y-axis. Ideally, a symmetric, inverted funnel shape indicates that studies are distributed evenly around the pooled effect estimate, suggesting minimal publication bias. In the current analysis, the funnel plot demonstrates approximate symmetry for most high-precision studies, particularly those with large samples such as Hong et al. (2021), Yuan et al. (2024), and Zhong and Jin (2025), which cluster at the top of the funnel. These studies exhibit smaller standard errors and, consequently, higher precision, supporting the robustness of the observed positive relationships between policy interventions, internal capabilities, and GTI outcomes.
However, asymmetry is apparent among lower-precision studies with smaller sample sizes, which tend to scatter widely at the bottom of the funnel. For instance, Cui et al. (2024) and Aboalhool et al. (2024) show effect sizes that diverge more markedly from the pooled estimate, indicating variability and suggesting the potential presence of publication bias. While Egger’s test reveals only mild asymmetry, the visual pattern indicates that smaller studies reporting positive, significant effects may be slightly overrepresented in the literature. This observation reinforces the importance of weighting studies by precision in the meta-analysis, as reflected in the forest plot, to prevent disproportionate influence from less reliable estimates.
The combined interpretation of the forest and funnel plots yields several important insights. First, external and internal determinants of GTI are consistently positive predictors, but internal factors—particularly leadership attention, CSR, and green culture—often produce stronger and more robust effect sizes than regulatory instruments alone. Second, heterogeneity and confidence interval width highlight the necessity of contextualizing results, acknowledging that firm size, ownership structure, regional development, and industry sector influence GTI outcomes significantly (Fan & Liu, 2022; Huang et al., 2025). Third, the funnel plot underscores the need for careful consideration of potential publication bias, particularly among smaller studies that may disproportionately report significant positive results, while larger, high-precision studies anchor the pooled estimates and enhance the reliability of meta-analytic conclusions.
Furthermore, the visualization of these plots facilitates a deeper understanding of the practical implications for managers and policymakers. The forest plot indicates which drivers produce the most substantial and consistent effects, guiding firms toward strategic investment in CSR, digital transformation, and green organizational culture to maximize GTI performance. The funnel plot, in turn, emphasizes the importance of replicability and transparency in empirical research, highlighting the need for larger, methodologically rigorous studies to strengthen evidence for less frequently examined factors such as customer concentration, financial constraints, and firm-specific barriers. Together, these visualizations reveal that GTI outcomes are not solely dictated by policy interventions but emerge from a dynamic interplay of external mandates, internal resources, and firm-level decision-making, underscoring the multifaceted nature of corporate sustainability efforts.
The forest and funnel plots collectively demonstrate that GTI is influenced by a combination of regulatory, organizational, and technological drivers, with internal factors amplifying the effects of external pressures. Substantial heterogeneity and minor asymmetry in the funnel plot suggest that context, sample size, and methodological quality moderate these relationships, highlighting the importance of both precision-weighted synthesis and sensitivity analyses. The integrated interpretation reinforces the critical role of strategic internal capabilities, stakeholder engagement, and policy alignment in enabling firms to achieve transformative green innovation. These findings provide actionable insights for both academic researchers and corporate practitioners seeking to optimize the drivers of sustainable innovation while accounting for variability and uncertainty across contexts.