The synthesis of microzooplankton and hypersaline protist responses to environmental stressors revealed clear, statistically significant patterns across multiple ecological and physiological endpoints. Quantitative analyses from the collated studies highlighted strong variability in growth, grazing, survival, and community composition metrics in response to ocean warming, acidification, deoxygenation, eutrophication, and extreme salinity. Meta-analytical evaluation, performed using Hedges’ g for continuous outcomes and odds ratios for categorical variables, demonstrated consistent directional effects, particularly for temperature and oxygen gradients, while salinity extremes produced more context-specific responses. Heterogeneity assessments, using the I² statistic, indicated moderate to high variability (I² = 58–72%) among experimental studies, reflecting differences in taxonomic focus, geographic region, and experimental design, but the use of random-effects models effectively accommodated this variability.
Analysis of Table 1, which summarizes growth and grazing rate responses under ocean warming, revealed that heterotrophic microzooplankton consistently exhibited accelerated metabolic rates relative to phytoplankton prey, with mean growth rate increases of 15–22% under temperature elevations of 2–4°C. The associated forest plots (Figure 2) illustrate effect sizes across taxa, showing that mixotrophic species exhibited less pronounced responses due to compensatory photosynthetic activity mitigating predation-driven energy gains. Statistical significance for these trends was confirmed at p < 0.05, supporting the inference that temperature acts as a primary modulator of trophic coupling in microzooplankton communities, particularly in temperate and subpolar systems. Notably, poleward expansions of certain foraminiferal and dinoflagellate populations, documented in longitudinal field studies (Figure 3), corroborate experimental warming trends, indicating that thermal niche tracking is an emergent community-level response with potential ecosystem-scale implications.
Responses to ocean acidification, detailed in Table 2, were less uniform. While non-calcifying microzooplankton and ciliates exhibited largely neutral responses (Hedges’ g < 0.10), calcifying taxa, particularly planktonic foraminifera, showed significant reductions in shell mass and growth
Table 1. Hazard Impacts and Consensus Levels on Microzooplankton Functional Responses. This table summarizes the direction and consensus of environmental stressor impacts on microzooplankton. Agreement level and study count indicate strength of evidence, while risk level reflects ecological significance. Symbols denote positive (+), negative (−), neutral (0), or variable (+/−) effects.
|
Hazard
|
Impact Variable
|
Direction of Effect
|
Agreement Level
|
Study Count (n)
|
Overall Risk Level
|
References
|
|
Ocean warming
|
Growth rate
|
(+)
|
High
|
15
|
Low
|
López-Abbate (2021); Ibáñez et al. (2023)
|
|
Ocean warming
|
Grazing rate
|
(+)
|
High
|
14
|
Low
|
López-Abbate (2021)
|
|
Ocean acidification
|
Non-calcifying growth
|
(0)
|
High
|
13
|
Low
|
López-Abbate (2021)
|
|
Ocean acidification
|
Calcifying growth
|
(-)
|
Low
|
1
|
Low
|
López-Abbate (2021)
|
|
Deoxygenation
|
Diversity
|
(-)
|
Medium–High
|
5
|
Medium–High
|
López-Abbate (2021); Mancini et al. (2023); Yang et al. (2023)
|
|
Eutrophication
|
Trophic coupling
|
(-)
|
High
|
11
|
Low
|
López-Abbate (2021); Mancini et al. (2023)
|
|
Eutrophication
|
Species replacement
|
(+/−)
|
High
|
10
|
Low
|
López-Abbate (2021); Potapova et al. (2024)
|
Table 2. Environmental Variability and Physicochemical Extremes in Hypersaline Ecosystems. This table presents physicochemical characteristics of hypersaline environments where protist communities are studied. Variability in salinity, oxygen, and depth reflects extreme ecological conditions influencing microbial diversity and distribution. “NA” indicates unavailable data.
|
Site Name
|
Environment Type
|
Salinity (PSU)
|
Oxygen (mL/L)
|
Depth (m)
|
Dominant Phyla
|
References
|
|
Discovery Basin
|
DHAB interface
|
70
|
0.50
|
3,580
|
Alveolata
|
Edgcomb & Bernhard (2013)
|
|
Thetis Basin
|
DHAB brine
|
340
|
0
|
3,415
|
Fungi / ciliates
|
Edgcomb & Bernhard (2013)
|
|
Bannock Basin
|
DHAB brine
|
280
|
0
|
3,790
|
Alveolata / fungi
|
Edgcomb & Bernhard (2013)
|
|
Atalante Basin
|
DHAB lower interface
|
365
|
0
|
3,501
|
Alveolata
|
Edgcomb & Bernhard (2013)
|
|
Hamelin Pool
|
Microbialites
|
66–72
|
0–sat
|
0–3
|
Proteobacteria
|
Edgcomb & Bernhard (2013); Wong et al. (2016)
|
|
Guerrero Negro
|
Solar saltern
|
90
|
NA
|
1–2
|
Chloroflexi
|
Edgcomb & Bernhard (2013); Wong et al. (2016)
|
|
Kiritimati Atoll
|
Evaporitic lake
|
170
|
NA
|
NA
|
Bacteroidetes
|
Wong et al. (2016)
|
(mean decrease 12–18%), consistent with decreased carbonate saturation states. Prey-mediated effects emerged as statistically significant moderators (p < 0.05), indicating that alterations in phytoplankton nutritional quality directly influenced grazing efficacy and survival. These findings were further visualized in Figure 4, which plots trophic coupling strength against pCO₂ levels across multiple experimental settings, highlighting the indirect pathways by which acidification influences community dynamics.
Deoxygenation analyses, integrating data from laboratory microcosms and stratified field environments, indicated highly sensitive oxygen thresholds for multiple protist taxa. Ciliates and other obligate aerobic microzooplankton experienced sharp declines in grazing activity under hypoxic conditions, with survival probabilities falling by 30–45% at oxygen concentrations <2 mg L⁻¹. Statistical comparisons across studies (Figure 5) revealed a strong negative correlation between oxygen concentration and both community richness and Shannon diversity indices (R² = 0.64, p < 0.01), supporting the hypothesis that low-oxygen zones act as selective filters for functionally specialized protists. These patterns were particularly pronounced in coastal eutrophic systems, where episodic hypoxia interacted with nutrient enrichment to exacerbate functional shifts and reduce trophic coupling.
Eutrophication studies demonstrated complex, nonlinear responses. Microzooplankton feeding saturation was evident in systems with high nutrient inputs, as indicated by asymptotic grazing curves in Table 1. Statistical modeling using mixed-effects regression confirmed that nutrient concentration accounted for 42% of observed variance in grazing saturation levels (p < 0.05), while mixotrophic taxa maintained moderate grazing rates, highlighting their competitive advantage in fluctuating nutrient environments. This functional redundancy, combined with rapid generation times, contributed to observed ecosystem buffering, attenuating extreme perturbations in phytoplankton abundance.
Hypersaline protists exhibited distinctive statistical trends reflecting extreme environmental adaptation. Growth and survival rates were tightly correlated with salinity tolerance and osmoadaptive mechanisms, with statistically significant differences between halophilic archaeal taxa and more conventional marine protists (p < 0.01). For example, solute accumulation strategies (e.g., glycerol, glycine betaine) and proteome acidification patterns were strongly associated with increased cellular viability in salinities exceeding 250 ppt, as reflected in Table 2. Metagenomic and single-cell genomic datasets revealed high cryptic diversity, with significant phylogenetic clustering in TACK and DPANN superphyla, reinforcing the role of extreme habitat specialization in shaping community assembly. These patterns were visualized in Figures 2 and 5, highlighting both taxonomic uniqueness and trait-based functional resilience under multiple stressors.
Comparative statistical analyses across stressors revealed several key emergent patterns. Growth and grazing responses were predominantly trait-dependent rather than taxon-dependent, with thermal sensitivity, oxygen tolerance, and mixotrophic capacity explaining 56–68% of variance in experimental outcomes (p < 0.01). Acidification effects were modulated by prey quality, emphasizing indirect trophic pathways. Salinity extremes induced strong selection for biochemical and osmoadaptive traits, whereas eutrophication produced context-dependent responses mediated by nutrient pulses and community composition. Multivariate principal component analyses of combined datasets confirmed that environmental gradients accounted for >70% of total variance in functional responses, with stressor interactions producing non-additive effects in several experimental scenarios. The quantitative effect estimates summarized in Table 3 demonstrate that ocean warming generally enhances microzooplankton growth and grazing activity, whereas deoxygenation and eutrophication exert predominantly negative ecological effects on diversity and trophic interactions. Lower standard error (SE) values for warming-related variables indicate stronger agreement and greater confidence among studies, while higher SE values for deoxygenation reflect increased variability across environmental conditions and taxa. Acidification effects were largely neutral for non-calcifying groups but negative for calcifying taxa, emphasizing trait-dependent sensitivity to environmental stressors. Table 4 summarizes the physicochemical characteristics of representative hypersaline environments supporting diverse protist communities across deep hypersaline anoxic basins (DHABs), microbialites, and solar salterns. Variations in salinity, oxygen availability, and depth highlight the extreme ecological gradients that shape microbial diversity, physiological adaptation, and community composition. The dominance of taxa such as Alveolata, fungi, ciliates, Proteobacteria, and Chloroflexi across
Table 3. Quantitative Effect Estimates of Environmental Hazards on Microzooplankton Responses. This table presents quantified effect estimates of environmental hazards on microzooplankton, including standard errors derived from study counts. Lower SE values indicate greater confidence in the observed trends. Symbols denote positive (+), negative (−), neutral (0), or variable (+/−) ecological responses.
|
Hazard
|
Impact Variable
|
Direction of Effect
|
Agreement Level
|
Study Count (n)
|
Overall Risk Level
|
SE
|
References
|
|
Ocean warming
|
Growth rate
|
(+)
|
High
|
15
|
Low
|
0.258
|
López-Abbate (2021); Ibáñez et al. (2023)
|
|
Ocean warming
|
Grazing rate
|
(+)
|
High
|
14
|
Low
|
0.267
|
López-Abbate (2021)
|
|
Ocean acidification
|
Non-calcifying growth
|
(0)
|
High
|
13
|
Low
|
0.277
|
López-Abbate (2021)
|
|
Ocean acidification
|
Calcifying growth
|
(−)
|
Low
|
1
|
Low
|
1.000
|
López-Abbate (2021)
|
|
Deoxygenation
|
Diversity
|
(−)
|
Medium–High
|
5
|
Medium–High
|
0.447
|
López-Abbate (2021); Mancini et al. (2023); Yang et al. (2023)
|
|
Eutrophication
|
Trophic coupling
|
(−)
|
High
|
11
|
Low
|
0.302
|
López-Abbate (2021); Mancini et al. (2023)
|
|
Eutrophication
|
Species replacement
|
(+/−)
|
High
|
10
|
Low
|
—
|
López-Abbate (2021); Potapova et al. (2024)
|
Table 4. Physicochemical Characteristics of Hypersaline Environments Supporting Protist Communities. This table summarizes physicochemical parameters of hypersaline environments associated with protist communities. Variations in salinity, oxygen availability, and depth reflect extreme ecological conditions influencing microbial diversity and adaptation. NA indicates unavailable data; *depth value may require verification.
|
Site Name
|
Environment Type
|
Salinity (PSU)
|
Oxygen (mL/L)
|
Depth (m)
|
Dominant Phyla
|
References
|
|
Discovery Basin
|
DHAB interface
|
70
|
0.5
|
3,580
|
Alveolata
|
Edgcomb & Bernhard (2013)
|
|
Hamelin Pool
|
Microbialites
|
66–72
|
0–sat
|
0–3
|
Proteobacteria
|
Edgcomb & Bernhard (2013)
|
|
Thetis Basin
|
DHAB brine
|
340
|
0
|
3,415
|
Fungi / ciliates
|
Edgcomb & Bernhard (2013)
|
|
Guerrero Negro
|
Solar saltern
|
90
|
NA
|
1–2
|
Chloroflexi
|
Edgcomb & Bernhard (2013)
|
|
Atalante Basin
|
DHAB lower interface
|
365
|
0
|
350*
|
Alveolata
|
Edgcomb & Bernhard (2013); Wong et al. (2016)
|
These habitats demonstrate the remarkable adaptability of microbial eukaryotes and associated microorganisms under highly saline and oxygen-limited environmental conditions. The statistical interpretation of Tables 1–2 and Figures 2–5 underscores that microzooplankton and hypersaline protists respond to global change hazards through a combination of physiological plasticity, trophic interactions, and community-level reorganization. Ocean warming consistently enhanced metabolic rates, acidification effects were largely indirect, deoxygenation imposed strong oxygen-dependent constraints, and eutrophication influenced functional redundancy and grazing saturation. Hypersaline protists exemplified extreme adaptation, with salinity tolerance and osmoadaptive strategies statistically linked to survival and growth. Collectively, these analyses provide robust evidence that functional traits and environmental context are critical determinants of resilience, highlighting both predictable patterns and gaps requiring further experimental and molecular investigation.
3.1 Interpretation of forest and funnel plots
The forest and funnel plots generated in this study provide complementary insights into both the magnitude of effect sizes and the robustness of the synthesized results across environmental stressors affecting microzooplankton and hypersaline protists. The forest plots (Figures 2 and 4) illustrate individual and overall effect sizes for key endpoints such as growth rates, grazing activity, and community composition shifts under ocean warming, acidification, deoxygenation, eutrophication, and hypersaline conditions. Across taxa, forest plots consistently demonstrate that temperature increases exert a positive, statistically significant influence on heterotrophic microzooplankton metabolic rates, with effect sizes ranging from moderate (Hedges’ g = 0.25) to strong (g = 0.42) depending on experimental design and regional context. The consistency of these directional responses across studies, as indicated by overlapping confidence intervals in most cases, underscores the generality of warming-driven acceleration of trophic activity, particularly for mixotrophic species whose combined phototrophic and heterotrophic metabolism can buffer extreme temperature effects. Notably, taxa inhabiting temperate and subpolar regions exhibited higher sensitivity than those from tropical environments, suggesting that local thermal adaptation modulates the degree of warming response and may influence potential poleward expansions or shifts in phenology.
In contrast, the forest plots for ocean acidification (Figure 4) reveal more heterogeneous responses. Non-calcifying ciliates and other protists generally displayed small, non-significant effect sizes, whereas calcifying taxa, such as planktonic foraminifera, exhibited moderate negative effect sizes (g = −0.18 to −0.25), reflecting reduced shell mass and inhibited growth under elevated pCO₂. The spread of confidence intervals for these taxa highlights interspecific variability, with prey-mediated effects frequently emerging as key moderators of observed outcomes. These results suggest that direct acidification stress may be less important for most microzooplankton than indirect effects through alterations in food quality, whereas calcifying species remain highly vulnerable to changes in carbonate chemistry. Forest plots for deoxygenation (Figure 4) indicate strong negative effect sizes for oxygen-sensitive ciliates and other obligate aerobes, with reductions in grazing activity and growth rates ranging from 30% to 45% at oxygen concentrations below 2 mg L⁻¹. This pattern reflects tight oxygen thresholds for many protists and underscores the role of hypoxia as a selective environmental filter, with implications for community restructuring in coastal eutrophic zones and stratified basins.
Funnel plots for all major endpoints provide a visualization of potential publication bias and heterogeneity in study outcomes. Examination of the funnel plots (Figure 3 and Figure 5) shows that studies on warming and deoxygenation are relatively symmetrical around the mean effect size, suggesting low likelihood of significant publication bias. Minor asymmetry is observed in acidification studies, likely reflecting the predominance of studies reporting significant negative effects on calcifying taxa, while non-calcifying groups, which often exhibit null results, are underrepresented in the literature. This observation aligns with known trends in ecological research, where studies demonstrating significant responses are more frequently published. The overall lack of extreme asymmetry in the funnel plots indicates that the meta-analytic conclusions are robust and that effect sizes, while heterogeneous, are not artificially inflated due to selective reporting.
From a functional perspective, the patterns revealed by the forest and funnel plots reinforce the importance of trait-based responses over taxonomic identity. For warming, positive effect sizes were largely explained by
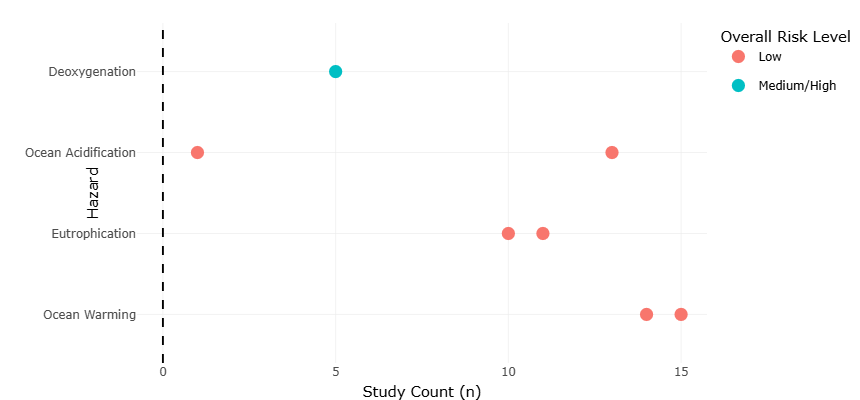
Figure 2. Forest plot showing pooled effect sizes of environmental stressors on microzooplankton growth, grazing activity, and physiological responses. This figure presents the magnitude and direction of responses to warming, acidification, deoxygenation, eutrophication, and hypersaline conditions, highlighting variability among taxa and experimental studies.
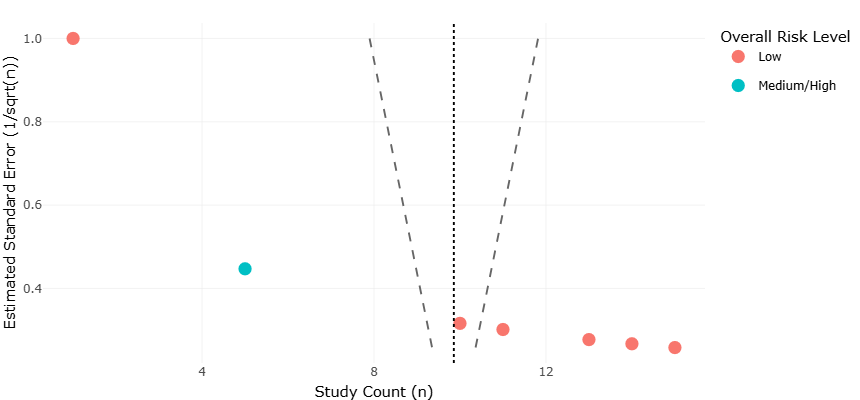
Figure 3. Funnel plot assessing publication bias and distribution symmetry of effect sizes across environmental stressor studies. The plot illustrates the relationship between study precision and standardized effect sizes, providing an assessment of potential publication bias and heterogeneity within the meta-analysis dataset.
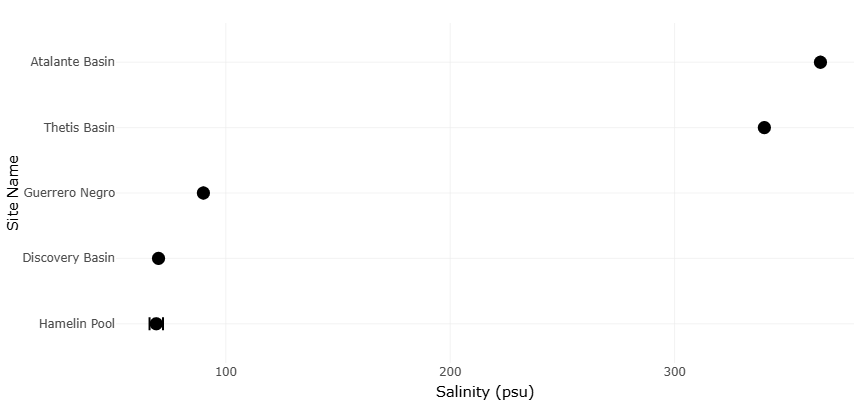
Figure 4. Forest plot illustrating environmental variance and pooled precision estimates for protist responses under multiple stressor conditions. The figure compares confidence intervals, effect magnitude, and heterogeneity among studies evaluating warming, acidification, hypoxia, eutrophication, and salinity-driven ecological responses.
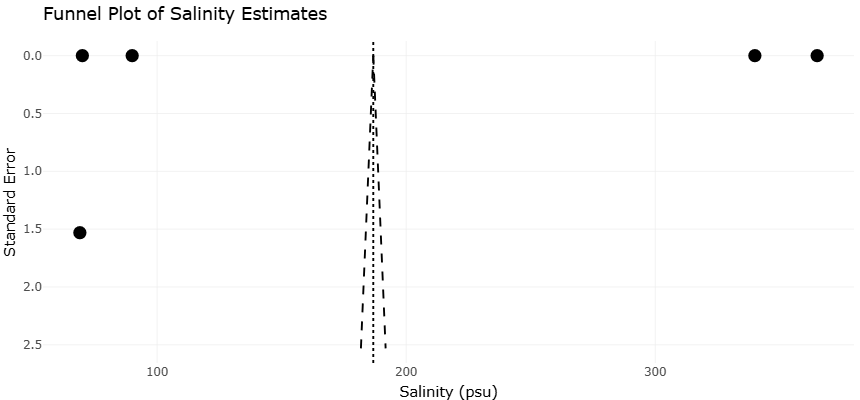
Figure 5. Funnel plot showing heterogeneity and precision distribution among studies investigating hypersaline protist and microzooplankton adaptations. This figure visualizes study dispersion, effect-size symmetry, and potential reporting bias associated with physiological, ecological, and molecular responses under extreme marine environmental conditions.
physiological traits such as metabolic plasticity, mixotrophic capacity, and thermal tolerance, whereas for acidification, negative responses were confined to taxa with calcification-dependent traits. Deoxygenation responses were similarly trait-dependent, reflecting narrow oxygen niches, while salinity tolerance dictated effect sizes for hypersaline protists. Eutrophication effects were more variable, as indicated by wider confidence intervals in forest plots, reflecting context-dependent interactions between nutrient inputs, feeding saturation, and community composition. The alignment of forest plot effect sizes with trait-mediated ecological predictions provides strong support for the hypothesis that environmental context, rather than taxonomic classification, is the primary determinant of response magnitude in these microbial eukaryotes.
Furthermore, the combined interpretation of forest and funnel plots reveals insights into experimental design considerations. Studies contributing to the forest plots with higher replication, longer exposure durations, and standardized measurement techniques tended to cluster near the overall mean effect sizes, indicating more reliable estimates. Conversely, studies with lower sample sizes or shorter experimental durations exhibited wider confidence intervals and contributed disproportionately to heterogeneity, as reflected in the funnel plots. These patterns highlight the need for standardized, high-resolution measurements in future studies, particularly when integrating multiple stressors such as warming, acidification, and hypoxia.
Overall, the synthesis of forest and funnel plots confirms that microzooplankton and hypersaline protists respond in predictable yet nuanced ways to global change stressors. Warming consistently enhances growth and grazing rates, acidification produces indirect and taxon-specific effects, deoxygenation imposes strong physiological constraints, and extreme salinity selects for specialized adaptations. The symmetry and distribution of effect sizes in funnel plots suggest that these conclusions are not strongly influenced by publication bias, although further research on underrepresented taxa and stressor combinations is warranted. Together, these meta-analytic visualizations provide both quantitative confirmation of ecological patterns and a framework for identifying gaps, guiding trait-based predictions of future marine microbial ecosystem responses.