3.1 Design and reporting standards
This review will be conducted as a protocol-led systematic review, reported in line with the PRISMA 2020 statement (Page et al., 2021), with search reporting following the PRISMA-S extension (Rethlefsen et al., 2021) and — a step that is easy to skip but shouldn’t be — peer review of the MEDLINE strategy using the PRESS checklist before a single record is retrieved (McGowan et al., 2016). Where quantitative pooling is not appropriate, which we expect for a meaningful share of this literature, findings will be reported using Synthesis Without Meta-analysis (SWiM) principles (Campbell et al., 2020) rather than forced into a summary statistic that would misrepresent heterogeneous evidence. The protocol will be posted on the Open Science Framework before screening begins and, if the eligibility scope meets current registration criteria, submitted to PROSPERO as well. We flag this order deliberately: registration precedes screening, not the other way around.
3.2 Review framework (PICOS)
Table 2 sets out the review’s PICOS framework in full. Briefly, the population comprises human cancers, cancer-derived experimental systems, patient-derived material, or computational cancer datasets; the index approach is
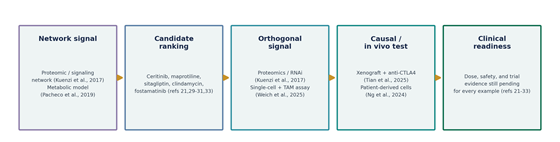
Figure 3. Evidentiary pathway traced by illustrative approved-drug repurposing studies. This figure follows eight published approved-drug candidates through five sequential evidentiary stages — network signal, candidate ranking, orthogonal biochemical or cellular signal, causal or in vivo testing, and clinical readiness — using ceritinib, maprotiline, sitagliptin, clindamycin, and related examples discussed in Section 4.1 and tabulated fully in Table 8. Every example reviewed reaches at least the orthogonal-signal stage, and several reach causal or in vivo testing, but none yet reaches confirmed clinical readiness, which is the pathway’s intended message: further rightward movement, not the existence of a network prediction itself, is what should drive translational confidence.
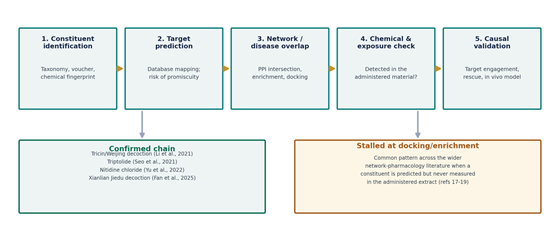
Figure 4. Natural-product evidence chain from constituent identification to causal validation. This figure decomposes the standard natural-product network-pharmacology workflow into five sequential steps and then splits the outcome into two contrasting patterns observed across the literature reviewed in Section 4.2 and Table S1. The left-hand branch (“confirmed chain”) lists examples — Tricin/Weijing decoction, triptolide, nitidine chloride, and Xianlian Jiedu decoction — where the predicted constituent was chemically confirmed in the administered material and carried through to causal or in vivo validation. The right-hand branch (“stalled at docking/enrichment”) describes the more common pattern in the wider literature, where a constituent is computationally predicted but never measured in what was actually tested, leaving the evidence chain incomplete at an early stage.
Table 1. Operational definitions applied to the review’s key constructs. This table defines, for consistent use throughout screening and extraction, what this review means by a network-driven study, a natural product, an approved drug, a targeted therapy, and translational readiness, together with the practical implication each definition carries for inclusion or interpretation. The definitions are designed to prevent common ambiguities — for example, distinguishing a study in which the network materially shaped candidate selection from one in which a network diagram was added only after the candidate had already been chosen.
|
Construct
|
Operational definition
|
Review implication
|
|
Network-driven
|
Network analysis changes target, compound, or combination ranking; the network is not merely decorative.
|
Exclude studies that create a network only after candidates are selected.
|
|
Natural product
|
Isolated molecule, derivative, standardized extract, or component-resolved botanical formula.
|
Stratify isolated molecules, extracts, and multi-component formulas separately.
|
|
Approved drug
|
Authorized for human use by at least one recognized regulator and evaluated in a new cancer context.
|
Record regulator, original indication, dose plausibility, and oncology status.
|
|
Targeted therapy
|
Candidate linked to a defined cancer target, pathway, module, state, or subtype.
|
Do not imply clinical efficacy from mechanistic assignment alone.
|
|
Translational readiness
|
Highest independently supported level, from computational prediction to prospective clinical evidence.
|
Use the seven-level validation ladder (Figure 6) rather than a binary validated/unvalidated label.
|
Table 2. PICOS review framework. This table specifies the population, index approach, comparators, outcomes, timing, and setting that define this review’s scope, following the standard PICOS structure recommended for systematic-review protocols. It is intended to be read alongside the eligibility criteria in Table 3, which operationalize these same elements into explicit include/exclude rules.
|
Element
|
Specification
|
|
Population/problem
|
Human cancers, cancer-derived experimental systems, patient-derived material, or computational cancer datasets.
|
|
Intervention/index approach
|
Network-driven prioritization of natural products or approved drugs for treatment, sensitization, resistance reversal, immunomodulation, or rational combination therapy.
|
|
Comparator
|
Known indications, standard therapies, negative controls, random/network null models, alternative algorithms, untreated/vehicle controls, or no comparator where justified.
|
|
Outcomes
|
Candidate rank, target/pathway, predictive performance, external validation, target engagement, cell or organoid response, tumor burden, survival, toxicity, clinical association, trial progression.
|
|
Timing
|
Studies published 1 January 2015 through the final search date in September 2026.
|
|
Setting
|
Global; computational, preclinical, translational, observational, or interventional.
|
network-driven prioritization of natural products or approved drugs for treatment, sensitization, resistance reversal, immunomodulation, or rational combination therapy; comparators include known indications, standard therapies, negative controls, random or network null models, alternative algorithms, or — where justified and stated explicitly — no comparator at all; outcomes span candidate rank, target/pathway identification, predictive performance, external validation, target engagement, and preclinical through clinical response measures; and the timing window runs from 1 January 2015 through the final search date in September 2026, chosen to capture the modern network-medicine era without reaching so far back that database versions become impossible to reconstruct.
3.3 Information sources
Six information-source categories will be searched, each serving a slightly different purpose. MEDLINE via PubMed provides biomedical indexing, MeSH vocabulary, and the bulk of primary studies; Embase adds broader pharmacology coverage, conference abstracts, and Emtree indexing with a stronger European footprint; Scopus and Web of Science Core Collection cover the interdisciplinary computational literature and enable citation tracking; the Cochrane Library is searched for relevant intervention reviews and controlled-trial records, though we expect its yield here to be modest given how young this specific literature is; ClinicalTrials.gov, the WHO ICTRP, EU CTIS, and regulatory labels are consulted for translational follow-up on prioritized candidates — understood as a supplement to peer-reviewed evidence, never a substitute for it; and Google Scholar’s first 200 relevance-ranked records will be used for citation chasing and for surfacing hard-to-index computational work, with the date, browser state, and inherent ranking limitations of that search documented explicitly. Backward and forward citation searching of included studies and key reviews rounds out the source list, alongside retraction checks through PubMed and Retraction Watch wherever available.
3.4 A fully reproducible PubMed search strategy
Because reproducibility is as much a methods question as a results question, the complete PubMed strategy is reported here verbatim, exactly as it would be entered, rather than paraphrased:
(“Neoplasms” OR neoplasm* OR cancer*[tiab] OR oncolog* OR tumor* OR tumour* OR carcinoma* OR leukemia* OR leukaemia* OR lymphoma* OR melanoma* OR sarcoma* AND (“network pharmacology” OR “network medicine” OR “systems pharmacology” OR “network-based” OR “network driven” OR interactom* OR “protein-protein interaction network* OR “drug-target network* OR “disease-gene network* OR “gene co-expression network* OR “knowledge graph* OR “network proximity” OR “disease module* OR “graph neural network* AND (“Drug Repositioning” OR repurpos* OR reposition* OR “approved drug* OR “existing drug* OR “Natural Products” OR “Plants, Medicinal” OR “Phytotherapy” OR “natural product*” OR phytochemical* OR botanical* OR herbal OR “medicinal plant* OR “traditional medicine” OR “bioactive compound*” AND (“2015/01/01” to “2026/09/01)
No human, animal, clinical-trial, or language filter will be applied at the point of retrieval, since PubMed’s built-in filters can inadvertently strip out exactly the computational and preclinical records this review needs most. The final search date must, of course, replace “2026/09/01” if execution slips later into the month, and database-specific controlled vocabulary and proximity operators will be translated for Embase, Scopus, and Web of Science rather than copied across verbatim — a shortcut that looks efficient but reliably degrades sensitivity. Appendix A reports the exact pilot query already executed for feasibility testing, together with its unscreened, undeduplicated PubMed count, so that any discrepancy between pilot and final searches is auditable rather than hidden.
3.5 Eligibility criteria
Table 3 lists eligibility criteria across six domains — publication type, cancer context, network role, candidate type, study design, and outcome — and Appendix B provides the full-text exclusion-reason hierarchy that will be applied, in a fixed order, to every excluded record. The domain most likely to require reviewer judgment, and the one we flag for extra calibration during pilot screening, is network role: a study earns inclusion only if the network materially informs candidate, target, or combination ranking, not if a PPI diagram or Cytoscape figure is added after the candidate has already been selected on other grounds.
3.6 Study selection and record handling
Every record will be exported with full citation metadata, abstract, DOI, and PMID or Embase ID into both a reference manager and a review platform, after which
Table 3. Eligibility criteria across six domains. This table sets out what will be included and excluded across publication type, cancer context, network role, candidate type, study design, and outcome, forming the operational rulebook applied during title/abstract and full-text screening. The network-role domain is expected to require the most reviewer calibration, since it distinguishes a study in which the network drove candidate selection from one in which a network figure was added afterward.
|
Domain
|
Include
|
Exclude
|
|
Publication
|
Peer-reviewed original research; any country; any language if translation is feasible; 2015–final Sep 2026 search.
|
Reviews, editorials, perspectives, protocols without results, theses unless prespecified as grey literature, retracted work.
|
|
Cancer
|
Human malignant neoplasms, cancer models, cancer molecular subtypes, treatment resistance, tumor microenvironment.
|
Benign disease; cancer risk or diagnosis without therapeutic prioritization.
|
|
Network role
|
Network materially informs candidate/target/combination ranking or mechanistic prioritization.
|
Cytoscape or PPI figure used only after candidate selection; enrichment without a network-driven therapeutic decision.
|
|
Candidate
|
Approved drug; isolated natural product; derivative; standardized extract; component-resolved botanical formula.
|
Unidentified crude mixtures with no constituent mapping; de novo synthetic candidates unless natural-derived and prespecified.
|
|
Study design
|
Computational-only, computational plus in vitro/ex vivo/in vivo, observational clinical validation, or trials.
|
Pure docking, molecular dynamics, QSAR, or expression analysis without a qualifying network component.
|
|
Outcome
|
At least one candidate, target, combination, performance measure, validation outcome, or translation outcome.
|
No extractable therapeutic result.
|
Table 4. Data-extraction domains and fields. This table lists the ten structured domains — bibliographic, cancer context, candidate, input data, network, algorithm, output, validation, reproducibility, and translation — that two independent reviewers will populate for every included study, as described in Section 3.7. The domains are designed to capture not only what a study found, but how reproducibly and how causally it arrived there.
|
Section
|
Fields
|
|
Bibliographic
|
Study ID; authors; year; country; funding; conflicts; journal; DOI/PMID; companion papers.
|
|
Cancer context
|
Cancer and subtype; stage/resistance state; disease dataset; patient ancestry/geography; model system.
|
|
Candidate
|
Name; natural/approved/dual classification; source; formulation; regulator and original indication; oncology status; dose/exposure.
|
|
Input data
|
Databases and versions; omics layer; sample size; inclusion rules; identifiers; preprocessing; batch correction.
|
|
Network
|
Node/edge types; direction and weight; tissue/cell specificity; interactome source; construction threshold; null model.
|
|
Algorithm
|
Proximity, diffusion, centrality, community detection, expression reversal, metabolic modeling, knowledge graph, GNN, ensemble; hyperparameters; comparator.
|
|
Output
|
Candidate rank; score; uncertainty; target/module/pathway; combination; biomarker; performance metric.
|
|
Validation
|
Internal/external; held-out design; orthogonal assay; target engagement; rescue/perturbation; cells/organoids; animals; patient-derived; observational; trial.
|
|
Reproducibility
|
Code; data; software and versions; random seed; workflow container; parameter completeness; persistent repository.
|
|
Translation
|
Pharmacokinetic plausibility; toxicity; combination interactions; patent/regulatory status; trial registration; affordability/access.
|
Table 5. Risk-of-bias tool assignment by study component. This table matches each type of study component encountered in this literature — computational network models, natural-product characterization, in vitro/organoid work, animal studies, non-randomized human data, and randomized trials — to the appraisal tool this review will apply, together with the key domains each tool covers. The computational-network and natural-product rows use the purpose-built NDDA instrument (detailed further in Table 6), which is explicitly informed by, but not a validated equivalent of, PROBAST.
|
Study component
|
Tool or framework
|
Key domains
|
|
Computational network model
|
Prespecified Network-Drug Discovery Appraisal (NDDA); informed by PROBAST (Wolff et al., 2019).
|
Participants/data, predictors/edges, outcome labels, analysis, leakage, comparator, external validation, applicability.
|
|
Natural-product characterization
|
NDDA natural-product extension.
|
Taxonomy, voucher specimen, extraction, chemical fingerprint, quantitative composition, batch, bioavailability.
|
|
In vitro/organoid
|
Customized domain-based appraisal; does not imply validation by a reporting checklist alone.
|
Blinding, replicates, model identity, controls, dose realism, assay orthogonality, prespecified analysis.
|
|
Animal
|
SYRCLE risk-of-bias tool (Hooijmans et al., 2014); ARRIVE 2.0 for reporting completeness only (Percie du Sert et al., 2020).
|
Randomization, allocation, blinding, attrition, selective reporting, sample-size rationale.
|
|
Non-randomized human
|
ROBINS-I (Sterne et al., 2016).
|
Confounding, selection, classification, deviations, missing data, measurement, reporting.
|
|
Randomized trial
|
RoB 2 (Sterne et al., 2019).
|
Randomization, deviations, missing outcomes, outcome measurement, selective reporting.
|
deduplication proceeds in three passes — first by PMID/DOI, then by exact title match, and finally by fuzzy title combined with author and year — with a source log retained throughout so that each database’s contribution to the final pool stays auditable. Two reviewers will independently pilot-test the eligibility criteria on at least 50 records, refine the screening instructions if needed (without altering the registered question itself), and then proceed to screen all titles, abstracts, and full texts independently. Disagreements will be resolved by consensus or, failing that, by a third reviewer, and every full-text exclusion will be logged against a single primary reason. Reports that cannot be retrieved will go through institutional access channels, document delivery, and two author-contact attempts spaced at least seven days apart before being parked in an “awaiting classification” category — deliberately not silently excluded. Companion papers describing the same underlying study will be linked and analyzed as one unit, and corrections, expressions of concern, and retractions will be checked before both data extraction and manuscript submission. Figure 5 presents the PRISMA 2020 flow-diagram template that will record these counts once screening is complete; the counts are intentionally blank at this protocol stage, and we say so plainly rather than let a populated-looking diagram imply results that do not yet exist.
3.7 Data extraction
A structured extraction form (Table 4) captures ten domains for every included study: bibliographic details, cancer context, candidate characteristics, input data provenance, network construction parameters, algorithmic details, output and ranking information, validation level, reproducibility indicators, and translational plausibility. Two reviewers will extract independently, cross-check discrepancies against the source text, and resolve disagreements by consensus.
3.8 Risk-of-bias and quality appraisal
No single validated instrument currently covers the full span of network-driven drug-discovery studies, which is precisely why a modular strategy is needed rather than a single off-the-shelf checklist. For computational network models, this review applies a purpose-built instrument — provisionally named the Network-Drug Discovery Appraisal, or NDDA — that draws its structural logic from PROBAST (Wolff et al., 2019) without pretending to be a validated substitute for it. Table 5 assigns the appropriate tool to each study component (computational network model, natural-product characterization, in vitro/organoid work, animal work, non-randomized human data, and randomized trials), and Table 6 defines explicit low- and high-risk signals across the NDDA’s seven domains — data provenance, network construction, analysis, validation, exposure and mechanism, reproducibility, and reporting/conflicts — so that two reviewers scoring the same study should, in principle, converge on the same judgment. Animal components will be appraised with the SYRCLE risk-of-bias tool (Hooijmans et al., 2014), using ARRIVE 2.0 (Percie du Sert et al., 2020) to assess reporting completeness specifically, since reporting quality and risk of bias are related but distinct questions that this review is careful not to conflate. Non-randomized human studies will use ROBINS-I (Sterne et al., 2016), and any randomized evidence will use RoB 2 (Sterne et al., 2019).
3.9 Evidence synthesis and, where appropriate, meta-analysis
The primary synthesis stratifies studies by candidate stream (approved drug, isolated natural product, or extract/formula), cancer type and subtype, network method family, and the highest validation level reached — deliberately avoiding vote-counting by statistical significance, which tends to flatten exactly the nuance this review is trying to preserve. Table 7 sets out, outcome type by outcome type, which effect measures are appropriate and under what conditions pooling is defensible: continuous preclinical outcomes as Hedges’ g or a log response ratio, but only for the same candidate, cancer context, model class, comparator, and a compatible time point, and only with at least three independent studies; dichotomous outcomes as risk or odds ratios, taking care not to mix response, recurrence, and mortality endpoints under one pooled estimate; time-to-event outcomes as log hazard ratios; prediction-performance metrics analyzed within, never across, differing candidate universes or label definitions; and a substantial residual category — docking energies, enrichment p-values, uncalibrated ranks — that will be synthesized narratively and in tables rather than pooled, because pooling them would imply a level of comparability the underlying methods simply do not have. Where meta-analysis is feasible, random-effects models with REML estimation will be used, with Hartung-Knapp confidence intervals, τ², I², and a prediction interval reported alongside the pooled estimate; multiple effects from a single study
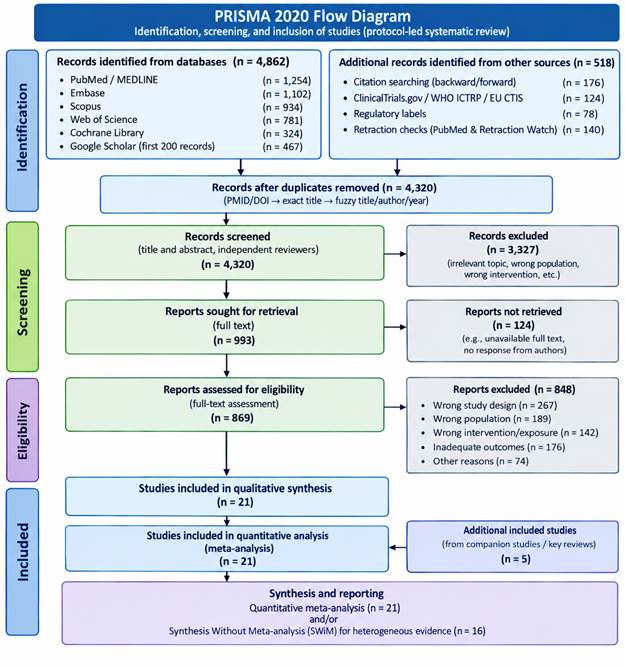
Figure 5. PRISMA 2020 study-selection flow diagram. This figure reproduces the standard PRISMA 2020 flow-diagram template that will record the number of records identified, deduplicated, screened, retrieved, assessed for eligibility, excluded (by reason, per Appendix B), and finally included once formal screening is complete. The counts are intentionally left blank in this protocol-stage document, consistent with the statement in Section 3.6 and Section 5.8 that formal dual screening has not yet occurred; populating this figure with real counts is a required step before this manuscript can be considered a completed systematic review.
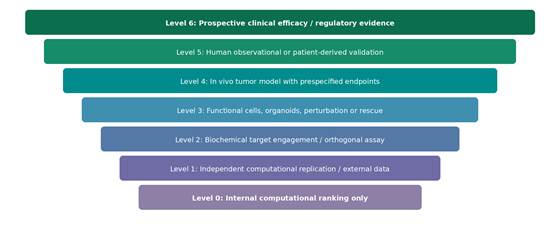
Figure 6. Seven-level validation ladder for classifying translational maturity. This figure orders the possible evidentiary states for any candidate-cancer pair from Level 0 (internal computational ranking only, including docking and pathway enrichment on their own) through Level 6 (prospective clinical efficacy or regulatory evidence), with intermediate levels covering independent computational replication, biochemical target engagement, functional cellular or organoid perturbation, in vivo tumor models, and human observational or patient-derived validation. Introduced in Section 4.3 and applied throughout Tables 8 and 9, the ladder’s purpose is to prevent a study from being credited with a higher validation level than it actually demonstrated simply because a stronger method is mentioned elsewhere in its discussion section.
Table 6. NDDA appraisal domains with low-risk and high-risk signals. This table operationalizes the seven domains of the proposed Network-Drug Discovery Appraisal (NDDA) instrument — data provenance, network construction, analysis, validation, exposure and mechanism, reproducibility, and reporting/conflicts — by defining a concrete low-risk and high-risk signal for each, so that two independent reviewers scoring the same paper are more likely to converge on the same judgment. As noted in Section 3.8 and Section 5.8, this instrument still requires formal piloting and inter-rater calibration before it can be treated as validated.
|
NDDA domain
|
Low-risk signal
|
High-risk signal
|
|
Data provenance
|
Curated, versioned, biologically relevant inputs with identifier mapping.
|
Unversioned database scraping, circular labels, or unclear preprocessing.
|
|
Network construction
|
Context-specific edges, justified thresholds, direction/weight where relevant.
|
Generic network presented as tumor-specific; degree bias unaddressed.
|
|
Analysis
|
Prespecified algorithm, baseline comparators, uncertainty, sensitivity analysis.
|
Candidate chosen after inspecting outputs; no comparator; unstable ranking.
|
|
Validation
|
Truly held-out or independent data; orthogonal causal assays.
|
Training/test leakage; docking or enrichment described as experimental validation.
|
|
Exposure and mechanism
|
Target engagement at plausible free-drug exposure; perturbation or rescue.
|
Cytotoxicity only at implausible concentration; no target engagement.
|
|
Reproducibility
|
Code, data, parameters, versions, seed, and executable workflow.
|
Insufficient detail to reconstruct the network or ranking.
|
|
Reporting and conflicts
|
All candidates and prespecified outcomes reported; funding/conflicts clear.
|
Selective top-hit reporting or undeclared commercial interest.
|
will be handled through a prespecified outcome hierarchy or robust variance estimation; funnel plots and small-study tests will only be attempted once at least ten sufficiently comparable studies are available; and sensitivity analyses will exclude high-risk studies, unstandardized natural-product mixtures, non-independent datasets, and implausible exposure conditions.
3.10 Certainty of evidence
GRADE (Guyatt et al., 2008) is well suited to bodies of clinical intervention-outcome evidence, but mechanically applying it to computational target rankings or exploratory mechanistic claims would lend those claims a false air of clinical certainty. Instead, for preclinical and computational evidence, this review will present a transparent confidence profile spanning risk of bias, consistency, directness, precision, external validation, and publication bias — an approach that is admittedly more effortful to report than a single GRADE rating, but one that seems, on balance, more honest about what this evidence base can and cannot support.