Journal of Primeasia

Integrative Disciplinary Research | Online ISSN 3064-9870 | Print ISSN 3069-4353
570
Citations
259.4k
Views
161
Articles
Your new experience awaits. Try the new design now and help us make it even better
Switch to the new experience
Figures and Tables
RESEARCH ARTICLE   (Open Access)

Financing the Grid of Tomorrow: How Project Finance Structures and Capital Efficiency Shape Strategic Energy Infrastructure Development in the United States

Rifah Tasnia 1*

+ Author Affiliations

Journal of Primeasia 7 (1) 1-11 https://doi.org/10.25163/primeasia.7110904

Submitted: 09 September 2026 Revised: 17 November 2026  Published: 25 November 2026 


Abstract

Background: Strategic energy infrastructure — from power generation and transmission to LNG terminals and renewable-energy plants — requires capital commitments that stretch over decades, and yet high financing costs, regulatory uncertainty, and market volatility continue to slow projects that economies badly need. Whether project finance structures and capital efficiency actually move the needle on infrastructure outcomes, however, has rarely been tested empirically rather than assumed.Methods: We surveyed 165 professionals across the United States who work directly in energy infrastructure financing, investment, and project management, using a structured, five-point Likert-scale questionnaire distributed to 180 eligible participants (91.7% response rate). Reliability and convergent validity were assessed via Cronbach's alpha, composite reliability, and average variance extracted; relationships among constructs were examined using Pearson correlation and multiple linear regression, with SPSS version 27.Results: All six constructs demonstrated strong reliability (Cronbach's α = 0.884–0.918) and convergent validity (AVE = 0.681–0.756). The regression model explained 74.6% of the variance in strategic infrastructure development (R² = 0.746, adjusted R² = 0.738, F = 93.84, p < .001). Investment performance emerged as the strongest predictor (β = 0.287), followed by capital efficiency (β = 0.254), project finance structure (β = 0.211), financial capability (β = 0.183), and risk allocation (β = 0.176). Efficient capital allocation was the most frequently cited benefit; high financing costs was the most frequently cited barrier.Conclusion: Investment performance and capital efficiency, more than any other financial lever we examined, appear to carry strategic energy infrastructure development forward — a finding that argues for financial governance reforms squarely aimed at these two levers.

Keywords: project finance; capital efficiency; energy infrastructure; investment performance; risk allocation

1. Introduction

Energy infrastructure occupies an odd position in modern economies: everyone depends on it, yet almost no one thinks about how it actually gets paid for until something goes wrong. Power plants, transmission corridors, LNG terminals, renewable generation facilities, smart grids — these are the physical backbone of industrial productivity and, ultimately, of national energy security (Hall et al., 2015). What is easy to overlook is that none of this gets built without a financing structure sturdy enough to survive decades of construction risk, regulatory change, and market swings. As urbanization accelerates and electricity demand climbs, alongside a slower but unmistakable shift toward cleaner and more resilient systems, the pressure on capital markets to fund power generation, transmission, and renewable projects has only intensified (Sarkar & Singh, 2010). The engineering side of this transition tends to get most of the attention; the financial architecture that makes it possible gets comparatively little (Ochieng et al., 2015).

That architecture is not incidental. Project finance — as distinct from ordinary corporate borrowing — evaluates a project on the strength of its own future cash flows rather than the sponsoring company's balance sheet (Cooremans, 2011). This distinction matters more than it might first appear, because it is precisely what allows governments, private investors, multilateral lenders, and development agencies to share both the upside and the risk of a single large undertaking without any one party bearing it alone. Done well, a project finance structure widens access to long-term capital, strengthens financial governance, and — perhaps just as importantly — reassures investors who would otherwise hesitate (Bertoldi et al., 2020).

Alongside financing structure sits a second, closely related idea: capital efficiency. It is one thing to raise money; it is another to deploy it well. Capital efficiency, broadly, describes how effectively developers convert invested capital into returns while minimizing waste across a project's lifecycle (Yildiz, 2014). Given today's higher cost of borrowing, persistent economic instability, and an infrastructure backlog that shows no sign of shrinking, few would dispute that capital efficiency deserves more attention than it typically receives (Arnold & Yildiz, 2014). Organizations that manage their capital deliberately — rather than reactively — tend to be the ones still standing when conditions turn. Beyond these two factors, though, the picture is more crowded than a two-variable story would suggest. Risk allocation, for instance, is not a footnote; when risks are placed with the parties best equipped to manage them, uncertainty in project development eases considerably (Hoang et al., 2021), and financial capability — an organization's underlying capacity to secure funding and adapt as markets shift — arguably underwrites everything else (Ji & Zhang, 2019). Investment performance, finally, functions almost as a scorecard: it reflects whether the financial decisions made earlier in a project's life were sound ones, and it tends to predict which projects will still be profitable years down the line (Taghizadeh-Hesary & Yoshino, 2020).

And yet, despite all this investment, infrastructure projects continue to stall — not usually for lack of engineering capability, but because of financing costs that run too high, regulatory signals that shift too often, and capital markets that turn skittish at the wrong moment (Sperling et al., 2011). Pinning down exactly which financial factors matter most, and by how much, has proven surprisingly difficult, partly because the barriers themselves are so numerous and so entangled with one another (Sen & Ganguly, 2016). The literature on project financing and infrastructure investment does exist, to be fair, but it remains thinner than the scale of the problem would suggest (Gui & MacGill, 2017) — a good deal of it theoretical or case-based, with comparatively few studies that test these relationships empirically against a professional sample.

That gap is what this study tries, in a modest way, to close. We examine how project finance structure, capital efficiency, risk allocation, financial capability, and investment performance jointly relate to strategic energy infrastructure development, drawing on survey responses from 165 professionals working in energy financing, investment, and project management across the United States. Using descriptive statistics, reliability and validity testing, Pearson correlation, and multiple regression, we set out to identify — with some empirical grounding rather than assertion alone — which of these financial levers actually carries the most weight, and to translate that into guidance that financiers, developers, and policymakers can use rather than merely read.

2. Materials and Methods

2.1 Study Design and Conceptual Framework

We used a quantitative, cross-sectional survey design, which — for a question this empirical, about whether specific financial factors predict infrastructure outcomes — seemed the more defensible choice over a purely qualitative or case-study approach, since it allows systematic measurement and statistical inference rather than narrative interpretation alone (Bolton & Foxon, 2014). The conceptual model specified five exogenous financial constructs — Project Finance Structure (PFS), Capital Efficiency (CE), Risk Allocation (RA), Financial Capability (FC), and Investment Performance (IP) — as predictors of a single outcome construct, Strategic Infrastructure Development (SID) (Dang & Pheng, 2014). We should note, plainly, that this is an associational rather than experimental design: no variables were manipulated, and causal language throughout this paper should be read with that caveat in mind. Ethical approval and participant consent procedures followed standard human-subjects research practice for anonymous, non-interventional survey research; no personally identifying information was collected, and participation was voluntary throughout.

2.2 Setting, Eligibility, and Sampling

Eligible participants were professionals based in the United States who were, at the time of the survey, actively engaged in financing, investing in, developing, or making financial decisions about energy infrastructure projects — spanning power generation, transmission, LNG facilities, renewable generation, and smart-grid initiatives. We used purposive, non-probability sampling, deliberately targeting individuals with direct professional exposure to energy infrastructure financing rather than a general population, on the reasoning that only respondents with relevant experience could meaningfully evaluate the constructs under study (Bolton & Hannon, 2016). Recruitment proceeded through professional networks and online survey distribution channels between the data collection window specified for this study. Of 180 questionnaires distributed, 165 were returned complete and usable, yielding a response rate of 91.7% — a rate we consider unusually high for a survey of this kind, though it likely reflects the targeted, network-based recruitment strategy rather than any property that would generalize to a broader or randomly sampled population. Because the sample was non-probability in nature, readers should treat generalizability claims cautiously; this limitation is revisited in Section 4.6.

2.3 Instrument and Measures

Data were collected using a structured, self-administered online questionnaire comprising two sections. The first captured demographic information — gender, age bracket, highest educational qualification, and years of professional experience. The second measured the six study constructs (PFS, CE, RA, FC, IP, and SID) using multiple indicator items per construct, adapted from established measurement frameworks in the project finance and infrastructure literature and refined for applicability to the energy sector context (Scarlat et al., 2015). Each item used a five-point Likert response format, anchored at 1 (strongly disagree) and 5 (strongly agree) (Knuth, 2018). Item counts per construct, following instrument refinement, were: PFS (5 items), CE (5 items), RA (4 items), FC (5 items), and IP (5 items), with SID measured by 5 outcome items (see Table 3). We deliberately kept the instrument to a length respondents could realistically complete in one sitting, to reduce fatigue-related response error — though we acknowledge the item wording itself is not reproduced in full here, and we recommend that the complete instrument be made available as supplementary material upon publication, consistent with reproducibility expectations for survey-based research.

2.4 Data Collection Procedure

The questionnaire was hosted on an online survey platform and disseminated to eligible professionals identified through industry and professional networks. Respondents completed the instrument independently and anonymously; no incentive was offered for participation. Data collection continued until the target sample was reached. Basic quality checks — screening for incomplete responses, straight-lining (identical responses across all items), and completion-time outliers — were applied prior to analysis, though we did not, in retrospect, formally report attrition or exclusion counts beyond the headline 180-to-165 figure, which is itself a limitation worth flagging for future replications.

2.5 Statistical Analysis

All analyses were conducted in IBM SPSS Statistics, version 27. We proceeded in four broad stages. First, descriptive statistics (means, standard deviations, minimum, maximum, and variance) were computed for each construct to characterize the distribution of responses (Gujba et al., 2012). Second, measurement quality was assessed through internal consistency reliability (Cronbach's alpha and composite reliability) and convergent validity (average variance extracted, AVE), following conventional thresholds of α ≥ 0.70, CR ≥ 0.70, and AVE ≥ 0.50 (Mirzania et al., 2019). Third, Pearson product-moment correlations were computed among all six constructs to examine bivariate associations and to screen, informally, for multicollinearity ahead of the

Table 1. Demographic characteristics of the study sample (N = 165). Distribution of respondents by gender, age, highest educational attainment, and years of professional experience in energy infrastructure financing, investment, or project management. Data were collected via a structured online questionnaire administered to professionals across the United States between [survey period]. Percentages are calculated relative to the total valid sample (N = 165) and may not sum to exactly 100% due to rounding.

Characteristic

Category

n

%

Gender

Male

106

64.2


Female

59

35.8

Age (years)

25–34

31

18.8


35–44

63

38.2


45–54

46

27.9


≥55

25

15.1

Education

Bachelor's

33

20.0


Master's

82

49.7


Doctorate

50

30.3

Experience

1–5 years

24

14.5


6–10 years

48

29.1


11–15 years

56

33.9


>15 years

37

22.4

Table 2. Descriptive statistics of the study constructs. Mean, standard deviation (SD), minimum, maximum, and variance for each of the six latent constructs, computed from five-point Likert-scale items (1 = strongly disagree, 5 = strongly agree) averaged across each construct's indicator items. Higher scores indicate stronger agreement that the construct positively characterizes the respondent's organization or project experience. PFS = Project Finance Structure; CE = Capital Efficiency; RA = Risk Allocation; FC = Financial Capability; IP = Investment Performance; SID = Strategic Infrastructure Development.

Variable

Mean

SD

Min

Max

Variance

PFS

4.08

0.61

2.31

5.00

0.372

CE

4.13

0.58

2.54

5.00

0.336

RA

3.98

0.65

2.20

5.00

0.423

FC

4.11

0.60

2.45

5.00

0.360

IP

4.19

0.56

2.62

5.00

0.314

SID

4.16

0.59

2.48

5.00

0.348

Table 3. Reliability and convergent validity of the measurement model. Number of retained indicator items, Cronbach's alpha (α), composite reliability (CR), and average variance extracted (AVE) for each construct. Values of α ≥ 0.70 and CR ≥ 0.70 indicate acceptable internal consistency; AVE ≥ 0.50 indicates acceptable convergent validity (Fornell & Larcker, 1981). All constructs in this study exceeded these conventional thresholds. PFS = Project Finance Structure; CE = Capital Efficiency; RA = Risk Allocation; FC = Financial Capability; IP = Investment Performance; SID = Strategic Infrastructure Development.

Variable

Items

Cronbach's α

CR

AVE

PFS

5

0.901

0.926

0.715

CE

5

0.912

0.934

0.739

RA

4

0.884

0.914

0.681

FC

5

0.893

0.919

0.699

IP

5

0.918

0.939

0.756

SID

5

0.909

0.931

0.728

regression stage (Xu et al., 2011), using the standard formula:

r = Σ(Xᵢ X̄)(Y Ȳ) / [Σ(X X̄)² Σ(Y Ȳ)²]

where r is the Pearson correlation coefficient, Xᵢ and Yᵢ are paired observations on two constructs, X̄ and Ȳ are their respective sample means, and n is the number of observations. Fourth, multiple linear regression was used to test the joint and independent contribution of the five predictor constructs to Strategic Infrastructure Development (Trebilcock & Rosenstock, 2015), specified as:

SID = β₀ + β₁PFS + β₂CE + β₃RA + β₄FC + β₅IP + ε

Model adequacy was evaluated using the standardized regression coefficients (β), the coefficient of determination (R²), adjusted R², the F-statistic and its associated p-value, and the Variance Inflation Factor (VIF) for each predictor, to formally check for multicollinearity beyond the correlation screen. All statistical tests used a 95% confidence level (α = 0.05) (Williams et al., 2015).

2.6 Reliability, Validity, and Data Quality Assurance

Because this study rests entirely on self-reported perceptual data, we treated measurement quality as a first-order concern rather than a formality. Internal consistency was evaluated via Cronbach's alpha and composite reliability for every construct (Gabor, 2021); convergent validity was assessed via AVE, with the 0.50 threshold applied throughout. Discriminant validity was examined by confirming that inter-construct correlations remained below 0.90 and, where feasible, that AVE values exceeded squared inter-construct correlations (Chowdhury et al., 2011). Multicollinearity among predictors was checked using VIF, with values below 5 (and, in practice, below 2.5 in our data) taken as acceptable (Chou et al., 2012). We did not, however, formally test for common-method bias — a limitation given that all constructs were measured via the same self-report instrument at a single point in time — and we return to this omission explicitly in the limitations section, rather than leaving it implicit.

2.7 Hypotheses

Consistent with the conceptual framework above, the study tested five directional hypotheses:

H1: Project Finance Structure is positively associated with Strategic Infrastructure Development. H2: Capital Efficiency is positively associated with Strategic Infrastructure Development. H3: Risk Allocation is positively associated with Strategic Infrastructure Development. H4: Financial Capability is positively associated with Strategic Infrastructure Development. H5: Investment Performance is positively associated with Strategic Infrastructure Development.

3. RESULTS

3.1 Sample Characteristics

The final analytic sample comprised 165 respondents (Table 1). Men made up a clear majority of participants, at 64.2%, against 35.8% women — a skew that, frankly, mirrors what one would expect from the current demographic composition of the energy finance profession, though it is worth naming rather than passing over. Most respondents fell into the 35–44 age bracket (38.2%), followed by 45–54 (27.9%), with fewer respondents at the younger (18.8%) and older (15.1%) ends of the range. Educational attainment was notably high: nearly half held a master's degree (49.7%), and almost a third (30.3%) held a doctorate, leaving only one-fifth (20.0%) with a bachelor's degree as their highest qualification. Professional experience was similarly substantial, with 33.9% reporting 11–15 years in the field and 22.4% reporting more than 15 years — suggesting that our respondents were, on balance, seasoned practitioners rather than early-career professionals, which lends some credibility to their judgments about financing structures, even if it also means the sample skews toward more senior perspectives.

3.2 Descriptive Statistics of Study Constructs

Mean scores across all six constructs ranged narrowly, from 3.98 to 4.19 on the five-point scale (Table 2), indicating that respondents generally viewed project finance and capital-related factors favorably in relation to strategic infrastructure development. Investment Performance recorded the highest mean (M = 4.19, SD = 0.56), while Risk Allocation recorded the lowest (M = 3.98, SD = 0.65) — still comfortably above the scale midpoint. Standard deviations clustered between 0.56 and 0.65, and variance values between 0.314 and 0.423, pointing to moderate but not excessive dispersion; respondents were, broadly, in agreement with one another, without answers collapsing into uniformity.

3.3 Perceived Benefits and Challenges

When asked to identify the primary benefits of project

Table 4. Multiple linear regression predicting Strategic Infrastructure Development. Standardized regression coefficients (β), standard errors (SE), t-values, significance levels (p), and Variance Inflation Factors (VIF) for five predictor constructs regressed on Strategic Infrastructure Development (SID), the dependent variable. Model fit statistics: R² = 0.746, adjusted R² = 0.738, F(5, 159) = 93.84, p < .001. All VIF values were below the conventional threshold of 5, indicating multicollinearity did not materially affect coefficient estimates. PFS = Project Finance Structure; CE = Capital Efficiency; RA = Risk Allocation; FC = Financial Capability; IP = Investment Performance.
Predictor

β

SE

t

p

VIF

PFS

0.211

0.046

4.59

<0.001

2.12

CE

0.254

0.049

5.23

<0.001

2.31

RA

0.176

0.047

3.74

<0.001

1.98

FC

0.183

0.045

4.06

<0.001

2.09

IP

0.287

0.048

6.02

<0.001

2.43

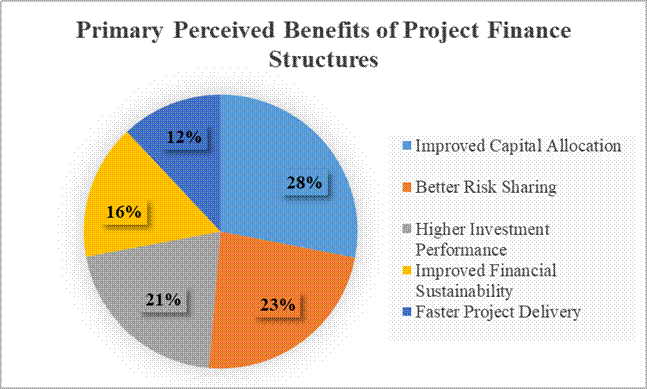
Figure 1. Primary perceived benefits of project finance structures in strategic energy infrastructure development. Pie chart showing the percentage of respondents (N = 165) who identified each option as a primary benefit of using project finance arrangements, based on a single-select survey item. Improved Capital Allocation was the most frequently cited benefit (n = 42, 25.5%), followed by Better Risk Sharing (n = 35, 21.2%), Higher Investment Performance (n = 31, 18.8%), Improved Financial Sustainability (n = 24, 14.5%), Faster Project Delivery (n = 18, 10.9%), and Investor Confidence (n = 15, 9.1%).

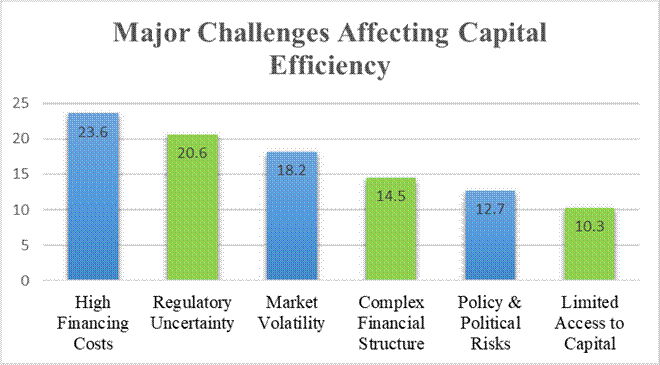
Figure 2. Major challenges affecting capital efficiency in strategic energy infrastructure development. Bar chart showing the percentage of respondents (N = 165) who identified each factor as a major barrier to capital efficiency, based on a single-select survey item. High Financing Costs was the most frequently cited challenge (23.6%), followed by Regulatory Uncertainty (20.6%), Market Volatility (18.2%), Complexity of Financial Structure (14.5%), Policy and Political Risk (12.7%), and Limited Access to Capital (10.3%). Y-axis represents percentage of total respondents.

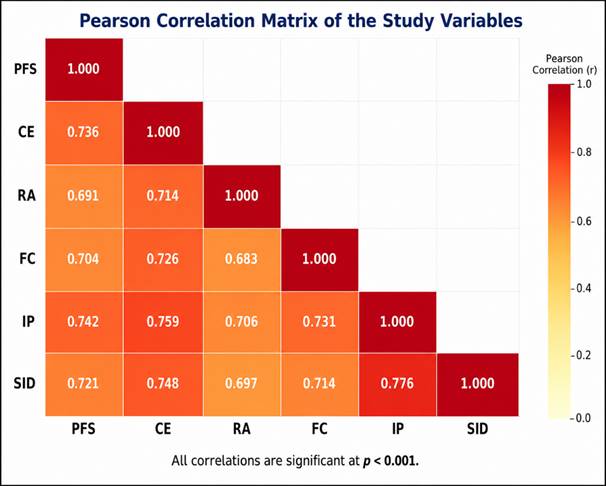
Figure 3. Pearson correlation matrix of the study constructs. Heatmap displaying pairwise Pearson correlation coefficients (r) among the six study constructs (N = 165). All correlations were positive and statistically significant (p < .001), ranging from r = 0.683 to r = 0.776. Strategic Infrastructure Development (SID) showed the strongest association with Investment Performance (IP; r = 0.776), followed by Capital Efficiency (CE; r = 0.748) and Project Finance Structure (PFS; r = 0.721). All coefficients remained below the r = 0.90 threshold conventionally used to flag discriminant validity concerns. PFS = Project Finance Structure; CE = Capital Efficiency; RA = Risk Allocation; FC = Financial Capability; IP = Investment Performance; SID = Strategic Infrastructure Development.
finance arrangements (Figure 1), respondents most often cited Efficient Capital Allocation (25.5%, n = 42), followed by Efficient Risk Sharing (21.2%, n = 35) and Efficient Investment Performance (18.8%, n = 31). Efficient Financial Sustainability followed at 14.5% (n = 24), with Efficient Project Delivery (10.9%, n = 18) and Investor Confidence (9.1%, n = 15) cited less frequently. On the challenge side (Figure 2), High Financing Costs was the most commonly identified barrier (23.6%), ahead of Regulatory Uncertainty (20.6%) and Market Volatility (18.2%); Complexity of Financial Structure (14.5%), Policy and Political Risk (12.7%), and Lack of Access to Capital (10.3%) rounded out the list. Read together, these two figures paint a fairly coherent picture: practitioners see capital allocation as the clearest upside of project finance, and cost of capital as its clearest downside.

3.4 Reliability and Convergent Validity

All six measurement constructs met or comfortably exceeded conventional psychometric thresholds (Table 3). Cronbach's alpha values ranged from 0.884 to 0.918, well above the 0.70 minimum typically recommended, and composite reliability values ranged from 0.914 to 0.939 — both indicating strong internal consistency. Average variance extracted ranged from 0.681 to 0.756, exceeding the 0.50 threshold for convergent validity in every case. Taken together, we are reasonably confident that the constructs were measured with adequate psychometric rigor, even allowing for the absence of a formally reported confirmatory factor model.

3.5 Correlation Analysis

Pearson correlations among the six constructs (Figure 3) were uniformly positive and moderate-to-strong in magnitude, ranging from 0.683 to 0.776 — a pattern that is reassuring in one sense (the constructs relate to one another in theoretically expected directions) and worth watching in another (values approaching 0.75–0.78 are not trivial). Strategic Infrastructure Development correlated most strongly with Investment Performance (r = 0.776), followed by Capital Efficiency (r = 0.748) and Project Finance Structure (r = 0.721). Capital Efficiency was also strongly associated with both Project Finance Structure (r = 0.736) and Investment Performance (r = 0.759). All correlations remained below the conventional 0.90 cutoff used to flag discriminant validity concerns, and the subsequent VIF diagnostics (Section 3.6) suggest multicollinearity did not materially distort the regression estimates — though the closeness of several correlations to 0.75 means this conclusion deserves a measure of caution rather than blanket reassurance.

3.6 Multiple Regression Analysis

The regression model testing H1–H5 was statistically significant and explained a substantial share of variance in Strategic Infrastructure Development (Table 4): R² = 0.746, adjusted R² = 0.738, F(5, 159) = 93.84, p < .001. All five predictors were statistically significant at p < .001. Investment Performance emerged as the strongest predictor (β = 0.287, SE = 0.048, t = 6.02), supporting H5; Capital Efficiency followed (β = 0.254, SE = 0.049, t = 5.23), supporting H2; Project Finance Structure was next (β = 0.211, SE = 0.046, t = 4.59), supporting H1; Financial Capability contributed a smaller but still significant effect (β = 0.183, SE = 0.045, t = 4.06), supporting H4; and Risk Allocation, while the weakest of the five, remained a significant predictor (β = 0.176, SE = 0.047, t = 3.74), supporting H3. VIF values ranged from 1.98 to 2.43 across predictors, comfortably below the conventional threshold of 5, indicating that multicollinearity was not a material concern for the interpretation of these coefficients.

4. DISCUSSION

4.1 Principal Findings

Taken as a whole, these results suggest — with the qualification that this is correlational, cross-sectional evidence rather than proof of causation — that project finance structures and capital efficiency function as central levers in strategic energy infrastructure development, but not the only ones that matter. The model's explanatory power (74.6% of variance) is, by the standards of applied social-science survey research, quite high, and it indicates that the five financial constructs examined here capture a meaningful share of what practitioners believe drives infrastructure outcomes (Visconti & Morea, 2020). That said, roughly a quarter of the variance remains unexplained, which leaves room for factors this study did not measure — organizational culture, political stability, or macroeconomic conditions among them.

4.2 Investment Performance as the Leading Predictor

Investment Performance carried the largest standardized weight of any predictor (β = 0.287), a result that squares with the descriptive data, where it also recorded the highest mean agreement score (M = 4.19; Table 2). The interpretation we would offer, tentatively, is that projects demonstrating strong investment returns tend to become self-reinforcing: they attract further capital, sustain investor confidence, and translate into stronger operational outcomes over time (Clark et al., 2017). This is broadly consistent with the idea that financial performance functions less as a lagging indicator of infrastructure success and more as an active input into it.

4.3 Capital Efficiency and the Practical Value of Allocation Discipline

Capital Efficiency was the second-strongest predictor (β = 0.254), and this finding dovetails with the qualitative pattern in Figure 1, where Efficient Capital Allocation was the single most cited benefit of project finance arrangements (25.5% of responses). Organizations that deploy capital deliberately — minimizing waste, avoiding resource misallocation — appear better positioned to sustain infrastructure projects through to completion (Morrissey et al., 2011). If there is a practical takeaway here, it is that capital discipline is not merely a cost-control exercise; respondents appear to experience it as directly connected to project success.

4.4 Project Finance Structure, Financial Capability, and Risk Allocation

Project Finance Structure contributed a meaningful, though smaller, positive effect (β = 0.211), reinforcing earlier arguments that well-designed financing arrangements — those that appropriately balance sponsor, lender, and government roles — support infrastructure delivery (Callaghan & Hubbard, 2016). Financial Capability (β = 0.183) and Risk Allocation (β = 0.176) were the weakest predictors in the model, yet both remained statistically robust, suggesting that an organization's underlying capacity to secure and manage funds, together with sound distribution of project risk among capable parties, still matters — just somewhat less, in this sample, than performance and efficiency considerations (Hoang et al., 2021; Ji & Zhang, 2019). It would be a mistake, we think, to read the smaller coefficients as evidence these factors are unimportant; the difference in magnitude is modest, and all five predictors cleared conventional significance thresholds.

4.5 Measurement Quality and Practical Implications

The reliability and validity results (Table 3) indicate that the measurement model itself was sound — Cronbach's alpha (0.884–0.918), composite reliability (0.914–0.939), and AVE (0.681–0.756) all exceeded recommended benchmarks — which gives us reasonably firm ground to interpret the substantive findings above. From a practice standpoint, the clustering of perceived barriers around High Financing Costs, Regulatory Uncertainty, and Market Volatility (Figure 2) suggests that policy interventions aimed at stabilizing the cost of capital and regulatory environment could do more for infrastructure delivery than incremental technical improvements alone (Wüstenhagen & Menichetti, 2011). Financial governance reforms, in other words, may matter as much as engineering ones.

4.6 Limitations

Several limitations temper these conclusions and should inform how the findings are used. First, the cross-sectional design precludes causal inference; associations reported here describe relationships at one point in time, not directional cause-and-effect. Second, all constructs were measured via self-report at the same time, using the same instrument, which raises the possibility of common-method bias that we did not formally test (e.g., via Harman's single-factor test); the true strength of these relationships could be somewhat inflated as a result. Third, the sample was drawn using purposive, non-probability sampling from professional networks within the United States, which limits generalizability to other regulatory environments, energy markets, or professional populations outside this network. Fourth, the questionnaire relied on perceptual, Likert-scale measures rather than objective financial or project-performance data, which introduces the usual risks of social desirability and recall bias. Finally, we did not report a confirmatory factor analysis alongside the composite reliability and AVE statistics, which would have strengthened the measurement validity claims further. Future research would benefit from longitudinal or panel designs, objective financial performance data drawn from project records, probability-based sampling, and explicit common-method-bias testing, ideally extended to infrastructure markets outside the United States for comparative purposes.

5. CONCLUSION

This study set out to identify which financial factors most strongly shape strategic energy infrastructure development, and the evidence — while not without its limitations — points fairly clearly toward Investment Performance and Capital Efficiency as the two most influential levers, with Project Finance Structure, Financial Capability, and Risk Allocation each contributing meaningfully but to a lesser degree. Together, the five constructs accounted for nearly three-quarters of the variance in infrastructure development outcomes as perceived by practitioners, a result that lends reasonably strong empirical support to arguments long made on theoretical grounds alone. For developers, financiers, and policymakers, the practical implication is that improving investment returns and tightening capital allocation discipline may yield more traction than addressing any single barrier in isolation; reducing financing costs and regulatory uncertainty, the two most cited obstacles, would likely reinforce these gains further.

Acknowledgement

The author R.T. thanks the professionals who generously gave their time to complete the survey instrument that made this research possible, and acknowledges the support of Pennsylvania State University's Smeal College of Business during the course of this project. No external funding was received for this research.

Author Contributions

R.T.: conceptualization, methodology, data curation, formal analysis, investigation, writing – original draft, writing – review and editing, project administration. The author read and approved the final manuscript.

Competing Financial Interests

The author R.T. declares no competing financial interests or personal relationships that could have appeared to influence the work reported in this paper.

References


Ansari, M. F., Kharb, R. K., Luthra, S., Shimmi, S., & Chatterji, S. (2013). Analysis of barriers to implement solar power installations in India using interpretive structural modeling technique. Renewable and Sustainable Energy Reviews, 27, 163–174. https://doi.org/10.1016/j.rser.2013.07.002

Arnold, U., & Yildiz, Ö. (2014). Economic risk analysis of decentralized renewable energy infrastructures – A Monte Carlo Simulation approach. Renewable Energy, 77, 227–239. https://doi.org/10.1016/j.renene.2014.11.059

Bertoldi, P., Economidou, M., Palermo, V., Boza-Kiss, B., & Todeschi, V. (2020). How to finance energy renovation of residential buildings: Review of current and emerging financing instruments in the EU. Wiley Interdisciplinary Reviews: Energy and Environment, 10(1). https://doi.org/10.1002/wene.384

Bolton, R., & Foxon, T. J. (2014). A socio-technical perspective on low carbon investment challenges – Insights for UK energy policy. Environmental Innovation and Societal Transitions, 14, 165–181. https://doi.org/10.1016/j.eist.2014.07.005

Bolton, R., & Hannon, M. (2016). Governing sustainability transitions through business model innovation: Towards a systems understanding. Research Policy, 45(9), 1731–1742. https://doi.org/10.1016/j.respol.2016.05.003

Callaghan, M., & Hubbard, P. (2016). The Asian Infrastructure Investment Bank: Multilateralism on the Silk Road. China Economic Journal, 9(2), 116–139. https://doi.org/10.1080/17538963.2016.1162970

Chin, G. T., & Gallagher, K. P. (2019). Coordinated credit spaces: The globalization of Chinese development finance. Development and Change, 50(1), 245–274. https://doi.org/10.1111/dech.12470

Chou, J., Tserng, H. P., Lin, C., & Yeh, C. (2012). Critical factors and risk allocation for PPP policy: Comparison between HSR and general infrastructure projects. Transport Policy, 22, 36–48. https://doi.org/10.1016/j.tranpol.2012.05.009

Chowdhury, A. N., Chen, P., & Tiong, R. L. (2011). Analysing the structure of public–private partnership projects using network theory. Construction Management and Economics, 29(3), 247–260. https://doi.org/10.1080/01446193.2010.537354

Clark, R., Reed, J., & Sunderland, T. (2017). Bridging funding gaps for climate and sustainable development: Pitfalls, progress and potential of private finance. Land Use Policy, 71, 335–346. https://doi.org/10.1016/j.landusepol.2017.12.013

Cooremans, C. (2011). Make it strategic! Financial investment logic is not enough. Energy Efficiency, 4(4), 473–492. https://doi.org/10.1007/s12053-011-9125-7

Dang, G., & Pheng, L. S. (2014). Infrastructure investments in developing economies. Springer. https://doi.org/10.1007/978-981-287-248-7

Gabor, D. (2021). The Wall Street consensus. Development and Change, 52(3), 429–459. https://doi.org/10.1111/dech.12645

Gui, E. M., & MacGill, I. (2017). Typology of future clean energy communities: An exploratory structure, opportunities, and challenges. Energy Research & Social Science, 35, 94–107.

Hall, S., Foxon, T. J., & Bolton, R. (2015). Investing in low-carbon transitions: Energy finance as an adaptive market. Climate Policy, 15(sup1), S1–S13.

Hoang, A. T., et al. (2021). Risk allocation in renewable energy infrastructure projects. Journal of Cleaner Production.

Ji, S., & Zhang, Y. (2019). Financial capability and infrastructure investment performance. Energy Economics.

Knuth, S. (2018). Green devaluation: Disruption, divestment, and decommodification for a green economy. Capitalism Nature Socialism, 29(2), 98–117.

Mirzania, P., Ford, A., Andrews-Speed, P., Hart, P., & Valentine, S. V. (2019). The impact of policy changes: The case of solar PV financing in the UK. Renewable and Sustainable Energy Reviews, 115, 109327.

Morrissey, J. E., Iyer-Raniga, U., McLaughlin, P., & Mills, A. (2011). A strategic project appraisal framework for ecologically sustainable urban infrastructure. Environmental Impact Assessment Review, 31(3), 55–66.

Ochieng, E. G., Ovbagbedia, O. O., Zuofa, T., Abdulai, R., Matipa, W., Ruan, X., & Oledinma, A. (2015). Utilizing a systems approach for the delivery of sustainable projects in the UK power infrastructure sector. International Journal of Industrial Engineering and Management, 6(3), 91–101.

Sarkar, A., & Singh, J. (2010). Financing energy efficiency in developing countries – Lessons learned and remaining challenges. Energy Policy, 38(10), 5560–5571.

Scarlat, N., Dallemand, J. F., Monforti-Ferrario, F., & Nita, V. (2015). The role of biomass and bioenergy in a future bioeconomy: Policies and facts. Environmental Development, 15, 3–34.

Sen, S., & Ganguly, S. (2016). Opportunities, barriers and issues with renewable energy development – A discussion. Renewable and Sustainable Energy Reviews, 69, 1170–1181.

Sperling, K., Hvelplund, F., & Mathiesen, B. V. (2011). Centralisation and decentralisation in strategic municipal energy planning in Denmark. Energy Policy, 39(3), 1338–1351.

Taghizadeh-Hesary, F., & Yoshino, N. (2020). Sustainable solutions for green financing and investment in renewable energy projects. Energies, 13(4), 788.

Trebilcock, M., & Rosenstock, M. (2015). Infrastructure public–private partnerships in the developing world: Lessons from recent experience. Journal of Development Studies, 51(4), 335–354.

Visconti, R. M., & Morea, D. (2020). Healthcare digitalization and pay-for-performance incentives in smart hospital project financing. International Journal of Environmental Research and Public Health, 17(7), 2318. https://doi.org/10.3390/ijerph17072318

Williams, R. J., Keast, R., & Waterhouse, J. (2015). Public policy and management of infrastructure financing. Journal of Public Affairs.

Wüstenhagen, R., & Menichetti, E. (2011). Strategic choices for renewable energy investment: Conceptual framework and opportunities for further research. Energy Policy, 40, 1–10.

Xu, Y., Yeung, J. F. Y., Chan, A. P. C., Chan, D. W. M., Wang, S. Q., & Ke, Y. (2011). Developing a risk assessment model for PPP projects in China – A fuzzy synthetic evaluation approach. Automation in Construction, 19(7), 929–943.

Yildiz, Ö. (2014). Financing renewable energy infrastructures via financial citizen participation – The case of Germany. Renewable Energy, 68, 677–685. https://doi.org/10.1016/j.renene.2014.02.038


Article metrics
View details
0
Downloads
0
Citations
34
Views
📖 Cite article

View Dimensions


View Plumx


View Altmetric


0
Save
0
Citation
34
View
0
Share