Data Modeling

Mathematical and Computational Data Modeling | Online ISSN 3143-9217
2
Citations
14.5k
Views
48
Articles
Your new experience awaits. Try the new design now and help us make it even better
Switch to the new experience
Figures and Tables
RESEARCH ARTICLE   (Open Access)

Real-Time Driver Drowsiness Detection Using a Multi-Task Recurrent Convolutional Neural Network: A Facial-Landmark-Based Approach

Fahad Ahmed 1*, Shaid Hasan 2, Khandaker Ataur Rahman 2

+ Author Affiliations

Data Modeling 3 (1) 1-8 https://doi.org/10.25163/data.3110934

Submitted: 16 September 2022 Revised: 08 November 2022  Published: 19 November 2022 


Abstract

Background: Drowsy driving remains an underappreciated but persistent contributor to road traffic fatalities, and the sensor-heavy or vehicle-embedded systems currently available to counter it are largely confined to premium vehicles, leaving most drivers unprotected. Methods: We propose a behavior-based, camera-only framework that infers drowsiness from a sequence of facial video frames rather than from physiological or vehicle-motion sensors. Faces were localized with the Dlib library, and 68 facial landmarks were used to compute three interpretable indices — the eye aspect ratio (EAR), the mouth opening ratio (MOR), and a nose-length ratio (NLR) capturing head bending — together with a per-driver calibration phase and a temporal voting rule evaluated across a rolling window of frames. These features fed a compact multi-task convolutional neural network, trained with stochastic gradient descent (batch size 64, momentum 0.6, weight decay 0.0005), on 62,910 frames from the NTHU-DDD dataset. Results: Of two candidate architectures, the narrower network generalized better, achieving 98.96% validation and 98.49% test accuracy (98.72% overall), with a corresponding average accuracy of 92.81% across behavioral conditions. Applying calibrated EAR (<0.24) and MOR (>0.16) thresholds yielded a three-tier drowsiness classification (not tired, less tired, very tired) consistent with observed eye-closure and yawning patterns. Conclusion: A single, comparatively small multi-task network can approach the accuracy of heavier ensemble or physiological approaches while remaining light enough for real-time, in-vehicle or mobile deployment, suggesting a practical route toward drowsiness monitoring that does not depend on luxury-vehicle hardware.

Keywords: Driver drowsiness detection; Convolutional neural network; Facial landmark detection; Eye aspect ratio; Mouth opening ratio; Deep learning; Road safety.

1. Introduction

Road traffic injury is, by most accounts, one of the more preventable public health crises of our time, and yet it continues to claim an extraordinary number of lives every year worldwide. A meaningful share of that toll, it turns out, has less to do with mechanical failure or reckless overtaking than with something almost mundane: a driver's eyes closing for a moment too long. Drowsiness at the wheel does not announce itself the way a swerve or a horn blast does; it creeps in quietly, through micro-sleeps that last only a second or two but are more than enough time for a vehicle travelling at highway speed to drift out of its lane. Estimates from the National Sleep Foundation suggest that roughly one in five drivers has felt drowsy behind the wheel at some point, a figure that is easy to read past on a page but sobering once you consider how many of those moments could plausibly have ended badly.

The pattern is not unique to any one country, though its severity varies. In Bangladesh, for instance, the Road Safety Foundation's annual reporting has documented a troubling upward trend in road fatalities between 2020 and 2021, with more than six thousand deaths and several thousand additional injuries recorded in a single reporting year. Fatigue and the brief lapses in attention that come with it are frequently implicated in these figures, and the World Health Organization's broader statistics on traffic mortality make clear that this is not a problem confined to any single region — it is, rather uncomfortably, a near-universal one. Perhaps what is most striking is how ordinary the precipitating conditions usually are: a long commute, a late shift, a stretch of monotonous highway. Nothing dramatic. Just fatigue, unnoticed until it is too late.

Industry has not been blind to this. Several automakers have built drowsiness-warning features directly into their vehicles, and it is worth pausing on how differently each has approached the same underlying problem. Volvo's Driver Alert Control, for example, leans on a vehicle-mounted camera tied into the lane departure warning system, watching for the kind of wandering trajectory that often precedes a micro-sleep. Mercedes-Benz took a somewhat different route with its Attention Assist system, which builds a running profile of a driver's typical steering behavior early in a trip and then continuously checks whether later inputs still fit that pattern — a subtle but clever way of letting the car learn what "normal" looks like for the person actually driving it. Bosch, meanwhile, fuses signals from the steering wheel, vehicle speed, turn-signal activity, and a front-mounted lane-assist camera to arrive at its own drowsiness judgment. Each of these systems works reasonably well within its own vehicle, and yet none of them has become anything close to standard equipment. They tend to appear in higher trim levels or luxury models, which is a polite way of saying that the drivers who might benefit most — those without the newest, most expensive cars — are usually the ones without access to them.

That mismatch is, in a sense, the motivation for the present study. If a technology only reaches the drivers least likely to need it, its public-health value is inevitably limited. Two developments make it reasonable to expect something better. First, smartphones with reasonably capable cameras and, increasingly, dedicated neural processing hardware are now nearly ubiquitous, including on operating systems such as Android that dominate the global market. Second, deep learning has matured to the point where camera-based behavioral analysis — once computationally out of reach for anything resembling real-time use — is now genuinely feasible on modest hardware. Taken together, these two trends suggest that a drowsiness-detection system need not live inside a $60,000 sedan; it could, in principle, live inside the phone already mounted on a driver's dashboard.

Researchers have pursued this problem along three broad lines, and it is worth walking through them briefly because each has shaped the design choices made here. The first relies on driving-pattern signatures — steering-wheel micro-corrections, lateral lane position, and similar indirect cues. Krajewski et al. (2009) demonstrated that fatigue could be estimated from steering-wheel micro-adjustments with roughly 86% accuracy, which is respectable, though such approaches remain tethered to the particular vehicle, road geometry, and driving style involved, and do not transfer especially well across contexts. McDonald et al. (2018) refined this general strategy with a contextual, temporal algorithm that folds steering angle, vehicle speed, and accelerator position into a Bayesian network, reporting fewer false positives than PERCLOS-style eyelid-tracking methods and underscoring, somewhat counterintuitively, that the ten seconds of context preceding a given moment often matter more than the moment itself.

The second line turns to physiological signals — EEG, ECG, and related bio-signals — which tend to be the most sensitive of the three approaches, if also the least convenient. Mardi et al. (2011) reported accuracy exceeding 90% using EEG-derived chaotic features, a genuinely strong result, though it comes at the cost of attaching multiple electrodes to a driver's scalp, which is not something most people are prepared to tolerate on a daily commute. Bhardwaj et al. (2018) pursued a somewhat gentler variant using electrocardiogram-based heart-rate variability, noting that capacitive electrodes embedded in the seat or steering wheel can, in principle, capture usable ECG data with far less discomfort than scalp electrodes — an encouraging direction, even if the classification pipelines built on top of that data remain works in progress.

The third and, for present purposes, most relevant line is computer vision applied to facial behavior: gaze, expression, yawning, eye closure, and head movement. Dua et al. (2021) combined four convolutional networks — FlowImageNet, VGG-FaceNet, AlexNet, and a ResNet-based yawn-and-gesture detector — into an ensemble, achieving strong results by pooling behavioral, facial, and environmental cues rather than relying on any single signal. Ed-Doughmi et al. (2020) took a temporal approach instead, feeding a sequence of facial frames through a multilayered 3D convolutional recurrent network so that drowsiness could be inferred from how a face changes over time rather than from any one static image. Jabbar et al. (2018) proposed a more direct pipeline, extracting facial landmarks and passing them to a convolutional classifier tuned for microsleep detection, and evaluated it across a range of lighting conditions and with and without eyeglasses — a detail that matters more than it might first appear, since glasses and glare are exactly the sort of thing that trips up naive vision systems in practice. Jamshidi et al. (2021) went further still with a hierarchical architecture, using ResNet to first characterize the face, the lighting, and whether glasses were present, before handing the result to an LSTM that could exploit temporal dependencies between frames. And Hashemi et al. (2020) compared a purpose-built network against transfer-learning variants of VGG16 and VGG19, ultimately reporting that a fine-tuned VGG16 model reached 98.53% accuracy on eye-state classification — the strongest single figure among the vision-based studies reviewed here, though achieved with a comparatively heavy architecture.

What emerges from this body of work, taken as a whole, is a reasonably consistent trade-off: physiological methods tend to be accurate but intrusive; driving-pattern methods are convenient but shallow; and vision-based methods sit somewhere in between, offering non-intrusive monitoring at the cost of computational demands that can be difficult to reconcile with the tight latency and power budgets of an embedded or mobile deployment. Convolutional networks in particular have delivered excellent classification performance in this space, yet many of the architectures reported to date remain too large, or too dependent on multi-model ensembles, to run comfortably in real time on modest hardware.

It is this gap — between demonstrated accuracy and practical deployability — that the present study is aimed at. Rather than adding another accuracy point to an already crowded leaderboard, we set out to ask whether a single, moderately sized multi-task convolutional network, built around three interpretable behavioral indices (eye closure, yawning, and head bending) and trained on facial video alone, could approach the performance of heavier or sensor-dependent alternatives while remaining lightweight enough for real-world, camera-only use. The remainder of this paper is organized as follows: the Methods section describes, in enough detail to be reproduced, how facial landmarks were extracted and converted into drowsiness indices and how the classification network was trained; the Results section reports the resulting accuracies and compares them against the literature summarized above; the Discussion section considers what these results imply, where the approach falls short, and where it might reasonably go next; and the Conclusion closes with a brief summary of the study's contribution.
2. Methods

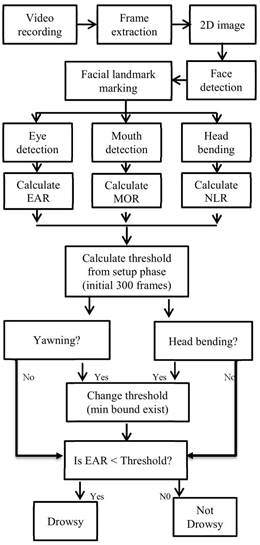
The overall approach is behavior-based: drowsiness is inferred entirely from visual information captured by a single camera, without recourse to physiological sensors or vehicle telemetry. The pipeline comprises four sequential stages — face detection, facial-landmark localization, feature extraction, and temporal classification — the first three of which operate on individual frames, while the fourth aggregates information across a sliding window of frames to arrive at a final drowsiness decision. Each stage is described below in sufficient operational detail that an independent group, given access to the same dataset, should be able to reproduce the pipeline end to end; where a parameter value was set empirically rather than derived analytically, that is noted explicitly. The overall architecture is illustrated in Figure 1.

2.1 Dataset and Study Population

All experiments were conducted on the publicly available National Tsing Hua University Driver Drowsiness Detection (NTHU-DDD) dataset (Computer Vision Lab, National Tsing Hua University, 2016), which we selected because it is, to our knowledge, one of the few corpora that pairs simulated-driving video with explicit drowsiness annotations across a reasonably diverse participant pool. The dataset comprises footage from 22 participants recorded under simulated driving conditions and is partitioned into separate training and testing subsets. Recordings capture a mixture of behaviors relevant to drowsiness — normal driving, yawning, slow blinking, laughing, and “dizzy dozing” — and were filmed at 640 × 480 pixel resolution, 30 frames per second, in AVI format.

Figure 1. Block diagram of the proposed real-time drowsiness detection pipeline. The system proceeds through four sequential stages — face detection, facial landmark localization, feature extraction (eye aspect ratio, mouth opening ratio, and head-bending index), and temporal classification — with the first three operating on single frames and the fourth aggregating evidence across a rolling window of frames to reach a final drowsy or non-drowsy decision.

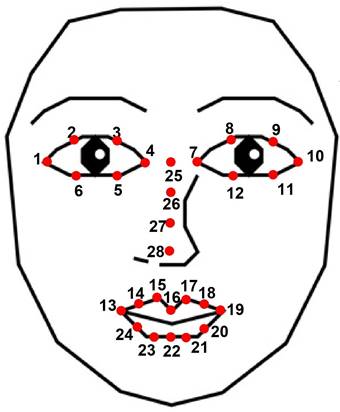
Figure 2. Example of facial landmark localization on a driver's face, with the 68 detected points overlaid in red. Landmarks trace the boundaries of the eyes, mouth, and nose and provide the geometric basis for computing the eye aspect ratio, mouth opening ratio, and nose-length ratio used throughout the classification pipeline.

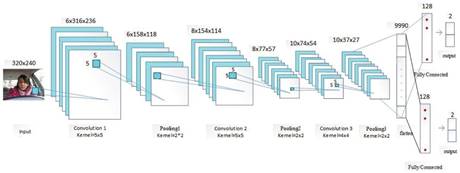
Figure 3. Architecture of the multi-task convolutional neural network used for simultaneous eye- and mouth-state classification. The network comprises three convolutional-pooling blocks followed by two fully connected layers, and was trained using stochastic gradient descent (batch size 64, momentum 0.6, weight decay 0.0005, initial learning rate 0.01) on frames resized to 320 × 240 pixels.

Test sequences were assembled by concatenating clips drawn from different driving scenarios so that the evaluation set reflects realistic transitions between alertness states rather than a single, static condition. For the multi-task classification experiments reported here, the dataset was partitioned into 41,600 training frames, 10,800 validation frames, and 10,910 test frames (62,910 frames in total; Table II).

2.2 Face Detection

Individual frames were extracted from each video and passed to a face-detection stage built on the Dlib library (implemented in C++), which we chose for its established reliability in locating facial regions under moderate pose and lighting variation. From the detected face region, 68 facial landmark points were subsequently used to compute the eye aspect ratio (EAR) and mouth opening ratio (MOR), which together anchor the eye- and mouth-region labeling described below. To keep the downstream temporal features numerically stable, drowsiness parameters were computed over a fixed-length rolling window of N frames: as each new frame entered the window, the oldest frame was discarded, so the effective observation horizon remained constant throughout a recording.

2.3 Facial Landmark Localization

Once a face was located, the next task was to pinpoint specific anatomical landmarks — the corners of the eyes and mouth and the tip of the nose — with enough precision to support ratio-based feature computation. Each face image was first resized to a width of 500 pixels and converted to grayscale to normalize resolution and reduce color-channel variability. Landmark positions were then estimated using an ensemble of regression trees trained to predict landmark coordinates from a sparse subset of pixel intensities, with the underlying sum-of-squared-error loss minimized via a gradient-boosting procedure. This step yields the boundary points of the eyes and mouth and the central axis of the nose; the specific allocation of landmark indices to each facial part is summarized in Table I, and an example of the resulting landmark configuration is shown in Figure 2, where detected points are overlaid in red.

2.4 Feature Extraction

Three interpretable indices were computed from the localized landmarks, each intended to capture a distinct behavioral marker of drowsiness.

Eye aspect ratio (EAR). Using the corner and lid landmark points of each eye, EAR was computed as the ratio of eye height to eye width. EAR is high when the eyes are fully open and falls toward zero as the eyelids close, so a sustained or repeated drop in EAR is a reasonably direct proxy for blinking behavior and, by extension, for drowsiness — the logic being that healthy, alert blinking is brief, whereas drowsy blinking tends to linger.

Mouth opening ratio (MOR). Computed analogously from mouth landmark points, MOR is intended to flag yawning: it rises sharply as the mouth opens, remains elevated for the duration of the yawn, and falls again as the mouth closes. Because yawning is one of the more visually unambiguous signs of fatigue, MOR was treated as a second, largely independent line of evidence.

Head-bending index (nose-length ratio, NLR). Drowsy drivers frequently tilt their heads forward or backward relative to a neutral, upright posture, and this tendency can be captured indirectly through the apparent (projected) length of the nose as seen by the camera: under normal, alert conditions the nose forms an acute angle relative to the camera's focal plane, and this projected length increases as the head tips upward and decreases as it tips downward. We therefore krdlsnb head bending as the ratio of the current projected nose length to the average nose length recorded while the driver was known to be awake (NLR), with values outside kks expected band taken as evidence of head bending consistent with drowsiness.

2.5 Threshold Calibration and Classification

Rather than applying a single fixed threshold to every driver — which would ignore substantial inter-individual variation in eye shape, resting posture, and baseline expressiveness — the system calibrates its thresholds per driver during a brief setup phase in which the driver is assumed to be fully alert. During this phase, EAR values were recorded across the first 200 frames (approximately 10 seconds at 30 fps), and the mean of the 150 largest values among these was taken as that driver's EAR threshold; using the upper tail of the distribution in this way was a deliberate choice, intended to reduce the risk that an incidental blink during calibration would be mistaken for the driver's baseline “eyes-open” state. The MOR threshold, by contrast, was set empirically from observed mouth-opening behavior in the calibration window, since a driver is unlikely to yawn to their full physical extent within the first few seconds of a recording. For the head-bending feature, NLR was expected to fall within roughly 0.9 to 1.1 for an upright head position, with departures from that band — in either direction — flagged as bending; the reference (average) nose length used in this ratio was likewise established during the assumed-awake calibration window.

Once thresholds were established, the system evaluated incoming test frames against three complementary decision rules operating in parallel. First, a frame was flagged for a given feature (EAR, MOR, or NLR) whenever that feature crossed its respective threshold; specifically, drowsiness was signaled when EAR fell below approximately 0.24 or when MOR exceeded approximately 0.16. Second, to avoid triggering an alarm on the basis of a single noisy frame, each frame's status was evaluated against a trailing window of the 75 most recent frames, and an alarm was raised only if at least 70 of those 75 frames satisfied the drowsiness condition for at least one feature — a fairly conservative temporal-voting rule that trades a small amount of latency for a meaningful reduction in false alarms. Third, an adaptive EAR threshold was maintained in parallel with the fixed one: computed initially from the 150 largest EAR values among the first 300 frames, this threshold was permitted to rise slightly (up to a bounded limit) after each detected yawning or head-bending event, on the reasoning that fatigue-related eye narrowing can itself shift a driver's effective baseline over the course of a long drive; repeated frames belonging to a single continuous yawn or bending event were counted only once toward this adjustment, to avoid over-correcting. In cases where the head was bent low enough that the face detector failed outright, the system fell back on checking the preceding three frames for evidence of head bending, and triggered the alarm if that evidence was present.

Beyond this landmark-and-threshold pipeline, drowsiness status was additionally cross-checked using four auxiliary convolutional models — FlowImageNet, AlexNet, VGG-FaceNet, and a ResNet-based yawn/gesture detector, following the ensemble strategy described by Dua et al. (2021) — whose outputs were combined with the primary classifier via majority voting to produce the final drowsy/non-drowsy decision for a given segment.

2.6 Network Architecture and Training

For the temporal classification stage, we implemented a compact multi-task convolutional neural network capable of classifying eye and mouth state simultaneously, following the general architectural philosophy described by Ed-Doughmi et al. (2020) for recurrent, frame-sequence-based drowsiness classification, but adapted here to a smaller footprint. The network was trained using stochastic gradient descent (SGD) with a batch size of 64, momentum of 0.6, weight decay of 0.0005, and an initial learning rate of 0.01 applied uniformly across all trainable layers; the multi-task architecture used in these experiments is illustrated in Figure 3.

Two candidate architectures were compared, differing only in filter width across the three convolutional layers. The wider variant used filter counts of 12, 15, and 20 across the three convolutional layers, with the structure Conv1(12,5,1) – Activation – Pool1(2×2) – Conv2(15,5,1) – Activation – Pool2(2×2) – Conv3(20,4,1) – Activation – Pool3 – FullyConnected1(512) – Activation – FullyConnected2(128). The narrower variant used filter counts of 6, 8, and 10, with the structure Conv1(6,5,1) – Activation – Pool1(2×2) – Conv2(8,5,1) – Activation – Pool2(2×2) – Conv3(10,4,1) – Activation – Pool3 – FullyConnected1(128). Both variants were trained under identical SGD settings; input images were resized to 320 × 240 pixels prior to training, with 5 × 5 convolutional filters used in the first two layers, a 4 × 4 filter in the third, and non-overlapping 2 × 2 max-pooling applied after each convolutional block, consistent with common practice in CNN-based vision pipelines. The narrower architecture achieved better generalization on held-out data and was therefore retained as the reported model; its performance on the NTHU-DDD test partition is presented in Figure 4 and Table III.

For downstream reporting, continuous EAR and MOR outputs were mapped onto a three-level ordinal drowsiness scale. A driver was classified as very tired under either of two conditions: sustained eye closure exceeding five seconds (more than 150 consecutive frames), or the joint occurrence of EAR above 0.24 together with MOR above 0.16. A driver was classified as getting tired when EAR fell within the intermediate range of 0.15–0.24 together with MOR above 0.16, or as less tired when EAR fell in that same range without an accompanying high MOR. All other cases were classified as normal (fully alert). This three-tier scheme was applied uniformly across the held-out test videos to generate the

Table I. Allocation of the 68 detected facial landmark points across facial regions of interest. Points 1–6 and 7–12 correspond to the right and left eyes, respectively, points 13–24 correspond to the mouth, and points 25–28 correspond to the nose, forming the geometric basis for all downstream ratio-based features.

Sl. No.

Facial Part

Landmark Point Indices

01

Right eye

1–6

02

Left eye

7–12

03

Mouth

13–24

04

Nose

25–28

Table II. Composition of the NTHU-DDD dataset used for model training and evaluation, broken down into training, validation, and test partitions. The dataset totals 62,910 labeled frames drawn from simulated driving recordings across 22 participants under varied behavioral conditions (normal driving, yawning, slow blinking, laughing, and dizzy dozing).

Sl. No.

Partition

Number of Frames (NTHU-DDD)

01

Training

41,600

02

Validation

10,800

03

Test

10,910

04

Total

62,910

Table III. Validation, test, and overall (average) classification accuracy of the proposed multi-task CNN model on the NTHU-DDD dataset. Values reflect performance of the retained, narrower network architecture (filter widths 6, 8, and 10 across its three convolutional layers) trained under the stochastic gradient descent settings described in the Methods.

Metric

NTHU-DDD Accuracy

Average Accuracy

Validation accuracy

98.96%

92.94%

Test accuracy

98.49%

95.69%

Overall (proposed approach)

98.72%

92.81%

Table IV. Comparison of the proposed system's average accuracy against previously reported driver drowsiness detection approaches spanning steering-behavior-based, EEG-based, and vision-based (CNN) methods. Reported figures are drawn directly from the cited studies and are not independently re-evaluated on a common test set, so comparisons should be interpreted as indicative rather than strictly controlled.

Approach

Reported Accuracy

Krajewski et al. (2009) — steering-behavior-based

86%

Mardi et al. (2011) — EEG-based

>90%

Hashemi et al. (2020) — TL-VGG16

98.53%

Dua et al. (2021) — ensemble CNN

85%

Proposed multi-task CNN approach

92.81%

Accuracy figures are reported in the Results section.

3. Results

3.1 Dataset Composition and Experimental Setup

Model development and evaluation drew on the NTHU-DDD corpus, partitioned into training, validation, and test subsets whose sizes are summarized in (Table II). As described in the Methods, the Dlib-based landmark detector supplied the 68 facial points from which EAR and MOR were derived for every frame, and these per-frame labels were what the multi-task convolutional network was ultimately trained to predict.

3.2 Architecture Comparison

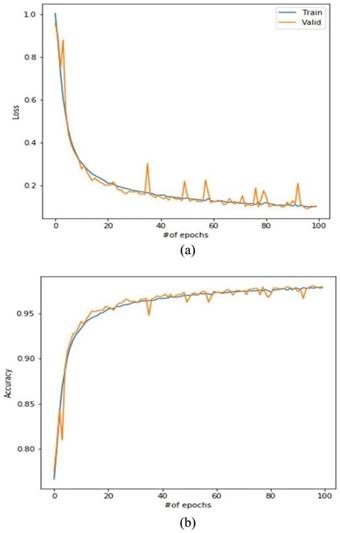
Two candidate network widths were evaluated head-to-head under identical stochastic gradient descent settings (batch size 64, momentum 0.6, weight decay 0.0005), and the difference between them turned out to matter more than we initially expected. The narrower architecture — filter counts of 6, 8, and 10 across its three convolutional layers — outperformed its wider counterpart (filter counts of 12, 15, and 20) on held-out validation data, which is a somewhat counterintuitive result if one assumes, as is common, that more capacity is strictly better; here, the smaller network appears to have generalized more effectively, plausibly because it was less prone to overfitting the relatively narrow behavioral cues encoded in EAR, MOR, and head-bending features. The narrower model is depicted schematically in (Figure 3), and its training dynamics — loss and accuracy curves across training and validation data — are shown in (Figure 4a) and (Figure 4b), respectively.

3.3 Detection Performance

On the NTHU-DDD dataset, the retained multi-task model achieved a validation accuracy of 98.96% and a corresponding average accuracy of 92.94%; on the held-out test partition, it achieved 98.49% raw accuracy alongside an average accuracy of 95.69%. Taking validation and test performance together, the proposed approach yielded an overall accuracy of 98.72%, with an average accuracy of 92.81% (Table III). These figures were broadly stable across the different behavioral conditions represented in the dataset (normal driving, yawning, slow blinking, and dizzy dozing), suggesting that the EAR–MOR–NLR feature combination is reasonably robust to the specific manner in which drowsiness manifests on a given driver's face.

3.4 Comparison with Prior Approaches

Set against the wider literature (Table IV), the proposed system compares favorably. It exceeds the 86% accuracy reported by Krajewski et al. (2009) for steering-behavior-based fatigue estimation and the 85% reported by Dua et al. (2021) for their ensemble CNN approach, while falling short of the EEG-based method of Mardi et al. (2011), which exceeded 90% accuracy, and of the transfer-learning VGG16 model reported by Hashemi et al. (2020), which reached 98.53%. This pattern is, on reflection, broadly consistent with what one might expect given the trade-offs discussed earlier: physiological and heavily pretrained vision models can push accuracy somewhat higher, but typically at the cost of either intrusiveness or a substantially larger computational footprint than the single, compact network evaluated here.

3.5 Drowsiness Classification by Behavioral Threshold

Applying the EAR and MOR thresholds described in the Methods (EAR below 0.24; MOR above 0.16) to the test videos produced a three-tier classification of driver state. Drivers whose eyes remained closed for more than five seconds, or who simultaneously exceeded both the EAR and MOR thresholds, were classified as very tired; those whose EAR fell within the intermediate 0.15–0.24 band, with or without an accompanying high MOR, were classified as getting tired or less tired, respectively; and all remaining cases were classified as normal. This layered scheme allowed the system to distinguish gradations of fatigue rather than collapsing driver state into a single binary alarm, which we would argue is closer to how drowsiness actually presents — as a gradual slide rather than a sudden switch.

4. Discussion

4.1 Principal Findings

Taken as a whole, these results suggest that a comparatively small, single multi-task convolutional network — built on interpretable facial features rather than end-to-end black-box learning — can approach, though not quite match, the accuracy ceiling established by heavier or physiologically invasive alternatives. The 92.81% average accuracy achieved here (Table III) sits above steering-pattern-based estimation (Krajewski et al., 2009) and above the multi-model ensemble reported by Dua et al. (2021), while trailing EEG-based detection (Mardi et al., 2011) and the transfer-learning VGG16

Figure 4. Training and validation performance of the multi-task CNN model on the NTHU-DDD dataset. (a) Model loss across training and validation data over successive training epochs. (b) Corresponding model accuracy across training and validation data over the same epochs, illustrating convergence behavior for the retained (narrower) network architecture.

model of Hashemi et al. (2020) (Table IV). That ordering is, we think, a reasonably honest reflection of the trade-offs each approach accepts: EEG electrodes and large pretrained backbones both buy additional accuracy, but the former does so by asking something uncomfortable of the driver, and the latter by asking something demanding of the hardware.

4.2 Why a Narrower Network Generalizes Better

One finding that is worth dwelling on a little longer is that the narrower of the two candidate architectures outperformed the wider one. It would have been easy to assume, going in, that more filters would simply mean more expressive power and, therefore, better accuracy; that assumption did not hold here. A plausible explanation is that the underlying feature space — EAR, MOR, and head-bending ratios, essentially low-dimensional geometric signals — does not require the representational capacity of a large network, and that the additional parameters in the wider model instead gave it more room to overfit incidental variation in the training partition. This is, admittedly, a post hoc interpretation rather than something we tested directly, and we would not want to overstate it; still, it is consistent with the broader observation in the drowsiness-detection literature that model size and detection accuracy do not track each other as tightly as one might expect (Hashemi et al., 2020).

4.3 Practical and Deployment Implications

From a deployment standpoint, the appeal of the proposed system lies less in its raw accuracy and more in what it does not require: no scalp electrodes, no dedicated in-vehicle sensor suite, and no ensemble of large pretrained backbones running in parallel. A single, modestly sized network operating on ordinary camera video is, in principle, something that could run on a smartphone mounted on a dashboard or on inexpensive embedded hardware built into a vehicle's infotainment system — which matters because, as noted in the Introduction, the manufacturer-installed systems from Volvo, Mercedes-Benz, and Bosch remain concentrated in higher-trim and luxury vehicles rather than the vehicle fleet as a whole. If a system like the one proposed here can deliver accuracy in the low-to-mid 90s without that hardware overhead, it becomes considerably easier to imagine it reaching drivers who currently have no drowsiness protection of any kind.

4.4 Limitations

Several limitations deserve acknowledgment. First, all training and evaluation were carried out on a single dataset (NTHU-DDD) collected under simulated rather than on-road driving conditions; real-world lighting, camera placement, and driver behavior are likely to be noisier than what a simulator can reproduce, so the accuracy figures reported here should be read as an upper bound rather than a guarantee of on-road performance. Second, the threshold-based calibration procedure assumes a genuinely alert baseline period at the start of each session, which may not always be available in practice — a driver who begins a trip already somewhat fatigued would presumably bias their own thresholds in a way that is difficult to detect from the video alone. Third, although the ensemble of auxiliary models (FlowImageNet, AlexNet, VGG-FaceNet, and ResNet, following Dua et al., 2021) improved robustness, it also reintroduces some of the computational overhead the primary network was designed to avoid, and the trade-off between the two has not been fully quantified here. Finally, demographic and situational diversity within the dataset — 22 participants, recorded under a limited set of simulated conditions — is modest relative to the diversity of real driving populations, which may limit how confidently these results generalize across, for instance, different ethnicities, eyewear prevalence, or nighttime driving conditions.

4.5 Future Directions

Building on this study's original future-work aims, an obvious next step is to move the system out of the laboratory and into an application-based deployment, where every licensed driver could, in principle, register a companion mobile application capable of monitoring drowsiness during actual trips and, where appropriate, sharing status information with relevant road-safety authorities. Beyond that, validating the pipeline on-road rather than in simulation, testing its robustness under varied lighting and eyewear conditions, and exploring lighter-weight temporal architectures that might close the remaining accuracy gap with EEG-based and heavier vision-based methods all seem like reasonable priorities for follow-up work.

5. Conclusion

This study set out to test whether a single, comparatively lightweight multi-task convolutional network could detect driver drowsiness from facial video alone, without leaning on physiological sensors or heavy multi-model ensembles. Using Dlib-derived facial landmarks to compute eye, mouth, and head-bending indices, and feeding these through a compact CNN trained with stochastic gradient descent, the system achieved 98.72% validation accuracy and an average accuracy of 92.81% on the NTHU-DDD dataset, alongside a three-tier drowsiness classification that captures gradations of fatigue rather than a single alarm threshold. These results sit competitively, if not always at the very top, of the accuracy range reported across steering-pattern, physiological, and vision-based methods in the literature, while requiring substantially less hardware and driver cooperation than most of the alternatives. Given its modest size, the proposed approach appears well suited to integration into advanced driver-assistance systems and, plausibly, into ordinary consumer smartphones — offering a realistic route toward drowsiness monitoring that could extend beyond the luxury-vehicle market it has largely remained confined to.


References


Bhardwaj, R., Natrajan, P., & Balasubramanian, V. (2018). Study to determine the effectiveness of deep learning classifiers for ECG based driver fatigue classification. In 2018 IEEE 13th International Conference on Industrial and Information Systems (ICIIS) (pp. 98–102). IEEE. https://doi.org/10.1109/ICIINFS.2018.8721418

Computer Vision Lab, National Tsing Hua University. (2016). Driver drowsiness detection dataset. Retrieved March 1, 2020, from http://cv.cs.nthu.edu.tw/php/callforpaper/datasets/DDD/

Dua, M., Shakshi, Singla, R., Raj, S., & Jangra, A. (2021). Deep CNN models-based ensemble approach to driver drowsiness detection. Neural Computing and Applications, 33(8), 3155–3168. https://doi.org/10.1007/s00521-020-05209-7

Ed-Doughmi, Y., Idrissi, N., & Hbali, Y. (2020). Real-time system for driver fatigue detection based on a recurrent neuronal network. Journal of Imaging, 6(3), Article 8. https://doi.org/10.3390/jimaging6030008

Hashemi, M., Mirrashid, A., & Beheshti Shirazi, A. (2020). Driver safety development: Real-time driver drowsiness detection system based on convolutional neural network. SN Computer Science, 1(5), Article 289. https://doi.org/10.1007/s42979-020-00306-9

Jabbar, R., Al-Khalifa, K., Kharbeche, M., Alhajyaseen, W., Jafari, M., & Jiang, S. (2018). Real-time driver drowsiness detection for Android application using deep neural networks techniques. Procedia Computer Science, 130, 400–407. https://doi.org/10.1016/j.procs.2018.04.060

Jamshidi, S., Azmi, R., Sharghi, M., & Soryani, M. (2021). Hierarchical deep neural networks to detect driver drowsiness. Multimedia Tools and Applications, 80, 16045–16058. https://doi.org/10.1007/s11042-021-10542-7

Krajewski, J., Sommer, D., Trutschel, U., Edwards, D., & Golz, M. (2009). Steering wheel behavior based estimation of fatigue. In Proceedings of the Fifth International Driving Symposium on Human Factors in Driver Assessment, Training and Vehicle Design (pp. 118–124). University of Iowa.

Mardi, Z., Ashtiani, S. N. M., & Mikaili, M. (2011). EEG-based drowsiness detection for safe driving using chaotic features and statistical tests. Journal of Medical Signals and Sensors, 1(2), 130–137.

McDonald, A. D., Lee, J. D., Schwarz, C., & Brown, T. L. (2018). A contextual and temporal algorithm for driver drowsiness detection. Accident Analysis & Prevention, 113, 25–37. https://doi.org/10.1016/j.aap.2018.01.005


Article metrics
View details
0
Downloads
0
Citations
44
Views

View Dimensions


View Plumx


View Altmetric


0
Save
0
Citation
44
View
0
Share