Data Modeling

Mathematical and Computational Data Modeling
1
Citations
7k
Views
37
Articles
Your new experience awaits. Try the new design now and help us make it even better
Switch to the new experience
Figures and Tables
RESEARCH ARTICLE   (Open Access)

Predicting Prediabetes from Simple Clinical Questionnaires: A Machine Learning Approach Using K-Nearest Neighbors and Decision Tree Models

Kamruzzaman Mithu 1*

+ Author Affiliations

Data Modeling 1 (1) 1-11 https://doi.org/10.25163/data.1110858

Submitted: 25 September 2020 Revised: 12 November 2020  Published: 25 November 2020 


Abstract

Background. Prediabetes affects an estimated 96 million American adults, yet more than 80% remain unaware of their condition — a gap that matters, since prediabetes is largely reversible while type 2 diabetes generally is not. Despite this, most predictive modeling efforts in the diabetes literature have focused on undiagnosed diabetes broadly, leaving prediabetes-specific prediction comparatively underexplored, partly because of scarce labeled data and persistent class imbalance. Methods. This study used a retrospective dataset of 1,000 patient records sourced from Medical City Hospital and the Al-Kindy Teaching Hospital in Iraq, comprising demographic and routine laboratory variables (e.g., BMI, HbA1c, lipid profile, blood urea). Feature selection combined manual review with information-gain analysis; outliers were identified and removed using boxplot- and histogram-based screening; and class imbalance across non-diabetic, prediabetic, and diabetic groups was addressed using SMOTE-based oversampling. Two classifiers — K-Nearest Neighbors and Decision Tree — were trained on a 70/30 split and evaluated using accuracy, precision, recall, F1-score, and AUROC. Results. The Decision Tree model achieved 82% accuracy, modestly outperforming KNN's 79%. Both models classified diabetic patients more reliably than prediabetic ones, a pattern attributable largely to the underlying class imbalance that oversampling only partially corrected. Conclusion. Reasonably accurate prediabetes screening appears achievable using a small set of accessible, low-cost variables, though prediabetes-specific detection remains disproportionately difficult given current data limitations. Expanding future datasets to include lifestyle and family-history variables, alongside testing ensemble methods, may meaningfully improve model reliability for this often-overlooked, high-risk population.

Keywords: prediabetes; machine learning; K-nearest neighbors; decision tree; early detection

1. Introduction

Most people have never heard of prediabetes, and that's part of the problem. It sits quietly in the space between "healthy" and "diabetic" — a kind of holding pattern where blood sugar has drifted upward but hasn't yet crossed into disease territory (Centers for Disease Control and Prevention [CDC], 2019; MedlinePlus, 2018). Clinicians sometimes describe it as an intermediate state of hyperglycemia, which is a clinical way of saying: the body's glucose regulation is starting to falter, even if nothing feels wrong yet. And that's precisely what makes it dangerous. Unlike a broken bone or a fever, prediabetes rarely announces itself. It just accumulates.

The numbers, once you actually sit with them, are hard to shrug off. In the United States alone, more than one in three adults — something like 96 million people — are living with prediabetes, and the CDC (2019) estimates that over 80% of them have no idea. Not "haven't been formally diagnosed yet." No idea at all. That gap between prevalence and awareness is arguably the central problem this paper is trying to chip away at. Left unaddressed, prediabetes raises the odds of developing type 2 diabetes, heart disease, and stroke (MedlinePlus, 2018; Mayo Clinic Staff, 2018). Clinicians typically rely on glycated hemoglobin — HbA1c, or A1C — to sort people into categories: below 5.7% is considered normal, 5.7% to 6.4% signals prediabetes, and 6.5% or above tips into diabetes. Even within that prediabetic band, risk isn't flat; the closer someone sits to 6.4%, the more precarious their trajectory tends to become (see Table 1).

Why does this happen to some people and not others? The honest answer is that no single cause fully explains it. Genetics and family history clearly matter (Mayo Clinic Staff, 2018), but they're tangled up with a long list of contributing factors — excess weight, poor diet, physical inactivity, aging, high blood pressure, ethnicity, impaired glucose tolerance, a history of gestational diabetes, inadequate nutrition during pregnancy, low HDL cholesterol, elevated triglycerides, polycystic ovary syndrome, insufficient sleep, and smoking, among others (Mayo Clinic Staff, 2018; American Diabetes Association [ADA], 2019). It's less a single trigger than a layering of risks, some inherited, some behavioral, some almost incidental.

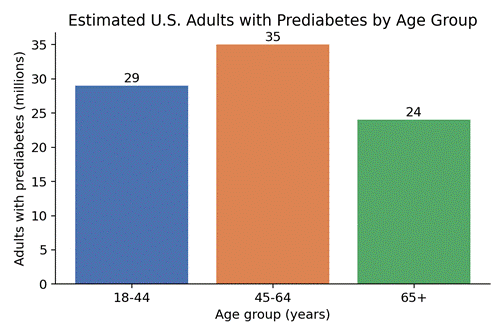
Scale that up to a national level and the picture becomes even more sobering. The CDC's National Diabetes Statistics Report (2018) puts the number at roughly 88 million U.S. adults aged 18 and older — about 34.5% of the adult population. Break it down by age and the pattern gets uncomfortable fast: nearly half of adults over 65 (46.6%) fall into this category, alongside about 24.3% of those aged 18–44 and 41.7% of those aged 45–64 (see Figure 1). Men are affected more than women — 37.4% versus 29.2% — and, perhaps most unsettling, more than one in six American teenagers between 12 and 18 already show signs of prediabetes (CDC, 2018). This isn't a disease confined to later life anymore.

And it isn't just a U.S. story. The World Health Organization has flagged diabetes as a condition rising fastest in middle- and low-income countries, often trailing complications like cardiovascular disease, kidney failure, and adult-onset blindness in its wake. Bangladesh offers a striking case in point. According to the International Diabetes Federation (2020), the country ranked 8th globally in 2021 for adults aged 20–79 living with diabetes — around 13.1 million people — and projections suggest it will climb to 7th place by 2045. In 2019 alone, roughly 8.4 million Bangladeshi adults had diabetes, a figure expected to nearly double to 15 million within a couple of decades, alongside an estimated 3.8 million already living with prediabetes. Diabetes prevalence among Bangladeshi adults jumped from around 5% in 2001 to about 14% by 2017 (Islam et al., 2021) — a rate of increase that, frankly, outpaces most public health infrastructure's ability to keep up.

Part of what makes this whole situation so stubborn is the near-total absence of symptoms. Prediabetes tends to stay invisible until something more serious — type 2 diabetes, usually — forces the issue (CDC, 2019; Mayo Clinic Staff, 2018). Occasionally there are hints: increased thirst, more frequent urination, a persistent hunger, fatigue, blurry vision, tingling or numbness in the hands or feet, infections that keep coming back, wounds that heal too slowly, weight loss nobody asked for (CDC, 2019). But these are easy to miss or explain away. Meanwhile, the underlying trajectory is fairly predictable: almost everyone who develops type 2 diabetes passes through prediabetes first, and people in that intermediate state face somewhere between a 5- and 15-fold higher risk of eventually crossing that line. Islam et al. (2021) found that up to 40.5% of individuals with prediabetes converted to full diabetes during follow-up — a conversion rate that's hard to read as anything but a call to intervene earlier.

Here's the more hopeful part, though: unlike type 2 diabetes, which isn't straightforwardly curable, prediabetes can often be reversed. Early treatment paired with fairly modest lifestyle changes — better food choices, more movement, weight loss, managing blood pressure and cholesterol, quitting smoking — can nudge blood glucose back toward a normal range and either delay or prevent the slide into type 2 diabetes altogether, even for people with a strong family history (Mayo Clinic Staff, 2018; ADA, 2019). Which raises an obvious question: if prediabetes is reversible, why isn't early detection more central to how we approach it? Deberneh and Kim (2021) make a similar point — that identifying the condition early is what actually opens the door to preventive action and a better quality of

Table 1. Classification of Blood Glucose Status Based on Glycated Hemoglobin (HbA1c) Levels. HbA1c values below 5.7% are classified as normal, values between 5.7% and 6.4% indicate prediabetes, and values of 6.5% or higher indicate diabetes; within the prediabetic range, risk of progression to type 2 diabetes increases with higher HbA1c values.


Fasting Plasma Glucose

Hemoglobin A1c

2-hr Oral Glucose Tolerance Test

Normal

70-99 mg/dl

<5.7%

<144 mg/dl

Prediabetes

100-125 mg/dl

5.7%-6.4%

144-199 mg/dl

Diabetes

>125 mg/dl

>6.4%

>199 mg/dl


Figure 1. Estimated Prevalence of Prediabetes Among U.S. Adults by Age Group. Bar chart showing the estimated number and percentage of U.S. adults with prediabetes across three age brackets (18–44, 45–64, and 65+ years), based on data from the CDC's National Diabetes Statistics Report (Centers for Disease Control and Prevention, 2018).

life down the line.

And yet, oddly, the research effort hasn't quite matched the stakes. Deberneh and Kim (2021) note that most machine learning work in this space has gravitated toward predicting undiagnosed diabetes broadly, leaving prediabetes itself comparatively under-studied. That's a curious gap, given that prediabetes is precisely the window where intervention still has the most leverage. Part of the reason for this neglect is practical rather than conceptual: building a robust prediction model for prediabetes is genuinely hard. Labeled data is scarce, missing values are common, and outliers tend to distort whatever signal is there. It's not that researchers don't see the value — it's that the data rarely cooperates.

This study is an attempt to work within those constraints rather than around them. Using data drawn from Iraqi patients treated at Medical City Hospital and the Specialized Center for Endocrinology and Diabetes–Al-Kindy Teaching Hospital (Rashid, 2020), the goal here was to build a prediction model grounded in a short, simple questionnaire — something lightweight enough that early screening doesn't require an elaborate clinical workup. Two machine learning approaches, K-Nearest Neighbors and Decision Tree, were developed and compared, with performance assessed through precision, recall, F1-score, and AUROC. The hope is modest but concrete: a tool simple enough to actually get used, in service of catching prediabetes before it quietly becomes something worse.
2. Methods

2.1 Study Design and Data Source

This study followed a retrospective, observational design built around a previously assembled clinical dataset rather than prospectively recruited patients. The data originated from two affiliated clinical sites in Iraq — the laboratory of Medical City Hospital and the Specialized Center for Endocrinology and Diabetes at Al-Kindy Teaching Hospital — and were made publicly available through Mendeley Data (Rashid, 2020). Patient records had already been extracted from hospital files and compiled into a structured database prior to this analysis, so no direct patient contact, recruitment, or additional data collection occurred as part of this work. It's worth being upfront about that limitation from the outset, since it shapes almost everything downstream: the feature set, the class distribution, and ultimately what the model can and cannot claim to detect were all constrained by decisions made when the original dataset was built, not by the present authors.

The dataset comprised 1,000 patient records, each containing a mix of demographic information and laboratory-derived measurements. Specifically, the following variables were available for each patient: number/identifier, blood sugar level, age, gender, creatinine ratio (Cr), body mass index (BMI), urea, total cholesterol (Chol), a fasting lipid profile (including LDL, VLDL, HDL, and triglycerides), HbA1c, and a class label indicating diabetes status — categorized as non-diabetic, prediabetic, or diabetic. A brief clarification on a few of these, mostly for readers outside clinical chemistry: LDL cholesterol is often described informally as the "bad" cholesterol, while HDL is considered protective, or "good"; triglycerides are dietary fats that accumulate when caloric or alcohol intake exceeds what the body immediately uses; the VLDL-to-triglyceride ratio is derived by dividing VLDL cholesterol by triglyceride concentration; and blood urea nitrogen (BUN) serves as a general marker of kidney function. None of these are exotic tests — which was, in fact, part of the appeal of this dataset, since the eventual aim was a screening tool built on measurements that are relatively easy to obtain rather than an elaborate panel requiring specialist referral.

2.2 Feature Selection

One complication surfaced almost immediately: the dataset's original features had been assembled with general diabetes classification in mind, not prediabetes specifically. That meant several variables known from the broader literature to matter for prediabetes risk — physical activity level, sleep quality, dietary pattern, and race or ethnicity — simply weren't captured. This is a real limitation, and it's discussed more fully later in the paper, but it also shaped how feature selection proceeded here.

Two complementary approaches were used. First, manual feature selection drew on the existing literature examining diabetes and prediabetes prediction models — including work by Choi et al. (2014), Deberneh and Kim (2021), and Tigga and Garg (2020), among others — cross-referenced against what was actually present in the available dataset. Second, an information-gain approach was applied to quantify each variable's statistical relevance to the target class. Information gain, calculated from the reduction in entropy attributable to a given feature, provides a reasonably interpretable way of ranking variables by how much they help separate the outcome classes; features contributing negligible information gain were considered for exclusion, while those most strongly associated with class separation were retained. Encouragingly, the dataset itself was well curated at the source — there were no missing values across any of the retained variables, which simplified preprocessing considerably and meant that no imputation procedure was required.

2.3 Outlier Detection and Removal

Because the retained features were all continuous, regression-type variables (blood chemistry values, BMI, age, and similar measures), outlier screening was restricted to this subset rather than applied to categorical fields. The rationale here is fairly standard in applied machine learning: a small number of extreme or implausible values — whether from measurement error, transcription mistakes, or genuine physiological outliers — can disproportionately distort model training, particularly for distance-based algorithms.

Outliers were identified visually and statistically using boxplots and histograms for each continuous variable. Boxplots, constructed from quartile boundaries and the interquartile range (IQR), provided upper and lower bounds beyond which a data point was flagged as atypical; values falling outside these bounds were removed prior to model training. This step was applied uniformly across all continuous features before any further modeling took place, so that subsequent training and evaluation were conducted on a cleaned dataset free of extreme values that might otherwise have skewed the results.

2.4 Handling Class Imbalance

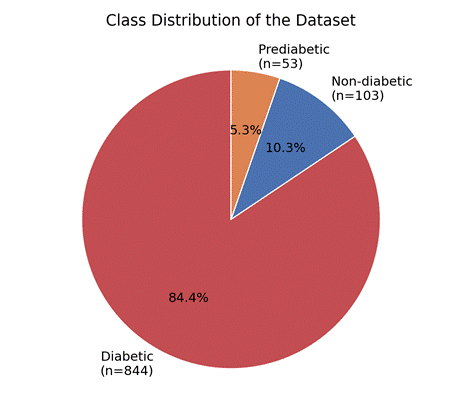
Class imbalance turned out to be, arguably, the single most consequential methodological challenge in this study. Of the 1,000 records, only 103 belonged to non-diabetic patients and 53 to prediabetic patients, while the remaining 844 were diabetic (Figure 2). This kind of skew is a well-documented problem in clinical machine learning: a model can achieve deceptively high raw accuracy simply by defaulting to the majority class, while performing poorly — sometimes close to uselessly — on the minority classes that are often the ones of greatest clinical interest.

To address this, an oversampling strategy was applied to the minority classes (non-diabetic and, especially, prediabetic patients), rather than discarding majority-class data through undersampling, which risked throwing away useful information given the already modest sample size. Oversampling in this context did not simply duplicate existing minority-class records; instead, synthetic minority oversampling technique (SMOTE) was used, which generates new synthetic instances by interpolating between existing minority-class examples rather than copying them outright (Erlin et al., 2020). This approach, which has also been applied in comparable diabetes prediction work (Erlin et al., 2020), aims to produce a more diverse and representative minority-class sample than simple duplication would allow, reducing the risk of the model overfitting to a small number of repeated cases.

2.5 Model Development

2.5.1 K-Nearest Neighbors (KNN)

The first model applied was K-Nearest Neighbors, a non-parametric, instance-based supervised classifier that assigns a class label to a new observation based on its proximity to labeled examples already stored in memory. KNN was chosen partly for its simplicity and interpretability, and partly because it tends to perform reasonably well on noisy clinical data and has an established track record in disease-prediction contexts (Hasan et al., 2020; Tigga & Garg, 2020).

Model development was carried out in Google Colab using the scikit-learn implementation of the KNN classifier. An odd value of k was selected at the outset to avoid tie-voting complications common in binary or multi-class neighbor voting. The dataset was partitioned into training and testing subsets using a 70:30 split, with 70% of records used to fit the model and the remaining 30% withheld for evaluation. This split ratio is fairly conventional in the diabetes-prediction literature and was chosen to balance adequate training data against a testing set large enough to yield a stable performance estimate. The overall analytical workflow, from raw data through preprocessing to model output, is summarized in methods sections

2.5.2 Decision Tree

The second model was a Decision Tree classifier, selected as a complementary approach given its transparency and ease of clinical interpretation — a property that matters when the eventual goal is a tool clinicians or patients might actually trust and use, not just a black-box output. Decision trees operate by recursively partitioning the dataset into progressively more homogeneous subgroups based on feature values.

Node splitting was guided by the Iterative Dichotomiser 3 (ID3) algorithm, which selects, at each branching point, the attribute yielding the maximum information gain — the same entropy-based logic used earlier during feature selection, here repurposed to structure the tree itself. As with the KNN model, data were divided into a 70% training and 30% testing split, ensuring that both models were evaluated under identical data-partitioning conditions to allow a fair, like-for-like comparison of their respective performance.

2.6 Model Evaluation

Both models were assessed using a consistent set of performance metrics: precision, recall, F1-score, and area under the receiver operating characteristic curve (AUROC). This particular combination was chosen deliberately rather than relying on raw accuracy alone, precisely because accuracy can be misleading in an imbalanced classification setting of the kind described above (see Section 3.4) — a concern echoed in prior diabetes-prediction studies that adopted similar multi-metric evaluation strategies (Mahboob Alam et al., 2019; Hasan et al., 2020). Precision and recall together offer a more granular picture of how each model performed specifically on the minority prediabetic and non-diabetic classes, rather than being dominated by performance on the numerically larger diabetic group. AUROC, meanwhile, provides a threshold-independent summary of each classifier's discriminative ability across the full range of possible decision boundaries. Taken together, these four metrics were intended to give a reasonably complete and honest account of model performance — one that doesn't paper over the class-imbalance problem this dataset presented from the very beginning.


3. Results

3.1 Dataset Composition After Preprocessing

Once the cleaning steps described in the Methods section had run their course — outlier removal, feature paring, and the SMOTE-based oversampling applied to the minority classes — the working dataset still carried the fingerprint of its original imbalance. Of the 1,000 patient records, 103 belonged to non-diabetic individuals, 53 to prediabetic individuals, and a much larger 844 to diabetic patients (Figure 2). It's worth pausing on that ratio for a moment, because it isn't a minor technical footnote; a nearly 16:1 imbalance between the diabetic and prediabetic classes shapes almost everything that follows, and it's the lens through which the remaining results probably ought to be read. Nine attributes, drawn from the feature-selection process outlined earlier, were ultimately retained to build both classification models.

3.2 Model Performance

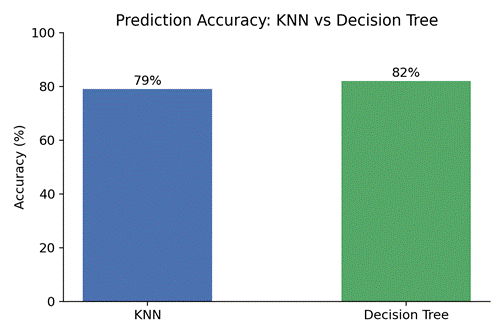
Two models were trained and compared under identical data-splitting conditions — a 70/30 train-test partition, as described previously. The K-Nearest Neighbors classifier reached an overall accuracy of 79%, while the Decision Tree model performed somewhat better, at 82% (Figure 3). That six-point gap isn't enormous, but it's also not nothing, and it fits reasonably well with what other groups working on adjacent diabetes-prediction problems have reported. Hasan et al. (2020), for instance, tested a broader battery of algorithms — including KNN and decision trees alongside random forest, naive Bayes, and boosting methods — on the Pima Indian Diabetes dataset and likewise found tree-based approaches holding a modest edge over instance-based methods like KNN. Tigga and Garg (2020) went a step further, finding that random forest classifiers outperformed both KNN and single decision trees across two separate datasets, which might suggest that ensemble approaches could eventually offer additional gains beyond what either single model achieved here — though testing that possibility falls outside the scope of the present analysis.

Precision, recall, and F1-score were calculated for both models to get a fuller sense of where each one was actually succeeding, rather than relying on accuracy as a single, somewhat blunt summary statistic. And here the picture becomes a bit more complicated, in a way that's fairly predictable once the class imbalance is taken into account. Both the KNN and Decision Tree models were noticeably better at correctly identifying diabetic patients than prediabetic ones — which, given that diabetic cases outnumbered prediabetic cases by a wide margin even after oversampling, is perhaps not all that surprising. Still, it's a limitation worth naming plainly rather than glossing over, since the entire premise of this study was to build something useful specifically for prediabetes detection. Deberneh and Kim (2021) ran into a strikingly similar problem in their own work: despite using a considerably larger dataset with a richer array of laboratory features,

Figure 2. Class Distribution of the Study Dataset Before and After Oversampling. Bar chart illustrating the number of non-diabetic (n = 103), prediabetic (n = 53), and diabetic (n = 844) patient records in the original dataset, highlighting the class imbalance addressed through SMOTE-based oversampling prior to model training.

Figure 3. Comparative Prediction Performance of the K-Nearest Neighbors and Decision Tree Models. Bar chart comparing overall classification accuracy achieved by the KNN (79%) and Decision Tree (82%) models on the held-out 30% test set.

they too found that most classification errors clustered within the prediabetes category, even when ensemble models were brought in to try to smooth things over. That convergence across two fairly different datasets and analytical approaches hints that this may be less an artifact of any one study's design choices and more a structural challenge tied to how prediabetes data tends to be collected and represented in general.

3.3 Discriminative Ability (AUROC)

Area under the receiver operating characteristic curve (AUROC) was used as a threshold-independent measure of each classifier's ability to distinguish between classes — a metric that, unlike raw accuracy, doesn't get quite so easily inflated by an imbalanced dataset (Figure 3). Both models produced AUROC values consistent with their accuracy rankings, with the Decision Tree edging out KNN. This pattern loosely echoes what Mahboob Alam et al. (2019) observed when comparing artificial neural networks against random forest and k-means clustering on a different diabetes dataset; they too used AUROC alongside accuracy specifically because relying on accuracy alone can paint an overly rosy picture when one class dominates the sample. Choi et al. (2014) took a related approach when comparing an artificial neural network against a support vector machine for prediabetes screening, finding SVM to be the stronger performer of the two — a reminder, perhaps, that the "best" algorithm tends to be fairly dataset-dependent rather than universally fixed, and that KNN or Decision Tree outperforming one another here doesn't necessarily generalize cleanly to other prediabetes cohorts.

3.4 Influence of Class Imbalance on Overall Findings

Taken together, these results point fairly consistently in one direction: class imbalance was not a peripheral issue but arguably the dominant factor shaping model behavior throughout this study. Even after SMOTE-based oversampling was applied to boost representation of the non-diabetic and prediabetic groups, the diabetic class still carried enough numerical weight to pull both models' predictive strength toward itself. This is broadly consistent with what's been reported elsewhere in the diabetes-prediction literature — Erlin et al. (2020), for example, turned to SMOTE for much the same reason, working with the Pima Indians Diabetes Database, and encountered comparable difficulty in fully neutralizing the effects of skewed class sizes even after oversampling was applied.

None of this is meant to undercut the results outright — an 82% accuracy figure for a model built on just nine relatively simple, low-cost features is a reasonably encouraging starting point, particularly given the practical goal of a lightweight, questionnaire-style screening tool rather than an elaborate diagnostic system. But it does mean the numbers should be read with a fairly clear-eyed sense of their limits: both models were, in effect, better tuned to recognizing diabetes than to catching prediabetes early — which is, somewhat ironically, the exact population this study set out to serve in the first place.

4. Discussion

4.1 Interpreting the Main Findings

Stepping back from the numbers themselves, what this study seems to show is fairly consistent with a broader pattern already visible across the prediabetes and diabetes prediction literature: relatively simple machine learning models, built on a modest handful of accessible features, can achieve reasonably decent classification performance — but "reasonably decent" and "clinically reliable" aren't quite the same thing, and the gap between them matters here. The Decision Tree model outperformed KNN by a small but consistent margin across accuracy and AUROC (Figure 2), which broadly echoes what Hasan et al. (2020) found when comparing tree-based methods against instance-based classifiers like KNN on a similarly structured diabetes dataset. That said, neither model in this study came close to fully solving the underlying problem, and it's worth being honest about why.

The class imbalance issue discussed in the Results section (Figure 2) wasn't just a statistical inconvenience — it appears to be something closer to a structural feature of how prediabetes data tends to get collected in clinical settings generally. Deberneh and Kim (2021) ran into essentially the same wall: using a considerably larger, six-year electronic medical record dataset with a richer set of laboratory variables, they still found that most classification errors clustered specifically within the prediabetes category, even after applying ensemble methods that, in theory, should have been better equipped to handle exactly this kind of imbalance. The fact that two studies, working with quite different datasets, sample sizes, and modeling approaches, converge on the same weak spot suggests this isn't merely a quirk of one particular dataset or one particular algorithm choice. It may instead reflect something more fundamental about how prediabetes itself gets recorded — as a comparatively rare, transitional label sitting between two much more clearly defined and numerically dominant categories.

4.2 Comparison With Prior Machine Learning Approaches

Placed alongside earlier work, the present findings sit in a fairly reasonable middle ground. Choi et al. (2014), working with the Korean National Health and Nutrition Examination Survey, found that a support vector machine outperformed an artificial neural network for prediabetes screening specifically — a result that, on its face, might suggest SVM-style approaches deserve more attention in future iterations of this line of work. Mahboob Alam et al. (2019), meanwhile, reported that an artificial neural network beat out both random forest and k-means clustering on a different diabetes dataset, and additionally uncovered a fairly clear relationship between BMI, blood pressure, and diabetes status — a finding that resonates with the feature set used in the present study, where BMI and related laboratory values were similarly retained as core predictors.

Tigga and Garg (2020) took a slightly different tack, testing KNN, SVM, naive Bayes, decision tree, and random forest side by side across two datasets, and landed on random forest as the strongest overall performer. That's a reasonably useful data point here, since it raises the fairly obvious question of whether an ensemble approach — random forest, or perhaps a boosting method along the lines of what Hasan et al. (2020) tested — might have closed some of the gap left open between the KNN and Decision Tree models used in this study. That's a genuinely open question, and one this study wasn't designed to answer, but it does seem like a natural next step worth flagging. Erlin et al. (2020) offer a somewhat more direct point of comparison, given that they too relied on SMOTE to address class imbalance, in their case using the Pima Indians Diabetes Database; their experience, like the one described here, suggests that oversampling helps but doesn't fully neutralize the underlying skew, particularly when the minority class is not just underrepresented but also clinically ambiguous, as prediabetes tends to be.

4.3 Why Prediabetes-Specific Prediction Remains Difficult

There's a recurring thread running through this whole body of work, and it's one this study inherited rather than solved: most existing diabetes datasets simply weren't built with prediabetes in mind. They tend to be organized around a fairly clean binary — diabetic versus non-diabetic — with prediabetes tucked in almost as an afterthought, if it's captured at all. That was true here as well. The dataset used in this study (Rashid, 2020) was assembled primarily around diabetes-related indicators, which meant several variables known from the broader literature to matter for prediabetes specifically — family history, physical activity, dietary quality, race, gestational diabetes history — simply weren't available to include. Deberneh and Kim (2021) made a related observation, noting that comparatively little research attention has gone toward prediabetes prediction specifically, with most published work instead targeting undiagnosed diabetes more broadly. If that pattern continues, it's hard to see how prediction models in this space will meaningfully improve, since the models can only ever be as good as the data underlying them, and right now that data isn't quite fit for purpose.

Bangladesh-focused evidence from Islam et al. (2021) reinforces just how much is riding on getting this right. Their work found that up to 40.5% of individuals with prediabetes converted to full diabetes during follow-up — a conversion rate that, frankly, underscores how narrow and valuable the intervention window really is. A prediction tool that catches prediabetes early, even imperfectly, could plausibly shift outcomes for a meaningful share of that population. But a tool that systematically misclassifies prediabetic individuals as diabetic or non-diabetic — which is essentially the pattern observed in this study — risks missing that window entirely, for the very group it was meant to help most.

4.4 Clinical and Practical Implications

Despite these caveats, there's a reasonably practical case to be made for the approach taken here. Both models were built using variables that are relatively inexpensive and widely accessible — blood sugar, BMI, basic lipid panel components, HbA1c, and a handful of demographic details — rather than requiring an extensive or costly diagnostic workup. That aligns with the broader rationale behind questionnaire-based and simple-feature screening tools more generally: even an imperfect model, if it's cheap and easy enough to deploy at scale, might do more net good than a more accurate model that's too resource-intensive to actually reach the people who need it. American Diabetes Association (2019) guidance and CDC (2019) messaging both emphasize that even modest lifestyle interventions, applied early, can meaningfully alter the trajectory toward type 2 diabetes — which suggests that a screening tool doesn't necessarily need to be perfect to be useful; it mainly needs to nudge more people toward getting tested and, where appropriate, toward making those early changes.

4.5 Toward More Robust Prediabetes Prediction Models

Looking ahead, a few directions seem fairly clearly indicated by what this study ran into. First, and perhaps most obviously, future datasets built specifically around prediabetes — rather than diabetes more broadly, with prediabetes as a secondary or incidental category — would likely do more to advance this line of research than further refinement of modeling techniques applied to existing, imbalanced data. Second, incorporating variables absent from the current dataset — physical activity, sleep quality, dietary patterns, family history, gestational diabetes history — could meaningfully strengthen predictive performance, particularly for the prediabetic class specifically, in ways that laboratory values alone don't seem able to capture. Third, testing ensemble methods, along the lines of what Tigga and Garg (2020) and Hasan et al. (2020) explored, against the same nine-feature set used here might help clarify whether the accuracy ceiling observed in this study reflects a limitation of the algorithms chosen or a more fundamental limitation of the data itself.

None of this is meant to overstate what a relatively modest study like this one can conclude. But taken together with the broader literature it sits alongside, the results here point fairly consistently toward the same underlying message: prediction models for prediabetes are achievable, and even reasonably accurate, but meaningfully improving them will likely depend less on algorithmic sophistication and more on collecting better, more prediabetes-specific data in the first place.


5. Conclusion

This study set out to do something fairly modest, in the end: see whether a handful of routine, inexpensive clinical measurements could reasonably predict prediabetes using standard machine learning tools. The answer seems to be a qualified yes. Both the K-Nearest Neighbors and Decision Tree models achieved respectable accuracy — 79% and 82%, respectively — though neither fully overcame the underlying class imbalance that shaped much of this analysis, and prediabetic cases in particular proved harder to classify correctly than diabetic ones. That's a limitation worth sitting with rather than smoothing over. Still, the broader takeaway feels reasonably encouraging: earlier detection remains one of the more promising levers available for reducing the number of people who eventually progress to type 2 diabetes, but only if the underlying data improves. Future work would likely benefit from larger, prediabetes-specific datasets that incorporate lifestyle and family-history variables, alongside testing across a wider range of model architectures.


Author Contribution

K.M. conceived and designed the study, performed data preprocessing including feature selection, outlier removal, and SMOTE-based class balancing, implemented and evaluated the K-Nearest Neighbors and Decision Tree models, analyzed the results, and wrote, reviewed, and approved the final manuscript.

Acknowledgement

The author K.M. would like to thank Medical City Hospital and Al-Kindy Teaching Hospital, Iraq, for providing access to the patient records used in this study.

References


American Diabetes Association. (2019). Prediabetes. https://diabetes.org/diabetes/prediabetes

Centers for Disease Control and Prevention. (2019). Prediabetes: Your chance to prevent type 2 diabetes. https://www.cdc.gov/diabetes/basics/prediabetes.html

Centers for Disease Control and Prevention. (2018). National diabetes statistics report. https://www.cdc.gov/diabetes/data/statistics-report/index.html

Choi, S. B., Kim, W. J., Yoo, T. K., Park, J. S., Chung, J. W., Lee, Y., Kang, E. S., & Kim, D. W. (2014). Screening for prediabetes using machine learning models. Computational and Mathematical Methods in Medicine, 2014, Article 618976. https://doi.org/10.1155/2014/618976

Deberneh, H. M., & Kim, I. (2021). Prediction of type 2 diabetes based on machine learning algorithm. International Journal of Environmental Research and Public Health, 18(6), Article 3317. https://doi.org/10.3390/ijerph18063317

Erlin, Junadhi, Agustin, L., Fajri, N., & Sari, S. N. (2020). Early detection of diabetes using machine learning with logistic regression algorithm. Jurnal Nasional Teknik Elektro dan Teknologi Informasi. https://jurnal.ugm.ac.id/v3/JNTETI/article/view/3586/1647

Hasan, M. K., Alam, M. A., Das, D., Hossain, E., & Hasan, M. (2020). Diabetes prediction using ensembling of different machine learning classifiers. IEEE Access, 8, 76516-76531. https://doi.org/10.1109/ACCESS.2020.2989857

International Diabetes Federation. (2020). IDF diabetes atlas (10th ed.). https://diabetesatlas.org/

Islam, R. M., Islam, S. M. S., Ferrari, A. J., Rahman, M. M., & Rahman, M. A. (2021). Prevalence of diabetes and prediabetes among Bangladeshi adults and associated factors: Evidence from the demographic and health survey, 2017-18. medRxiv. https://doi.org/10.1101/2021.01.26.21250519

Mahboob Alam, T., Iqbal, M. A., Ali, Y., Wahab, A., Ijaz, S., Baig, T. I., Hussain, A., Malik, M. A., Raza, M. M., Ibrar, S., & Abbas, Z. (2019). A model for early prediction of diabetes. Informatics in Medicine Unlocked, 16, Article 100204. https://doi.org/10.1016/j.imu.2019.100204

Mayo Clinic Staff. (2018). Prediabetes: Symptoms and causes. Mayo Clinic. https://www.mayoclinic.org/diseases-conditions/prediabetes/symptoms-causes/syc-20355278

MedlinePlus. (2018). Prediabetes. National Library of Medicine. https://medlineplus.gov/prediabetes.html

Rashid, A. (2020). Diabetes dataset [Data set]. Mendeley Data. https://data.mendeley.com/datasets/wj9rwkp9c2/1

Tigga, N. P., & Garg, S. (2020). Prediction of type 2 diabetes using machine learning classification methods. Procedia Computer Science, 167, 706-716. https://doi.org/10.1016/j.procs.2020.03.336


Article metrics
View details
0
Downloads
0
Citations
18
Views
📖 Cite article

View Dimensions


View Plumx


View Altmetric


0
Save
0
Citation
18
View
0
Share