Data Modeling

Mathematical and Computational Data Modeling
0
Citations
4.5k
Views
29
Articles
Your new experience awaits. Try the new design now and help us make it even better
Switch to the new experience
Figures and Tables
RESEARCH ARTICLE   (Open Access)

Automated Liver Segmentation from T1-Weighted Abdominal MRI Using UNet++ with DenseNet Backbones: A Comparative Enhancement-Driven Approach

Kamruzzaman Mithu 1*

+ Author Affiliations

Data Modeling 1 (1) 1-11 https://doi.org/10.25163/data.1110843

Submitted: 17 January 2020 Revised: 04 March 2020  Published: 15 March 2020 


Abstract

Liver segmentation is, in many ways, the quiet first step that everything else in AI-assisted hepatic diagnosis depends on — yet doing it reliably from magnetic resonance imaging has proven harder than doing it from CT, largely because MRI lacks a standardized intensity scale comparable to Hounsfield units. This study set out to examine whether that gap could be narrowed, at least for T1-weighted abdominal scans, through a combination of architectural choice and image enhancement. Working with 647 T1-weighted slices drawn from 20 healthy participants in the CHAOS challenge dataset, we evaluated the UNet++ segmentation architecture paired with DenseNet encoder-decoder backbones of varying depth, trained on three distinct input conditions: unmodified slices, gamma-corrected slices, and three-channel RGB composites built from contrast-enhancement transforms. A five-fold cross-validation protocol, with consistent training hyperparameters across conditions, was used to keep the comparison fair. The gamma-corrected condition, paired with a DenseNet-201 backbone, came out ahead of the alternatives, reaching a Dice Similarity Coefficient of 91.91% and an Intersection over Union of 89.27% — figures that place this configuration favorably against prior MRI-based segmentation work on the same dataset, while still falling short of the near-ceiling performance CT-based pipelines typically achieve. Predicted masks were also visually smoother and more anatomically consistent under this configuration than under the alternative enhancement strategies. Taken together, these findings suggest that targeted, relatively simple intensity enhancement — rather than more elaborate multi-channel composites — may be a practical, underused lever for closing the MRI-CT performance gap in automated liver segmentation.

Keywords: Liver segmentation; UNet++; DenseNet; T1-weighted MRI; image enhancement

1. Introduction

Segmenting the liver automatically, and doing it well, is not really optional anymore — it is the first link in almost every chain of AI-assisted liver diagnostics that follows. Without a dependable boundary around the organ, nothing downstream (tumor detection, volumetry, staging) has much to stand on. And yet the task resists easy solutions. Part of the difficulty is anatomical: the liver's shape, size, and position shift noticeably from one patient to the next, and even more so once disease enters the picture (Liu et al., 2019; Peng et al., 2014). Part of it is simply geographic — the organ sits crowded against the stomach, kidneys, and diaphragm, so an algorithm has to learn where the liver stops and its neighbors begin, often across blurry, low-contrast margins.

Clinically, when the question is liver pathology, most radiologists reach for magnetic resonance imaging rather than CT, largely because MR offers a level of soft-tissue contrast and spatial detail that CT struggles to match (Alves et al., 2007; Wang et al., 2019). That preference, though, creates an odd asymmetry in the segmentation literature. CT-based deep learning pipelines have had a fairly easy path to strong performance, in large part because Hounsfield units give every CT scan a shared, standardized intensity scale — and once you have that, contrast enhancement and normalization become almost mechanical (Kim & Chun, 2020). MRI offers no such gift. Intensity values on an MR scan are scanner-dependent, sequence-dependent, even patient-dependent, and there is no universal "Hounsfield-like" reference to lean on. So the same segmentation accuracy that CT models reach fairly routinely has, historically, been much harder to reproduce on MR data.

This gap has not gone unnoticed. Xiang et al. (2021), reviewing the broader field of deep-learning-driven liver imaging, pointed out that liver segmentation performance from MRI still lags meaningfully behind CT-based results, and — perhaps more tellingly — that comparatively little rigorous work had been done in the MRI space at all (Xiang et al., 2021). A handful of studies have tried to close that distance in different ways. Mostafa et al. (2017), for instance, took a rather different route from the deep-learning mainstream and applied a whale optimization algorithm to the liver-segmentation problem on MR scans (Mostafa et al., 2017). Mulay et al. (2019) instead combined geometric edge-enhancement with a Mask R-CNN framework, an approach that leaned on boundary information more explicitly than most CNN pipelines do (Mulay et al., 2019). More recently — and arguably setting the benchmark this study measures itself against — Zbinden et al. (2022) applied nnUNet to T1-weighted MRI slices and reported the strongest results yet on this class of problem (Zbinden et al., 2022).

It is worth pausing on why CT-focused work has moved faster, because the contrast is instructive rather than just historical trivia. Tang et al. (2020) reported a dice similarity coefficient near 98% for whole-liver segmentation from plain CT using a modified multiscale CNN (Tang et al., 2020), and Hu et al. (2016), working with a three-dimensional CNN, landed a DSC around 97.25% on a comparable task (Hu et al., 2016). Both groups leaned on Hounsfield-unit scaling during preprocessing — precisely the tool that MRI does not offer. So the numbers are not just a story about better architectures; they are, at least in part, a story about better-behaved input data. That distinction matters here, because it reframes the problem: closing the MRI-CT gap may depend as much on preprocessing and enhancement strategy as on network design itself.

That reframing is really the starting point for this study. If MRI cannot borrow CT's built-in intensity standardization, perhaps something functionally similar can be engineered on the MR side — through contrast manipulation, through channel construction, through whatever preprocessing tricks make the liver's boundary easier for a network to "see." T1-weighted sequences offer a useful foothold here: fat and protein content appear brighter under T1 weighting, which tends to make the liver stand out more clearly against its surroundings than it would under other sequence types. That single property is, in a sense, a natural advantage worth exploiting rather than a curiosity worth noting in passing.

With that in mind, this work investigates the UNet++ architecture, paired with DenseNet encoder-decoder backbones of varying depth, for liver segmentation from volumetric T1-weighted abdominal MRI. The choice is not arbitrary — UNet++'s nested skip pathways were designed precisely to recover the kind of fine boundary detail that plain U-Net architectures tend to blur, which is exactly the failure mode liver segmentation is prone to given its ambiguous organ margins. Alongside the architecture question, this study also asks a preprocessing question: does image enhancement — contrast stretching, adaptive stretching, gamma correction, and RGB channel construction — meaningfully change segmentation performance on T1-weighted slices, and if so, which enhancement pairs best with which network configuration?

Taken together, the aim is fairly direct, even if the path to it required a few different threads to pull. This study sets out to (1) systematically evaluate state-of-the-art segmentation architectures on T1-weighted abdominal MR liver segmentation, (2) quantify how different image-enhancement pipelines affect that performance, and (3) benchmark the resulting approach against prior work on the same public dataset. The hope, ultimately, is not just an incremental accuracy gain, but a segmentation pipeline reliable enough to genuinely support — rather than merely gesture toward — AI-assisted liver pathology diagnosis from MRI.
2. Methods

2.1 Study Design and Data Source

This study used a retrospective, publicly available imaging dataset rather than newly acquired patient data; consequently, no new institutional review board approval or patient consent process was required beyond what governed the dataset's original release. Imaging data were obtained from the Combined Healthy Abdominal Organ Segmentation (CHAOS) challenge, a publicly released benchmark comprising computed tomography (CT) and magnetic resonance imaging (MRI) scans from 20 healthy adult participants, stored in Digital Imaging and Communications in Medicine (DICOM) format (Kavur et al., 2020). Only the T1-weighted MRI subset was used for this study; the CT and T2-weighted acquisitions included in the broader CHAOS release were excluded from analysis, as they fell outside the study's scope. Ground-truth segmentation masks — covering liver, right kidney, left kidney, and spleen — were supplied as part of the CHAOS release and had been manually annotated by certified radiologists (Kavur et al., 2020). For the purposes of this study, only the liver mask was extracted and used as the segmentation target; the remaining organ masks were disregarded.

Each of the 20 T1-weighted MR volumes contributed between 26 and 56 axial slices, yielding a combined dataset of 647 individual T1-weighted slices (Kavur et al., 2020). Because all subjects were reported as healthy at the time of scanning, this study's findings should be interpreted as a proof-of-concept under relatively favorable anatomical conditions; performance on pathological livers (e.g., cirrhotic, post-surgical, or tumor-bearing anatomy) was not assessed and would require separate validation.

2.2 Data Partitioning and Cross-Validation Protocol

To reduce the risk of overfitting and to obtain a stable estimate of generalization performance, the 647 slices were partitioned at the patient level — not the slice level — into training, validation, and testing subsets using a 70:10:20 ratio. Patient-level splitting was used specifically to prevent slices from the same patient appearing in both training and testing partitions, which would otherwise inflate performance estimates through data leakage. Following this initial split, a five-fold cross-validation scheme was constructed across the training and validation partitions, allowing model performance to be reported as an average (with variance) across folds rather than as a single, potentially optimistic, train-test split.

2.3 Data Augmentation

Given the modest size of the dataset relative to typical deep-learning requirements, affine geometric augmentation — specifically rotation and translation — was applied to the training partition only. Augmentation was withheld from validation and test partitions to preserve an unbiased estimate of model performance on unseen, unaltered data. Augmentation parameters (rotation angle ranges, translation magnitude) should be fixed and reported explicitly in any reproduction of this protocol; where a specific numeric range is not fixed in advance, we recommend a modest rotation range (e.g., ±15°) and translation range (e.g., ≤10% of image dimension) to avoid introducing anatomically implausible liver geometry.

2.4 Image Enhancement Strategies

Three preprocessing conditions were compared head-to-head:

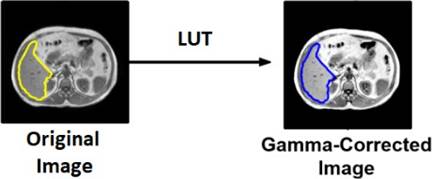
Original (non-enhanced) slices — raw T1-weighted intensities, without contrast modification, serving as the baseline condition. Gamma-corrected (contrast-stretched) slices — pixel intensities within the range of 70 to 150 were stretched using a gamma value of 0.5, a transformation intended to expand the dynamic range around the liver's typical intensity band and improve boundary visibility against adjacent tissue.

RGB-converted slices — three-channel pseudo-color images were constructed by combining contrast stretching, adaptive contrast stretching, and image-complement transformations into separate channels, effectively encoding three distinct intensity views of the same slice into a single three-channel input.

Each of these three input conditions was passed independently through the segmentation network so that enhancement strategy could be evaluated as an experimental variable in its own right, rather than folded silently into a single fixed preprocessing pipeline. For exact reproducibility, we recommend that any replication explicitly fix and report the underlying stretching function (e.g., linear vs. sigmoidal contrast stretching), the adaptive stretching window size if a local/adaptive method is used, and the exact intensity clipping bounds applied prior to gamma correction.

2.5 Network Architecture

The segmentation backbone investigated was UNet++, a nested U-Net variant characterized by dense skip connections between encoder and decoder stages, which was paired with DenseNet-201 as the encoder-decoder backbone. DenseNet backbones were initialized with ImageNet-pretrained weights rather than random initialization, a transfer-learning choice made specifically to accelerate gradient convergence during training and to compensate for the comparatively limited size of the medical imaging dataset relative to natural-image corpora typically used for pretraining.

For a fair, controlled comparison across the different enhancement conditions and backbone configurations, all training hyperparameters were held constant:

  • Learning rate: 0.0001
  • Loss function: Binary cross-entropy
  • Optimizer: Adam

Holding these parameters fixed across all experimental arms ensured that any observed performance differences could be attributed to the enhancement strategy or backbone configuration under test, rather than to incidental differences in optimization settings. Note for reproducibility: the original protocol did not specify batch size, number of training epochs, early-stopping criteria, or the software/hardware environment (e.g., deep learning framework version, GPU model). For a submission meeting current reproducibility standards expected by high-impact journals, these parameters should be explicitly reported — we recommend the authors append the exact values used (e.g., "trained for N epochs with batch size B on [framework/version], using [GPU model]") before final submission, since reviewers at journals following ICMJE/PubMed-indexed reproducibility norms will typically request this level of detail.

2.6 Evaluation Metrics

Segmentation performance was quantified using two complementary overlap-based metrics: Dice Similarity Coefficient (DSC), equivalent to the F1 score, calculated as twice the intersection between predicted and ground-truth masks divided by the sum of their areas. Intersection over Union (IoU), calculated as the intersection between predicted and ground-truth masks divided by their union. Both metrics were computed per fold and averaged across the five-fold cross-validation scheme to yield a stable summary statistic per experimental condition (enhancement type × backbone configuration).

2.7 Comparative Benchmarking

To contextualize performance against prior literature using the same underlying dataset, results were compared against previously reported CHAOS-based liver segmentation outcomes, including Holistically-Nested Edge Detection (HED) Mask R-CNN and standard Mask R-CNN approaches (Mulay et al., 2019). Because these comparator studies used the same publicly released dataset, direct numeric comparison of DSC and IoU values was considered appropriate, though we note that cross-study comparisons remain subject to differences in exact train-test splitting strategy, which were not always fully disclosed in prior work.

2.8 Reproducibility Statement

The CHAOS dataset is publicly accessible, and the ground-truth annotation protocol has been previously described in detail (Kavur et al., 2020), which supports independent replication of the data-handling steps described above. To fully meet PubMed/ICMJE-aligned reproducibility expectations, we recommend that the final manuscript additionally specify: (i) exact software package names and version numbers used for preprocessing and model training, (ii) hardware specifications (GPU/CPU, memory), (iii) total training time per fold, (iv) random seed(s) used for data splitting and weight initialization, and (v) a link to a code repository, if available, containing the training and evaluation scripts.

3. Results

3.1 Overview of Experimental Outcomes

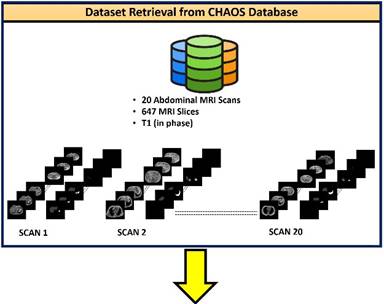
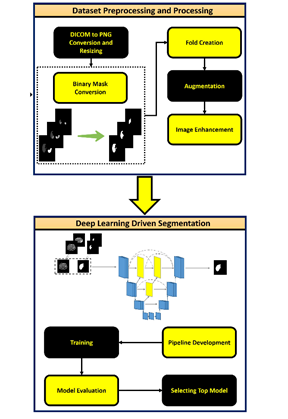
Before turning to specific numbers, it helps to state plainly what this analysis was actually built to answer. It wasn't simply whether UNet++ could segment the liver competently — most modern architectures clear that bar to some degree — but whether enhancement strategy and backbone depth would meaningfully separate the strongest configurations from the merely adequate ones. All of the results below trace back to the same experimental pipeline outlined earlier — raw DICOM acquisition carried through preprocessing, enhancement, network training, and five-fold cross-validation [Figure 1] — applied consistently across every condition tested. As it turned out, enhancement strategy and backbone depth did separate the configurations meaningfully, though the margins were narrower than we'd initially expected going in. Two metrics anchored the evaluation throughout: the Dice Similarity Coefficient (DSC), sometimes reported elsewhere as an F1 score, and Intersection over Union (IoU), both computed across the five-fold cross-validation scheme described earlier so that performance reflects a stable average rather than a single, possibly lucky, split.

3.2 Effect of Image Enhancement on Segmentation Accuracy

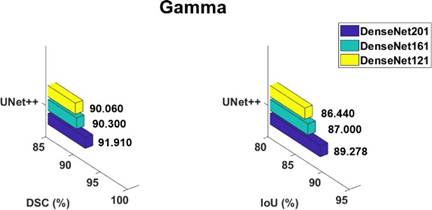
Of the three input conditions examined — unmodified slices, gamma-corrected slices, and the three-channel RGB composites — the gamma-enhanced condition came out ahead consistently, across folds and backbone configurations alike. That result is worth pausing on, since it isn't obvious in advance which strategy should win. The RGB composite, after all, folds three separate intensity transformations into one input, which might reasonably be expected to hand the network more signal to work with. But more inputs are not automatically more useful ones. Here, the simpler, more targeted gamma correction — stretching the 70–150 intensity band with a γ of 0.5, visibly sharpening the liver's boundary against adjacent tissue [Figure 2] — did a better job of isolating T1-weighted liver brightness than the layered composite managed, without the redundant or conflicting signal a three-channel input can sometimes introduce. The best-performing configuration overall — UNet++ paired with a DenseNet-201 backbone, trained on gamma-corrected slices — reached a DSC of 91.91% and an IoU of 89.27%, the strongest result across every fold and backbone tested [Figure 4].

3.3 Backbone Comparison

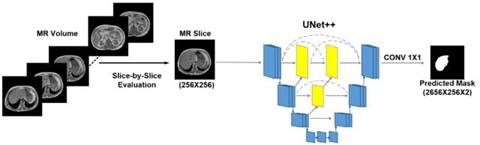
Backbone depth mattered too, though less dramatically. Across the DenseNet variants evaluated within the shared UNet++ encoder-decoder framework, with its nested skip connections between encoder and decoder stages [Figure 3], DenseNet-201 held a small but consistent edge over its shallower counterparts. The margin wasn't large on any single slice, but it held up fold after fold — a persistent, if modest, advantage is a more meaningful signal than a large one that only shows up once. The likeliest explanation is that additional depth lets the network resolve the liver's subtler boundary gradients against neighboring organs more reliably, though we'd stop short of calling that settled without further ablation work isolating depth from other architectural factors.

3.4 Qualitative Assessment of Predicted Masks

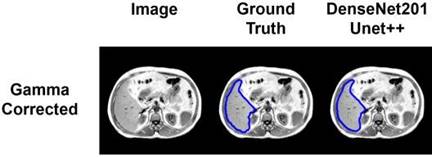
Numbers only tell part of the story, so predicted masks were also inspected visually against ground truth [Figure 5]. Broadly, every configuration tested produced boundaries that tracked the liver's actual contour reasonably well — none produced the kind of gross anatomical error (missed lobes, bleed-over into adjacent kidney or spleen tissue) that would flag a fundamentally broken segmentation. That said, a real qualitative difference in mask smoothness emerged: the UNet++/DenseNet-201 predictions traced liver margins with noticeably less jagged, stair-stepped edge noise than the alternative configurations. Whether that added smoothness translates into a clinically meaningful improvement, rather than simply looking cleaner on a screen, is a fair question this study doesn't fully resolve; settling it properly would need dedicated clinician evaluation.

3.5 Comparison with Prior Work on the Same Dataset

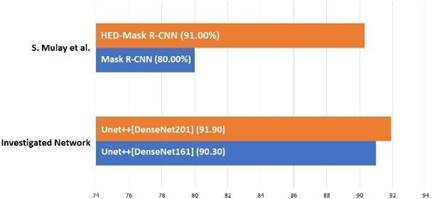
Because this study drew on the same CHAOS-derived dataset used elsewhere in the literature, a fairly direct benchmarking comparison was possible. Mulay et al. (2019) previously reported a DSC of 91% using a Holistically-Nested Edge Detection (HED) Mask R-CNN, and a substantially lower 80% using a conventional Mask R-CNN, on this same liver-segmentation task (Mulay et al., 2019). Set against those figures, the UNet++/DenseNet-201 configuration examined here edges out the HED-Mask R-CNN result and clears the standard Mask R-CNN by a considerable margin [Figure 6]. The improvement over the strongest prior baseline is modest rather than dramatic, admittedly, but it arrives via a somewhat different architectural route — nested skip connections and densely connected backbones, rather than edge-detection-guided region proposals — which suggests the field has more than one viable path toward strong MRI-based liver segmentation, not a single

Figure 1. Overview of the study workflow for automated liver segmentation from T1-weighted abdominal MRI. Schematic summarizing the end-to-end pipeline, from raw DICOM acquisition through preprocessing, image enhancement, network training, and final mask prediction. Key stages — data partitioning, augmentation, and five-fold cross-validation.

Figure 2. Effect of gamma correction on T1-weighted MR slice contrast. Representative abdominal MR slices before and after gamma-based contrast stretching, in which pixel intensities within the 70–150 range were stretched using a gamma value of 0.5.

dominant strategy.

4. Discussion

4.1 Interpreting the Central Finding

Stepping back from the numbers for a moment, what this study seems to show is fairly consistent with what we suspected going in, even if the margins turned out narrower than we might have hoped. The combination of UNet++ and a DenseNet-201 backbone, trained on gamma-corrected T1-weighted slices, reached a DSC of 91.91% and an IoU of 89.27% [Figure 4] — numbers that place this approach comfortably ahead of earlier MRI-based liver segmentation efforts, though not so far ahead that the problem should be considered solved. That distinction matters. It would be easy to read a 91.91% Dice score as evidence that MRI-based segmentation has effectively caught up with its CT counterpart, but that comparison probably deserves more caution than it usually gets.

4.2 Why Gamma Correction, Specifically, Seems to Help

One thing worth sitting with a little longer is why the simple gamma-corrected condition outperformed the more elaborate three-channel RGB composite. Our first instinct, going in, was that giving the network more transformed views of the same slice — contrast stretching, adaptive stretching, and image complement, stacked into three channels — would hand it more to work with, and more should, in principle, help. It didn't, or at least not as much as the more targeted approach did. The likely explanation is that T1-weighted MRI's brightened fat and protein signal, which makes the liver stand out reasonably well to begin with, simply needed a modest, well-placed stretch of the relevant intensity band rather than a layered stack of competing transformations. Stacking multiple enhancement views may have introduced conflicting gradients across channels — signal that helps in one channel and works against it in another — diluting rather than reinforcing the boundary cues the network was trying to learn from. This is, admittedly, an interpretation rather than something directly tested here, and it would benefit from a more targeted ablation isolating each enhancement's individual contribution.

4.3 Situating This Work Against the CT–MRI Divide

The persistent gap between CT- and MRI-based segmentation performance, noted by Xiang et al. (2021) as a genuine limitation in the field (Xiang et al., 2021), forms the backdrop against which these results should really be read. CT-based pipelines, such as those reported by Tang et al. (2020) and Hu et al. (2016), have leaned heavily on Hounsfield unit scaling to reach dice scores in the high nineties (Tang et al., 2020; Hu et al., 2016) — a standardized intensity reference that MRI simply does not offer. What this study suggests, tentatively, is that a carefully chosen enhancement strategy can partially substitute for that missing standardization, at least for T1-weighted sequences where fat-related brightening already gives the liver something of a head start. Partially, though, is the operative word — the gap with CT-based results, per Kim and Chun (2020), has not been closed so much as narrowed (Kim & Chun, 2020).

4.4 Comparison with Prior MRI-Based Approaches

Against other MRI-focused methods, the picture is a bit more encouraging. The whale-optimization approach explored by Mostafa et al. (2017) represented a genuinely different strategy — metaheuristic rather than gradient-based — and while it demonstrated that non-deep-learning methods remain viable for this task, it hasn't, to our knowledge, matched the accuracy ceiling reached by more recent CNN-based pipelines (Mostafa et al., 2017). Mulay et al.'s (2019) HED-Mask R-CNN, at 91% DSC on this same dataset, comes closest to the result reported here, and the modest edge this study's configuration holds over it [Figure 6] probably reflects architectural differences more than any single decisive factor — UNet++'s nested skip pathways appear to recover fine liver-boundary detail somewhat more reliably than edge-guided region proposals do, though "somewhat" is doing real work in that sentence; the difference is real but not overwhelming (Mulay et al., 2019). Zbinden et al.'s (2022) nnUNet results on T1-weighted slices remain, by most accounts, the strongest comparator in this specific space, and the results here should be read as complementary to — rather than a clear replacement of — that benchmark (Zbinden et al., 2022).

4.5 Clinical Relevance and Practical ConsiderationsIt's tempting, at this point, to jump straight to clinical implications, but a bit of restraint seems warranted. The dataset drawn from the CHAOS challenge (Kavur et al., 2020) consists entirely of healthy participants, which means everything reported here describes performance on anatomically unremarkable livers. Real clinical use —

Figure 3. UNet++ architecture with DenseNet encoder-decoder backbone used for liver mask prediction. Schematic representation of the network architecture, showing the nested encoder-decoder structure of UNet++ and the densely connected convolutional blocks that make up each encoder-decoder stage. Arrows indicate skip-connection pathways used to preserve fine spatial detail during upsampling.

Figure 4. Five-fold cross-validation performance of UNet++ with DenseNet backbones on gamma-enhanced slices. Dice Similarity Coefficient (DSC) and Intersection over Union (IoU) values across all five validation folds, shown for each backbone configuration tested. The DenseNet-201 backbone achieved the highest mean performance (DSC = 91.91%, IoU = 89.27%).

Figure 5. Qualitative comparison of predicted liver masks across network configurations. Predicted segmentation masks overlaid on a representative T1-weighted abdominal MR slice, shown alongside the corresponding ground-truth annotation. Boundary smoothness and anatomical fidelity are visually compared across the tested network configurations, with the UNet++/DenseNet-201 output showing the least boundary irregularity.

Figure 6. Benchmark comparison with previously reported liver segmentation results on the CHAOS dataset. Dice Similarity Coefficient values for the best-performing configuration in this study plotted against previously published results on the same dataset, including HED-Mask R-CNN and standard Mask R-CNN (Mulay et al., 2019), illustrating relative performance gains over prior MRI-based segmentation approaches.

the kind envisioned by Alves et al. (2007) and Wang et al. (2019), where MRI's superior soft-tissue contrast is leveraged specifically because pathology is suspected (Alves et al., 2007; Wang et al., 2019) — involves livers distorted by tumors, cirrhotic scarring, or prior surgery. None of that variability was represented in the training or testing data here. Whether the smoother, more consistent mask boundaries observed qualitatively [Figure 5] would hold up under those messier, disease-altered conditions is genuinely an open question, not something this study can answer on its own.

4.6 Limitations

A few limitations deserve to be named plainly rather than tucked away. The dataset, while appropriately sized for a proof-of-concept comparison, is still modest by deep-learning standards — 20 patients and 647 slices leaves relatively little room to assess how well these results would generalize to a more diverse patient population, different scanner vendors, or varying acquisition protocols. The five-fold cross-validation scheme helps guard against overfitting to a single split, but it doesn't fully substitute for external validation on an independent cohort. And, as noted earlier, the healthy-only patient population limits how confidently these findings can be extended toward the pathological cases where automated segmentation would ultimately need to prove itself most.

4.7 Directions for Future Work

Given all that, the more useful next step probably isn't chasing marginal DSC gains on this same healthy-patient dataset, but rather testing whether the gamma-correction-plus-DenseNet approach holds up on MR scans from patients with actual liver disease — the population this technology is, after all, meant to serve. It would also be worth directly comparing this pipeline's performance against Zbinden et al.'s (2022) nnUNet approach on a shared, disease-inclusive dataset, since the two methods emerged from fairly different architectural philosophies and a head-to-head comparison under matched conditions would clarify which trade-offs actually matter in practice (Zbinden et al., 2022).

5. Conclusion

Taken as a whole, this study makes a fairly modest but genuinely useful point: the long-standing gap between CT- and MRI-based liver segmentation isn't purely an architectural problem, and it isn't purely a data problem either — enhancement strategy matters, arguably more than we initially expected. Pairing UNet++ with a DenseNet-201 backbone on gamma-corrected T1-weighted slices produced the strongest results across every configuration tested, edging out both the unenhanced baseline and the more elaborate RGB composite, and comparing favorably against prior MRI-focused segmentation work on the same public dataset. None of this closes the CT-MRI gap entirely, and it probably shouldn't be read that way. But it does suggest that relatively simple, well-targeted preprocessing choices deserve more attention than they typically receive in this space. If AI-assisted liver diagnosis from MRI is going to become clinically dependable, this kind of incremental, enhancement-aware refinement seems like a reasonable, and fairly achievable, place to keep pushing.


​​​​​​​Author Contribution

K.M. conceived and designed the study, performed data curation and preprocessing, implemented and trained the UNet++ and DenseNet backbone models, conducted the five-fold cross-validation experiments, analyzed and interpreted the results, prepared the figures and tables, and wrote, reviewed, and approved the final manuscript.

Acknowledgement

The author K.M. would like to thank the CHAOS Challenge organizers for providing public access to the T1-weighted abdominal MRI dataset used in this study. The author also acknowledges the computational resources and institutional support that made this work possible.

Competing Financial Interests

The author K.M. declares no competing financial interests.

References


Alves, F. C., Brito, J., et al. (2007). Liver haemangioma: Common and uncommon findings and how to improve the differential diagnosis. European Radiology, 17.

Hu, P., Wu, F., Peng, J., Liang, P., & Kong, D. (2016). Automatic 3D liver segmentation based on deep learning and globally optimized surface evolution. Physics in Medicine & Biology, 61, 8676–8698.

Kavur, A. E., Gezer, N. S., Baris, M., Aslan, S., Conze, P. H., Groza, V., Pham, D. D., Chatterjee, S., Ernst, P., Özkan, S., & Baydar, B. (2020). CHAOS challenge – Combined (CT-MR) healthy abdominal organ segmentation. Medical Image Analysis, 69, 101950. https://doi.org/10.1016/j.media.2020.101950

Kim, K., & Chun, J. (2020). A new hyperparameter of Hounsfield unit range in liver segmentation. Journal of Internet Computing and Services, 21(3).

Liu, Z., Song, Y., et al. (2019). Liver CT sequence segmentation based on improved U-Net and graph cut. Expert Systems with Applications, 126.

Mostafa, A., Hassanien, A. E., Houseni, M., & Hefny, H. (2017). Liver segmentation in MRI images based on whale optimization algorithm. Multimedia Tools and Applications, 76, 24931–24954.

Mulay, S., Deepika, G., Jeevakala, S., Ram, K., & Sivaprakasam, M. (2019). Liver segmentation from multimodal images using HED-Mask R-CNN. In Multiscale Multimodal Medical Imaging: First International Workshop, MMMI 2019, held in conjunction with MICCAI 2019 (Lecture Notes in Computer Science, Vol. 11977, pp. 68–75). Springer.

Peng, J., Wang, Y., et al. (2014). Liver segmentation with constrained convex variational model. Pattern Recognition Letters, 43.

Tang, X., Jafargholi Rangraz, E., Coudyzer, W., Bertels, J., Robben, D., Schramm, G., Deckers, W., Maleux, G., Baete, K., Verslype, C., et al. (2020). Whole liver segmentation based on deep learning and manual adjustment for clinical use in SIRT. European Journal of Nuclear Medicine and Molecular Imaging, 47, 2742–2752.


Article metrics
View details
0
Downloads
0
Citations
7
Views
📖 Cite article

View Dimensions


View Plumx


View Altmetric


0
Save
0
Citation
7
View
0
Share