Data Modeling

Mathematical and Computational Data Modeling
0
Citations
4.5k
Views
29
Articles
Your new experience awaits. Try the new design now and help us make it even better
Switch to the new experience
Figures and Tables
RESEARCH ARTICLE   (Open Access)

A Multimodal Smartwatch Framework for Early Parkinson's Disease Detection: Preliminary Gait-Based Evidence Toward an Ensemble Approach

Md. Mahfujul Islam 1*, Khondaker Abdullah Al Mamun 2

+ Author Affiliations

Data Modeling 2 (1) 1-11 https://doi.org/10.25163/data.2110808

Submitted: 22 June 2021 Revised: 12 August 2021  Published: 25 August 2021 


Abstract

Parkinson's disease (PD) is typically diagnosed only after substantial dopaminergic neuron loss has already occurred, by which point motor symptoms — tremor, rigidity, bradykinesia — are well established. Earlier detection, even by a modest margin, could meaningfully change how the disease is managed, opening a window for interventions that work best before extensive neurodegeneration sets in. This work proposes a wearable framework that draws on three signal types from a single wrist-worn smartwatch — motor fluctuations, gait dynamics, and voice — with the intention of combining them through an ensemble, majority-voting classifier. Each component builds on previously validated approaches to PD-related sensing. The present analysis focuses largely on the gait component, comparing four conventional regression models (linear regression, Gaussian process regression, support vector regression, and regression trees) against two neural network architectures (CNN, LSTM) in estimating step length, swing time, and stance time from wrist-mounted sensor data. Gaussian process regression performed most consistently, achieving the lowest error across all three parameters, while the regression tree model lagged noticeably behind. Neural network models, working from raw rather than engineered features, underperformed relative to GPR — though this likely reflects dataset size as much as architectural limitations. Taken together, the results offer cautious support for wrist-worn gait sensing as a feasible, low-burden monitoring approach, while the motor fluctuation and voice components, and the ensemble that would unite all three, remain to be empirically validated in future work.

Keywords: Parkinson's disease; wearable sensors; smartwatch; gait analysis; ensemble machine learning

1. Introduction

Parkinson's disease rarely announces itself all at once. It tends to arrive in small, easily dismissed ways — a hand that trembles slightly while resting, handwriting that gets a little smaller, a step that doesn't quite swing the way it used to. By the time these signs are obvious enough to bring someone into a clinic, the underlying neurodegeneration has often been progressing for years. This is, in some sense, the central frustration of Parkinson's disease (PD) care: the disease is defined clinically by motor symptoms, yet those symptoms are late arrivals, not early warnings.

PD is a progressive neurological disorder marked by tremor, rigidity, bradykinesia, and postural instability (Singh, Pillay, & Choonara, 2007), and its symptoms typically worsen gradually rather than appearing in full force. Diagnosis, as it stands, leans almost entirely on these motor signs — which is part of the problem. Motor symptoms generally don't surface until a substantial portion of dopaminergic neurons in the substantia nigra has already been lost (Sharma et al., 2013). So, in practice, many people live with PD for some time before anyone — including the person experiencing it — recognizes what's happening.

Why does earlier detection matter so much? A few reasons, and they compound. First, there's the treatment angle: neuroprotective interventions, where they exist or are being trialed, tend to work best before extensive neuronal loss has occurred (Singh et al., 2007) — so timing matters enormously. Second, an earlier diagnosis gives patients room to make lifestyle adjustments (diet, exercise, and so on) that may help slow symptom progression, even modestly. And third, earlier detection gives clinicians a longer runway to track how the disease is unfolding in a given patient and adjust treatment accordingly, rather than reacting to a disease that's already well established. Efforts using predictive modelling combined with patient questionnaires, as well as broader multimodal feature sets, have already demonstrated the feasibility of identifying PD at an early, pre-clinical stage (Prashanth & Roy, 2018; Prashanth, Roy, Mandal, & Ghosh, 2016).

None of this is news to the research community, of course. Over the past decade or so, a fairly broad effort has emerged around finding more reliable early markers for PD — some of it biological, some of it computational. On the biological side, attention has gone toward biomarkers such as genetic variants, alpha-synuclein levels, neuroimaging signatures from dopamine transporter studies, and cerebrospinal fluid composition (Sharma et al., 2013). Imaging techniques like PET and SPECT have also proven useful for visualizing the kinds of degenerative changes associated with PD, sometimes before motor symptoms become pronounced. And clinically, tools like the Unified Parkinson's Disease Rating Scale (UPDRS) remain the standard for tracking motor symptom severity, even as researchers increasingly look toward non-motor signs — sleep disturbances, loss of smell (Silveira-Moriyama et al., 2009), subtle cognitive shifts, and autonomic changes such as altered cardiovascular oscillations (Valenza et al., 2016) — as potentially earlier indicators.

What's changed more recently, though, is the role of machine learning. Rather than waiting for a single definitive biomarker, researchers have started asking whether combinations of data — clinical records, imaging, sensor data, even voice recordings — might collectively reveal patterns that no single measure would show on its own. Voice and speech analysis has been a particularly active area: dysphonia measures have been shown to be suitable for telemonitoring PD progression (Little, McSharry, Hunter, Spielman, & Ramig, 2009; Tsanas, Little, McSharry, & Ramig, 2010), and numerous classification approaches have been built on top of these signals, including support vector machines applied to ranked voice features (Lahmiri & Shmuel, 2019), deep learning models trained on vocal feature sets (Gunduz, 2019), acoustic analyses of speech (Braga, Madureira, Coelho, & Abraham, 2019), and small, curated sets of vocal features used as a pre-diagnosis screening tool (Solana-Lavalle, Galán-Hernández, & Rosas-Romero, 2020). Practical concerns around real-world deployment — such as the reliability of pitch-detection algorithms across noise conditions when speech is captured on a smartphone — have also been examined (Illner, Sovka, & Rusz, 2020).

Gait has formed a second major strand of this work: hybrid spatio-temporal models have been used to both detect PD and rate its severity from gait data (Zhao, Qi, Li, Dong, & Yu, 2018), and deep one-dimensional convolutional networks have been applied to the same task with strong results (El Maachi, Bilodeau, & Bouachir, 2020). Handwriting represents a third, with decision-support frameworks built around novel handwriting markers (Drotár et al., 2015), kinematic and pressure-based analyses used for differential diagnosis (Drotár et al., 2016), and sex-specific, age-adjusted classification models derived from handwriting measurements (Gupta, Bansal, & Joshi, 2020).

Mobile health technologies have played a notable part in this shift. Mobile applications have already been explored for PD diagnosis and ongoing monitoring (Mamun et al., 2017), touchscreen typing dynamics have been used to detect motor impairment via everyday smartphone use (Arroyo-Gallego et al., 2017), wavelet-based methods have been proposed for monitoring symptoms through wearable sensors (Wagner, Fixler, & Resheff, 2017), and long short-term memory networks have been applied to patient-specific detection of freezing of gait (Ashour, El-Attar, Dey, El-Kader, & Abd El-Naby, 2020). More broadly, large-scale predictive analytics frameworks have shown how heterogeneous, multi-source PD data can be combined (Dinov et al., 2016), comparative studies have benchmarked multiple classification algorithms for PD diagnosis (Das, 2010), and methodological advances in feature extraction for related neurodegenerative conditions such as ALS (Bilgin, 2017), as well as in statistical, data-driven monitoring more generally (Harrou, Sun, Hering, & Madakyaru, 2020), have helped shape how such models are designed and validated. And more broadly, sensor-based approaches have gathered momentum as a way of capturing real-world, longitudinal data about how the disease behaves outside the clinic. The practical obstacle, though, is that many of these systems require multiple dedicated devices, which limits how realistically they can be used day-to-day. Consumer smartwatches — with their built-in triaxial accelerometers — offer a more accessible alternative, and multitask classification models have been proposed specifically to assess the magnitude and consistency of resting tremor using this kind of off-the-shelf hardware (Sigcha et al., 2021).

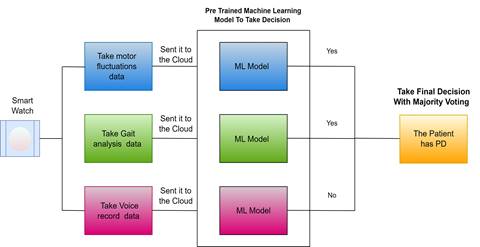
It's this last thread — accessible, wearable, continuously-collected data — that motivates the present work. Rather than relying on a single signal type, we set out to build a model that draws on three complementary streams from a single smartwatch: motor fluctuations, gait characteristics, and voice recordings. Each of these has, individually, shown some promise for PD-related signal detection in prior work; what's less explored is how they might work together. The data from all three sensors is sent to the cloud, where a pretrained machine learning model evaluates it, and an ensemble approach combines the outputs of the three modalities through majority voting to arrive at a final decision. The sections that follow describe the reasoning behind each component, the methods used, and what the preliminary results suggest — along with, candidly, what they don't yet show.
2. Materials and Methods

2.1 Study Design and Overview

This study proposes and describes a multimodal, wearable-based framework for the early detection of Parkinson's disease (PD), integrating three independent sensing modalities — motor fluctuation monitoring, gait analysis, and voice-based acoustic analysis — acquired from a single wrist-worn smartwatch. Each modality is processed by a dedicated, pretrained classification or regression model, and the three outputs are combined through a majority-voting ensemble to yield a final PD/non-PD classification. The architecture and component models build directly on previously validated approaches (Mamun et al., 2017.; Sajal et al., 2020 "UPDRS Label Assignment"; Sajal et al., 2020 "Early detection of Parkinson's disease"), and this section specifies the design choices, parameters, and validation procedures required for independent replication, following recommendations for reporting of digital health and machine learning studies (e.g., TRIPOD-AI and STARD principles for diagnostic prediction models).

Participants and Data Sources

The motor fluctuation component draws on data from a longitudinal cohort comprising PD patients and 171 age-matched older adults without PD, recruited for the development of the Motor Fluctuations Monitor for Parkinson's Disease (MM4PD) (Mamun et al., 2017). Participants in the control cohort underwent a baseline physical examination and medical history review conducted by a registered nurse prior to enrollment. The gait analysis component is based on a cohort of 26 healthy volunteers aged 23–58 years, recruited in a hospital setting (Sajal et al., 2020 "UPDRS Label Assignment"). The voice analysis component draws on acoustic recordings from people with PD and healthy controls, originally collected for telemedicine-based screening (Sajal et al., 2020 "Early detection of Parkinson's disease"). For any prospective validation of the integrated framework, a new cohort should be recruited with explicit inclusion criteria (clinically confirmed PD diagnosis per UK Brain Bank or MDS criteria, age- and sex-matched controls, absence of comorbid neurological conditions affecting gait or speech), exclusion criteria, and a target sample size justified by a priori power calculation for the primary outcome (sensitivity/specificity of the ensemble classifier).

2.2 Device and Sensor Specifications

Data acquisition for the motor fluctuation and gait modalities is based on a consumer smartwatch platform (Apple Watch, Series 2 or later), using the integrated triaxial accelerometer and gyroscope sampled at 100 Hz. For studies replicating this pipeline, the following should be reported and held constant across participants: device model and operating system version, wrist of placement (dominant vs. non-dominant), sampling frequency, and any on-device preprocessing (e.g., built-in motion classification or pedometer outputs) used as auxiliary inputs. Voice data acquisition requires a specified microphone (device-integrated or external), sampling rate (minimum 22.05 kHz recommended for standard acoustic feature extraction such as jitter and shimmer), recording duration per task, and ambient noise conditions.

2.3 Motor Fluctuation Monitoring

The motor fluctuation algorithm follows the two-stage MM4PD design (Mamun et al., 2017). In Stage 1, raw triaxial accelerometer and gyroscope signals are transformed into estimates of resting tremor and choreiform dyskinesia. Resting tremor is estimated using a 2.56-second sliding window, with spectral power concentrated in the 3–7 Hz band used as the primary tremor indicator; periods with low signal-to-noise ratio or concurrent voluntary movement are labeled "unknown" rather than forced into a binary classification, to avoid false-positive tremor detection during active tasks. In Stage 2, algorithm outputs are validated against (a) in-clinic MDS-UPDRS ratings obtained during a controlled pilot assessment, (b) one week of free-living, all-day device use to assess robustness during routine activity, and (c) a multi-month longitudinal deployment designed to capture symptom fluctuations associated with medication timing. For reproducibility, the following parameters must be fixed and reported: window length and overlap, frequency band(s) defining tremor and dyskinesia, the SNR threshold for "unknown" labeling, and the specific classifier or regression model (and its hyperparameters) used to map spectral features to tremor/dyskinesia severity scores.

2.4 Gait Analysis

Gait features are extracted following the wrist-worn smartwatch protocol described by Sajal et al. (2020) "UPDRS Label Assignment"). Three spatiotemporal gait parameters are targeted: step length (cm), swing time (s), and stance time (s). Ground truth for model training and validation is obtained from a reference system comprising an instrumented walkway and camera-based motion capture, synchronized with smartwatch data collected during a clinician-supervised gait assessment. Four regression models are evaluated — linear regression (LR), Gaussian process regression (GPR), support vector regression (SVM), and regression trees (RT) — alongside two neural network architectures (CNN and LSTM) trained on raw sensor sequences rather than engineered features. Model performance is assessed via root-mean-square error (RMSE) using 5-fold cross-validation, with the dataset randomly partitioned and the procedure repeated to obtain stable average estimates. For replication, the exact feature set provided to the ML models (versus raw input to the NN models), the cross-validation fold assignment procedure, and all model hyperparameters (e.g., GPR kernel choice and length-scale priors, SVM kernel and regularization parameter, LSTM hidden units and sequence length) must be specified. Given the wrist-mounted (rather than foot- or shank-mounted) sensor placement — a deviation from most clinical gait analysis protocols — inter-subject variability in arm-swing kinematics should be reported as a potential source of error variance.

2.5 Voice and Acoustic Analysis

Acoustic data are processed following the telemedicine-based approach of Sajal et al. (2020) "Early detection of Parkinson's disease"), using features derived from sustained vowel phonation (e.g., jitter, shimmer, harmonic-to-noise ratio, and related MDVP-derived measures). Four classifiers are evaluated: Support Vector Machine, Random Forest, K-Nearest Neighbors, and Logistic Regression. For reproducibility, the complete acoustic feature extraction pipeline (software/library and version, e.g., Praat or openSMILE), the specific feature subset used for classification, the train/test split or cross-validation scheme, and all classifier hyperparameters (e.g., number of trees and maximum depth for Random Forest, value of k for KNN) must be reported, along with class balance (PD vs. control) in the training data.

2.6 Ensemble Decision Framework

The three modality-specific models — motor fluctuation classifier, gait-based regressor(s) thresholded into a PD-risk indicator, and voice classifier — each produce an independent binary or probabilistic output regarding PD status. These outputs are combined via majority voting to generate the final classification. For full specification, the following must be defined: (1) how continuous gait regression outputs are converted into a binary PD-risk label (e.g., a clinically derived threshold on predicted step length/swing time deviation from age-matched norms); (2) the tie-breaking rule in the event of a 1.5/1.5 or otherwise ambiguous vote (not applicable with three binary voters, but relevant if probabilistic weighting is introduced); (3) how "unknown" tremor labels from the motor fluctuation module are treated within the vote (excluded, imputed, or treated as a non-vote); and (4) whether votes are weighted equally or by each modality's individual validation performance.

2.7 Statistical Analysis and Validation

Model performance for the gait component is reported using RMSE across the three spatiotemporal parameters, with comparisons across LR, GPR, SVM, RT, CNN, and LSTM models. For the integrated ensemble, performance should be reported using standard diagnostic accuracy metrics — sensitivity, specificity, positive and negative predictive value, area under the receiver operating characteristic curve (AUC), and overall classification accuracy — with 95% confidence intervals derived from bootstrap resampling (minimum 1,000 iterations) or repeated cross-validation. To address identity confounding — whereby data from the same individual appears in both training and test sets — a leave-one-subject-out or group k-fold cross-validation scheme is recommended, ensuring no overlap of individual participants between training and evaluation partitions.

2.8 Ethical Considerations and Data Availability

Any prospective data collection involving human participants requires approval from an appropriate institutional review board or ethics committee, with the approval number reported in the manuscript, alongside documentation of informed consent procedures. Following best practices for reproducible digital health research, raw sensor data (or a de-identified subset), feature extraction code, model training scripts, and trained model weights should be deposited in a public repository (e.g., OSF, Zenodo, or an institutional data repository) with a persistent identifier (DOI), subject to data-sharing agreements appropriate for clinical data.

3. Results

3.1 Overview of Evaluation Approach

Before getting into the numbers, it's worth being honest about what these results actually represent at this stage. The motor fluctuation and voice components of the proposed framework rely on previously validated models (Mamun et al., 2017; Sajal et al., 2020 "Early detection of Parkinson's disease"), and the results presented here focus primarily on the gait analysis component — the one piece of the pipeline for which a direct model comparison was carried out. So what follows is, in a sense, a partial picture: a closer look at how different machine learning approaches perform when asked to estimate gait parameters from wrist-worn sensor data, which is the foundation the ensemble's gait-derived vote would ultimately rest on.

3.2 Motor Fluctuation Data Sources

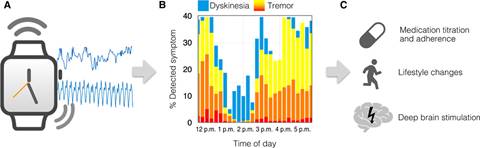
Two control datasets were used to characterize the motor fluctuation algorithm's behavior. The first was a longitudinal cohort of older adults without Parkinson's disease, each of whom underwent a baseline physical examination and medical history review with a registered nurse before continuous monitoring began. The second came from a separate, engineering-oriented study — younger, healthy volunteers going about a fairly ordinary set of all-day activities (playing instruments, driving, that sort of thing), which served as a way of stress-testing the tremor and dyskinesia algorithms against everyday movement rather than controlled clinical tasks. Both datasets drew on accelerometer and gyroscope readings from an Apple Watch (Series 2 or later) sampled at 100 Hz, with resting tremor estimated in 2.56-second windows over the 3–7 Hz band — a window size chosen, as in the original MM4PD work, to balance signal-to-noise considerations against the need to catch short, intermittent tremor episodes (Mamun et al., 2017) [Fig. 1]. Periods of low signal quality, or where the wearer was actively moving, were flagged as "unknown" rather than forced into a tremor/no-tremor label — a conservative choice, and arguably the right one, even if it does mean some data simply doesn't contribute to the final picture.

3.3 Gait Parameter Estimation

This is where things get more concrete. Four conventional regression approaches — linear regression (LR), Gaussian process regression (GPR), support vector regression (SVM), and regression trees (RT) — were compared on their ability to recover three gait parameters (step length, swing time, and stance time) from wrist-worn sensor data, using 5-fold cross-validation despite the relatively modest dataset size (Table 1).

Across all three parameters, GPR came out ahead — not by a dramatic margin, but consistently. For step length specifically, GPR achieved an RMSE of 5.29 cm, meaning that, on average, predictions were off by a bit over five centimeters relative to ground truth. SVM trailed close behind at 5.46 cm, and LR wasn't far off either at 5.68 cm. The regression tree model, on the other hand, lagged noticeably — 6.58 cm — and this pattern held for the other two parameters as well, with RT producing the highest error in every case. It's tempting to read too much into small differences like 5.29 versus 5.46, and maybe that caution is warranted; but the gap to RT was large enough, and consistent enough across all three metrics, that it does seem to reflect something real about how poorly a simple tree-based model handles this kind of continuous, noisy sensor data.

Swing time and stance time followed broadly the same ranking, with GPR again producing the lowest RMSE — 4.89×10⁻² s for swing time and 8.78×10⁻² s for stance time. One pattern that did stand out: the relative error for swing time was consistently lower than for stance time across every model tested, which suggests — tentatively — that a wrist-worn device may simply be better suited to capturing the dynamics of swing phase than stance phase. That's not entirely surprising, perhaps, given that swing involves more pronounced arm movement, which a wrist sensor is naturally well-positioned to pick up.

3.4 Neural Network Models

The two neural network architectures — CNN and LSTM — were also evaluated, trained directly on raw sensor sequences rather than the hand-selected feature sets used for the ML models [Table II]. Here, the results were less encouraging. Both CNN and LSTM produced higher RMSE values than GPR across the board — CNN reached 7.25 cm for step length, and LSTM 6.87 cm, both noticeably worse than GPR's 5.29 cm (Table 2). For swing and stance time, the pattern was similar, though LSTM's stance time error (5.16×10⁻² s) was something of an outlier — lower than its own swing time error, and lower than CNN's stance time result, in a way that doesn't entirely fit the broader trend. Whether that's a meaningful finding or just noise from a small dataset is genuinely hard to say at this point.

It's worth noting, too, that this isn't really a fair fight in some respects. The ML models had the benefit of a curated feature set; the neural networks were working from raw data, which is both an advantage (less preprocessing) and a disadvantage (more for the model to learn, with relatively little data to learn from). Neural networks are, notoriously, data-hungry — and the dataset here, drawn from a modest pool of participants, likely wasn't large enough to let CNN or LSTM show what they're capable of under better conditions.

3.5 A Note on Identity Confounding

One issue surfaced during this exploratory work that deserves mention here rather than being left entirely to the discussion: identity confounding, where the same individuals contribute data to both training and test sets due to repeated tasks. This is a subtle problem — a model can end up learning something about who a person is, rather than the gait pattern itself, which inflates apparent performance in ways that wouldn't hold up in a genuinely unseen population. It wasn't fully resolved in the analyses presented here, and that's a limitation worth sitting with rather than glossing over.


4. Discussion

4.1 Making Sense of the Gait Findings

So, what do we actually take away from the gait results? The headline finding — that Gaussian process regression outperformed the alternatives across all three spatiotemporal parameters— is fairly clear-cut on its face. But the more interesting question, maybe, is why. GPR's advantage over linear regression isn't huge, and it's tempting to wonder whether a slightly different feature set, or a slightly larger dataset, might have closed that gap or even reversed it. What does seem more robust is the gap between GPR/SVM/LR as a cluster and the regression tree model, which consistently brought up the rear. Tree-based models tend to struggle with smooth, continuous relationships unless given a lot of data to carve up into fine-grained splits — and with a dataset this size, that limitation probably shows up exactly as it did here.

The neural network results (Table 2) are, frankly, a bit harder to interpret cleanly. Both CNN and LSTM underperformed GPR by a noticeable margin, and on the surface that might look like "deep learning doesn't work for this problem." But that's almost certainly too strong a conclusion. Most neural network architectures are designed with the assumption that there's enough data to let the network discover useful representations on its own — and here, the networks were working from raw sensor sequences without the benefit of the curated features that

Table 1. Performance of conventional machine learning regression models for estimating gait parameters from wrist-worn smartwatch sensor data. Step length (cm), swing time (s), and stance time (s) were estimated from triaxial accelerometer data collected during a clinician-supervised gait assessment (n = 26 healthy volunteers, ages 23–58), using an instrumented walkway and camera-based motion capture system as ground truth. Model performance was evaluated using root-mean-square error (RMSE) under 5-fold cross-validation. LR, linear regression; GPR, Gaussian process regression; SVM, support vector regression; RT, regression tree.

Model

Step (cm)

Swing (sec)

Stance (sec)

LR

5.68

5.02×10²

9.33×10²

GPR

5.29

4.89×10²

8.78×10²

SVM

5.46

5.11×10²

9.18×10²

RT

6.58

5.56×10²

10.69×10²

Table 2. Results of NN Models Depending on RMSE Value for Estimating Step Length (cm), Swing Time (sec), and Stance Time (sec)

Model

Step (cm)

Swing (sec)

Stance (sec)

CNN

7.25

7.34×10²

11.5×10²

LSTM

6.87

6.56×10²

5.16×10²

Fig. 1. Schematic overview of the Motor Fluctuations Monitor for Parkinson's Disease (MM4PD) pipeline, illustrating the two-stage process by which raw triaxial accelerometer and gyroscope data from a wrist-worn device are transformed into estimates of resting tremor and choreiform dyskinesia, and subsequently validated against clinical MDS-UPDRS assessments and longitudinal symptom data.

the ML models had access to. So the comparison isn't really "GPR vs. CNN" in some abstract sense; it's more "a small feature-engineered dataset vs. a small raw-data problem," and the former happens to play to GPR's strengths. Whether CNN or LSTM would close the gap — or overtake GPR entirely — with a substantially larger cohort is, honestly, an open question that this study can't answer.

4.2 The Wrist Placement Problem

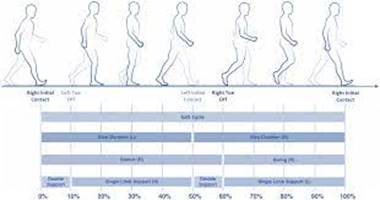
One thing that probably deserves more attention than it's gotten so far is sensor placement. Most established gait analysis protocols rely on sensors positioned at the foot or lower leg, for reasons that make intuitive sense — that's where the phases of the gait cycle (stance, swing, heel strike, toe-off) are most directly and unambiguously expressed [Fig. 2]. A wrist-worn device, by contrast, is capturing something one step removed: arm swing, which is correlated with gait phase but not the same thing, and which varies a fair amount from person to person depending on how naturally someone swings their arms while walking.

This isn't necessarily a fatal flaw — the results here suggest a wrist-worn device can produce reasonably useful estimates, with RMSE values in the range of a few centimeters for step length. But it does mean that some of the error observed, particularly the somewhat larger stance time errors relative to swing time, might be at least partly explained by this indirect relationship rather than purely by model choice. It would be worth exploring, in future work, whether combining wrist data with even minimal additional sensing — say, from a phone in a pocket — could meaningfully tighten these estimates (Sajal et al., 2020 "UPDRS Label Assignment").

4.3 Identity Confounding — A Problem Worth Sitting With

The identity confounding issue raised earlier deserves a bit more space here, because it's not a minor footnote — it cuts to the heart of how trustworthy these performance numbers really are. If the same individuals show up in both training and test partitions, even indirectly through repeated tasks, a model can start to learn person-specific quirks — a particular gait rhythm, a particular way of holding the wrist — rather than the general relationship between sensor data and gait parameters that we actually care about. And that's a problem, because the whole point of a diagnostic tool is that it needs to work on people it's never seen before.

The honest answer here is that this study doesn't fully resolve this. What seems like a sensible path forward — and one the original framing gestures toward — is a two-model approach: one model trained across many individuals, deliberately excluding any data from the person being evaluated, to handle initial detection; and a separate, person-specific model that does use an individual's own historical data, but for tracking symptom progression over time rather than diagnosis. These are genuinely different tasks, even if they look superficially similar, and conflating them risks overstating what either model can do.

4.4 Where the Three Modalities Stand — and Where They Don't Yet Meet

It's worth stepping back, too, and acknowledging something about the overall framework that the results section couldn't really address: the motor fluctuation and voice components, while grounded in validated prior work (Mamun et al., 2017; Sajal et al., 2020 "Early detection of Parkinson's disease"), we weren't evaluated here in the same head-to-head way the gait models were (Fig. 3). The ensemble — the part of the proposal that combines all three streams via majority voting — remains, at this stage, more of an architectural proposal than a tested system (Fig. 4). That's not necessarily a problem in itself; plenty of useful frameworks start this way. But it does mean that claims about the ensemble's accuracy or its advantage over single-modality approaches are, for now, aspirational rather than demonstrated — and that gap is probably the single most important thing for future work to close.

4.5 A Few Practical Implications, Held Loosely

If the gait results hold up under a larger sample, there's a reasonably encouraging story here: a single, unobtrusive, wrist-worn device might be able to provide gait estimates accurate to within a few centimeters — not clinical-grade, perhaps, but potentially useful for longitudinal, at-home monitoring where the alternative is no monitoring at all. That's particularly relevant in contexts where access to specialist neurological care is limited, a theme that runs through much of the broader literature this work draws on (Mamun et al., 2017). Whether that promise translates into something clinically actionable, though, depends a great deal on the open questions raised here — sample size, sensor placement, identity confounding, and the still-untested integration of the three modalities into a working

Figure 2. Schematic representation of the human gait cycle, illustrating the stance and swing phases and the spatiotemporal parameters (step length, stance time, swing time) targeted for estimation in the present analysis. 

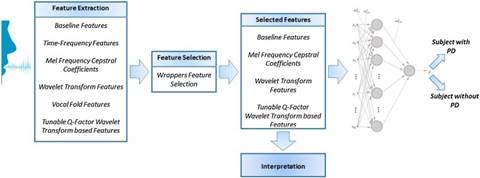
Figure 3. Conceptual workflow for voice-based Parkinson's disease detection, depicting the extraction of acoustic features (e.g., jitter, shimmer, harmonic-to-noise ratio) from sustained vowel phonation recordings and their classification using conventional machine learning models (SVM, Random Forest, K-Nearest Neighbors, Logistic Regression).

Figure 4. Proposed multimodal ensemble architecture for early Parkinson's disease detection, integrating motor fluctuation, gait, and voice data streams acquired from a single wrist-worn smartwatch. 

ensemble.

5. Conclusion

Early detection of Parkinson's disease remains, in many respects, an unmet need — one where small gains in timing could translate into meaningfully better outcomes for patients. This study took a modest but concrete step in that direction, focusing primarily on whether a wrist-worn smartwatch can reasonably estimate gait parameters relevant to PD monitoring. The answer, tentatively, is yes — Gaussian process regression in particular performed well, though not without caveats around sample size, sensor placement, and identity confounding that future work will need to address more carefully. The broader vision — a three-modality ensemble combining motor, gait, and voice signals — remains promising on conceptual grounds, but is not yet demonstrated here. What this work offers, then, is less a finished system and more a foundation: evidence that one piece of the puzzle holds up reasonably well, and a clearer sense of what still needs testing before the full framework can be evaluated as a whole.


References


Arroyo-Gallego, T., Ledesma-Carbayo, M. J., Sanchez-Ferro, A., Butterworth, I., Mendoza, C. S., Matarazzo, M., Montero, P., Lopez-Blanco, R., Puertas-Martin, V., Trincado, R., & Giancardo, L. (2017). Detection of motor impairment in Parkinson’s disease via mobile touchscreen typing. IEEE Transactions on Biomedical Engineering, 64(9), 1994–2002. https://doi.org/10.1109/TBME.2016.2612662

Ashour, A. S., El-Attar, A., Dey, N., El-Kader, H. A., & Abd El-Naby, M. M. (2020). Long short-term memory based patient-dependent model for FOG detection in Parkinson’s disease. Pattern Recognition Letters, 131, 23–29. https://doi.org/10.1016/j.patrec.2019.11.005

Bilgin, S. (2017). The impact of feature extraction for the classification of amyotrophic lateral sclerosis among neurodegenerative diseases and healthy subjects. Biomedical Signal Processing and Control, 31, 288–294. https://doi.org/10.1016/j.bspc.2016.08.015        

Braga, D., Madureira, A. M., Coelho, L., & Abraham, A. (2019). Automatic detection of Parkinson’s disease based on acoustic analysis of speech. Engineering Applications of Artificial Intelligence, 77, 148–158. https://doi.org/10.1016/j.engappai.2018.09.007               

Das, R. (2010). A comparison of multiple classification methods for diagnosis of Parkinson disease. Expert Systems with Applications, 37(2), 1568–1572. https://doi.org/10.1016/j.eswa.2009.06.040   

Dinov, I. D., Heavner, B., Tang, M., Glusman, G., Chard, K., Darcy, M., Madduri, R., Pa, J., Spino, C., Kesselman, C., Foster, I., Deutsch, E. W., Price, N. D., Van Horn, J. D., Ames, J., Clark, K., Hood, L., Hampstead, B. M., Dauer, W., & Toga, A. W. (2016). Predictive big data analytics: A study of Parkinson’s disease using large, complex, heterogeneous, incongruent, multi-source and incomplete observations. PLoS ONE, 11(8), e0157077. https://doi.org/10.1371/journal.pone.0157077

Drotár, P., Mekyska, J., Rektorová, I., Masarová, L., Smékal, Z., & Faundez-Zanuy, M. (2015). Decision support framework for Parkinson’s disease based on novel handwriting markers. IEEE Transactions on Neural Systems and Rehabilitation Engineering, 23(3), 508–516. https://doi.org/10.1109/TNSRE.2014.2327298

Drotár, P., Mekyska, J., Rektorová, I., Masarová, L., Smékal, Z., & Faundez-Zanuy, M. (2016). Evaluation of handwriting kinematics and pressure for differential diagnosis of Parkinson’s disease. Artificial Intelligence in Medicine, 67, 39–46. https://doi.org/10.1016/j.artmed.2016.01.004  

El Maachi, I., Bilodeau, G.-A., & Bouachir, W. (2020). Deep 1D-ConvNet for accurate Parkinson disease detection and severity prediction from gait. Expert Systems with Applications, 143, Article 113075. https://doi.org/10.1016/j.eswa.2019.113075

Gao S, Wang Z, Huang Y, Yang G, Wang Y, Yi Y, Zhou Q, Jian X, Zhao G, Li B, Xu L, Xia K, Tang B, Li J. Early detection of Parkinson's disease through multiplex blood and urine biomarkers prior to clinical diagnosis. NPJ Parkinsons Dis. 2025 Feb 25;11(1):35. doi: 10.1038/s41531-025-00888-2

Gunduz, H. (2019). Deep learning-based Parkinson’s disease classification using vocal feature sets. IEEE Access, 7, 115540–115551. https://doi.org/10.1109/ACCESS.2019.2935131               

Gupta, U., Bansal, H., & Joshi, D. (2020). An improved sex-specific and age-dependent classification model for Parkinson’s diagnosis using handwriting measurement. Computer Methods and Programs in Biomedicine, 189, Article 105305. https://doi.org/10.1016/j.cmpb.2020.105305   

Harrou, F., Sun, Y., Hering, A. S., & Madakyaru, M. (2020). Statistical process monitoring using advanced data-driven and deep learning approaches: Theory and practical applications. Elsevier.

Iakovakis, D., Mastoras, R. E., Hadjidimitriou, S., Charisis, V., Bostanjopoulou, S., Katsarou, Z., ... & Hadjileontiadis, L. J. (2020, July). Smartwatch-based activity analysis during sleep for early Parkinson’s disease detection. In 2020 42nd Annual International Conference of the IEEE Engineering in Medicine & Biology Society (EMBC) (pp. 4326-4329). IEEE.

Illner, V., Sovka, P., & Rusz, J. (2020). Validation of freely available pitch detection algorithms across various noise levels in assessing speech captured by smartphone in Parkinson’s disease. Biomedical Signal Processing and Control, 58, Article 101831. https://doi.org/10.1016/j.bspc.2019.101831     

Lahmiri, S., & Shmuel, A. (2019). Detection of Parkinson’s disease based on voice patterns ranking and optimized support vector machine. Biomedical Signal Processing and Control, 49, 427–433. https://doi.org/10.1016/j.bspc.2018.11.019   

Little, M. A., McSharry, P. E., Hunter, E. J., Spielman, J., & Ramig, L. O. (2009). Suitability of dysphonia measurements for telemonitoring of Parkinson’s disease. IEEE Transactions on Biomedical Engineering, 56(4), 1015–1022. https://doi.org/10.1109/TBME.2008.2005954        

M. Young, “The Technical Writer's Handbook,” Mill Valley, CA: University Science, 1989.

Mamun, K. A., Alhussein, M., Sailunaz, K., & Islam, M. S. (2017). Cloud based framework for Parkinson’s disease diagnosis and monitoring system for remote healthcare applications. Future Generation Computer Systems, 66, 36-47.

Prashanth, R., & Roy, S. D. (2018). Early detection of Parkinson’s disease through patient questionnaire and predictive modelling. International Journal of Medical Informatics, 119, 75–87. https://doi.org/10.1016/j.ijmedinf.2018.08.010          

Prashanth, R., Roy, S. D., Mandal, P. K., & Ghosh, S. (2016). High-accuracy detection of early Parkinson’s disease through multimodal features and machine learning. International Journal of Medical Informatics, 90, 13–21. https://doi.org/10.1016/j.ijmedinf.2016.03.001       

Sajal, M. S. R., Ehsan, M. T., Vaidyanathan, R., Wang, S., Aziz, T., & Mamun, K. A. (2020, September). UPDRS Label Assignment by Analyzing Accelerometer Sensor Data Collected from Conventional Smartphones. In International Conference on Brain Informatics (pp. 173-182). Cham: Springer International Publishing.

Sharma, S., Moon, C. S., Khogali, A., Haidous, A., Chabenne, A., Ojo, C., Jelebinkov, M., Kurdi, Y., & Ebadi, M. (2013). Biomarkers in Parkinson’s disease (recent update). Neurochemistry International, 63(3), 201–229. https://doi.org/10.1016/j.neuint.2013.06.005  

Sigcha, L., Pavón, I., Costa, N., Costa, S., Gago, M., Arezes, P., ... & De Arcas, G. (2021). Automatic resting tremor assessment in Parkinson’s disease using smartwatches and multitask convolutional neural networks. Sensors, 21(1), 291.

Silveira-Moriyama, L., Petrie, A., Williams, D. R., Evans, A., Katzenschlager, R., Barbosa, E. R., & Lees, A. J. (2009). The use of a color coded probability scale to interpret smell tests in suspected parkinsonism. Movement Disorders, 24(8), 1144–1153. https://doi.org/10.1002/mds.22508    

Singh, N., Pillay, V., & Choonara, Y. E. (2007). Advances in the treatment of Parkinson’s disease. Progress in Neurobiology, 81(1), 29–44. https://doi.org/10.1016/j.pneurobio.2006.11.009            

Solana-Lavalle, G., Galán-Hernández, J.-C., & Rosas-Romero, R. (2020). Automatic Parkinson disease detection at early stages as a pre-diagnosis tool by using classifiers and a small set of vocal features. Biocybernetics and Biomedical Engineering, 40(1), 505–516. https://doi.org/10.1016/j.bbe.2020.01.005        

Tsanas, A., Little, M. A., McSharry, P. E., & Ramig, L. O. (2010). Accurate telemonitoring of Parkinson’s disease progression by noninvasive speech tests. IEEE Transactions on Biomedical Engineering, 57(4), 884–893. https://doi.org/10.1109/TBME.2009.2036000          

Valenza, G., Orsolini, S., Diciotti, S., Citi, L., Scilingo, E. P., Guerrisi, M., Danti, S., Lucetti, C., Tessa, C., Barbieri, R., & Toschi, N. (2016). Assessment of spontaneous cardiovascular oscillations in Parkinson’s disease. Biomedical Signal Processing and Control, 26, 80–89. https://doi.org/10.1016/j.bspc.2015.11.006      

Wagner, A., Fixler, N., & Resheff, Y. S. (2017, March). A wavelet-based approach to monitoring Parkinson’s disease symptoms. In Proceedings of the IEEE International Conference on Acoustics, Speech and Signal Processing (ICASSP) (pp. 5980–5984). IEEE. https://doi.org/10.1109/ICASSP.2017.7953264

Wang, W., Lee, J., Harrou, F., & Sun, Y. (2020). Early detection of Parkinson’s disease using deep learning and machine learning. IEEE access, 8, 147635-147646.

Zhao, A., Qi, L., Li, J., Dong, J., & Yu, H. (2018). A hybrid spatio-temporal model for detection and severity rating of Parkinson’s disease from gait data. Neurocomputing, 315, 1–8. https://doi.org/10.1016/j.neucom.2018.06.074        


Article metrics
View details
0
Downloads
0
Citations
21
Views
📖 Cite article

View Dimensions


View Plumx


View Altmetric


0
Save
0
Citation
21
View
0
Share