1. Introduction
Something shifts, almost imperceptibly at first, when a programming class moves from a room to a screen. The device meant to deliver the lesson becomes — more often than anyone would like to admit — the thing quietly pulling attention away from it. This isn't a new complaint about technology in classrooms; teachers have voiced some version of it since chalkboards competed with passed notes. But there's a particular sharpness to it in programming instruction, where the logic of the material is cumulative rather than episodic. Miss the moment a function gets defined, and the next twenty minutes can feel like watching a film with the subtitles turned off (Shanley et al., 2022).
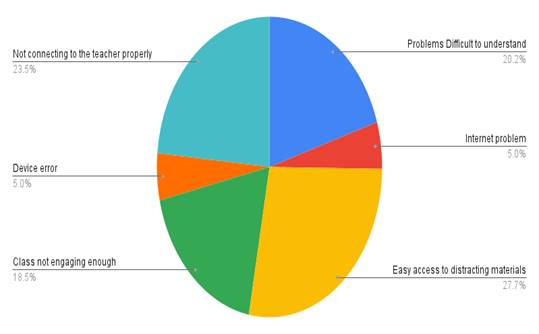
The scale of the problem, at least as far as existing survey data suggests, is not trivial. One frequently cited figure holds that 65% of online learners admit to being distracted by social networking sites during class, while 43% report that technical glitches — a frozen screen, a call that drops, a login that refuses to cooperate — interrupt their focus before the lesson has properly begun (Singal et al., 2020; TechRepublic, 2020). Read plainly, that means a clear majority of students are, by their own account, drifting somewhere other than the lesson for at least part of it — not, it seems fair to say, because they've stopped caring, but because a notification is a more immediate kind of pull than an explanation of nested loops.
This tension is not new to the literature, though it keeps resurfacing in slightly different forms depending on who is studying it. Aagaard (2015) frames it as a structural feature of digital learning environments themselves: the same flexibility that makes online access possible also opens a door to "off-task" behavior, in his terms, using the technology for anything but the task at hand. Winter et al. (2010) come at a similar problem from the angle of multitasking, describing how students juggle coursework alongside messaging and entertainment in ways that blur, sometimes past the point of usefulness, what "studying" even means in a given moment. Earlier still, Chen (2006) had asked essentially the same question through the lens of flow — whether the absorbed, on-task engagement that characterizes good learning is something the online medium supports or quietly works against.
Programming education adds its own layer of difficulty on top of this general picture. Tamatea and Pramitasari (2018), writing about informal coding classes for underprivileged learners in Bali, make the point that access to "online" resources doesn't automatically translate into participation — socioeconomic context shapes not just whether students can log in, but whether they can meaningfully engage once they have. There is also, as Dutton et al. (2019) suggest, a quieter loss that comes with the absence of physical presence: in a room, a wandering mind is at least somewhat checked by the social fact of being watched; online, that check largely disappears. This shift has been part of the distance-education literature for some time (Allen & Seaman, 2006), and has surfaced repeatedly in adjacent domains — language learning, for instance, where motivation and affect behave differently once the instructor is no longer physically present (Blake, 2011; Bown & White, 2010).
Self-regulation, or the lack of it, appears to sit at the center of much of this. Online learning asks students to manage their own time, attention, and motivation to a degree that in-person instruction rarely demands so explicitly (Andrade, 2012; Andrade & Bunker, 2009; Broadbent & Poon, 2015), and conceptual work on self-regulated learning stresses that this is less a matter of willpower than of how environments are designed — or fail to be designed — to scaffold self-monitoring (Beishuizen & Steffens, 2011). Small interventions, like implementation intentions — deciding in advance, concretely, when and how one will study (Achtziger et al., 2008) — have shown some promise here, suggesting the gap between distraction and focus may be narrower, and more addressable, than it first appears.
Technology, somewhat ironically, may also be part of the answer. The platform itself matters — how screen-sharing and recording are handled shapes engagement in ways instructors don't always anticipate (TechRepublic, 2020) — and even social media, usually cast as the villain in this story, has shown some capacity to support learning when deliberately integrated (Aydin, 2012; Chawinga, 2017; Abney et al., 2019). Kedia and Mishra (2023) similarly find that instructor–student interaction and social or technical support meaningfully shape online learning outcomes at the college level, a finding this study leans on directly given its own tripartite design.
This research sits inside that tension — technology as distraction, technology as tool — with a specific focus on coding classrooms, and a specific ambition: not simply to catalogue why students disengage, but to identify which distractions matter most, from whose perspective, and what realistically adoptable interventions might follow. The objectives are threefold: to evaluate how distraction shapes engagement and outcomes in online programming courses specifically; to propose interventions grounded in what institutions can plausibly implement rather than what would be ideal in principle (Arkorful & Abaidoo, 2015); and to identify which pedagogical and technological approaches genuinely sustain motivation, drawing on lessons from large-scale initiatives such as MOOCs (Bonk et al., 2015). The question matters now in a fairly concrete, local sense too: Bangladesh's ongoing curriculum reform, which removes board examinations before Class 10 (The Business Standard, 2021), is likely to intersect with online delivery in ways that make understanding distraction — and designing around it — more urgent, not less.