4.1 Making Sense of the Findings: What the Data Collectively Suggest
Taken together, the results paint a broadly consistent picture — though one that deserves more careful unpacking than a simple narrative of "ML works for supply chains" would allow. Across all five constructs, practitioners expressed strong and relatively uniform confidence in ML's contribution to supply chain performance (Table 1), with mean scores clustering between 4.24 and 4.38 on a five-point scale. That convergence is notable. It suggests not merely that individual respondents held favourable views, but that there exists something approaching a shared professional consensus — at least among practitioners with direct operational exposure to ML tools — that these technologies meaningfully improve how supply chains are managed (Golan et al., 2020; Sharma et al., 2020).
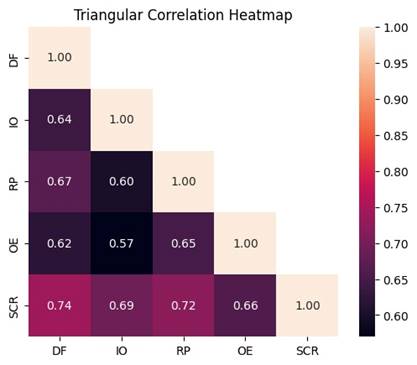
What is perhaps more interesting, though, is the pattern within that consensus. Supply Chain Resilience (SCR) was rated highest of all constructs (M = 4.38, SD = 0.52), and it also emerged as the most strongly correlated and most predictable outcome variable in the modelling phase (Figure 1; Table 2). That is not coincidental. Resilience — understood here as a system's capacity to absorb disruption, adapt, and recover without catastrophic loss of function — has become the defining anxiety of supply chain management over the past decade (Ivanov et al., 2013; Bag et al., 2019). Practitioners have lived through enough crises to know that efficiency without resilience is fragile, and their ratings reflect that hard-won awareness (Ralston & Blackhurst, 2020).
4.2 Ensemble Models and the Limits of Linear Thinking
The comparative model performance results (Table 2) deserve more than a straightforward reading of which algorithm scored highest. Yes, Random Forest outperformed the others at 87% accuracy and R² = 0.70 — and yes, Gradient Boosting followed closely at 86% and R² = 0.69. But the more conceptually interesting observation is the consistent performance gap between the ensemble methods and Multiple Linear Regression, which plateaued at 79% accuracy and R² = 0.61. That gap is not simply a matter of algorithmic sophistication; it reflects something real about the structure of the underlying relationships.
Supply chain performance constructs — demand forecasting accuracy, inventory behaviour, risk exposure, operational efficiency — do not interact linearly. They compound, amplify, and sometimes counteract each other in ways that depend on context, sector, and organisational maturity (Li et al., 2020; Cadavid et al., 2020). A firm that improves its demand forecasting does not experience a proportional, additive improvement in resilience — the benefit is mediated by whether inventory systems can respond to updated signals, whether risk models are calibrated to the same data, and whether operational processes are flexible enough to act on the outputs. Linear regression, by design, cannot represent those interaction effects. Ensemble methods, by contrast, implicitly model them through hierarchical tree splits and boosted residual correction — which is arguably why they fit the data better here (Shahbazi & Byun, 2020; Wang et al., 2017).
It is worth being honest about what the R² = 0.70 for Random Forest does and does not mean. It means the model accounts for 70% of the variance in SCR scores across the test set — a respectable result, but also a reminder that 30% of that variance remains unexplained. Some of that unexplained portion is likely noise inherent to self-report data; some may reflect genuinely important variables not captured in the survey instrument, such as organisational culture, IT infrastructure quality, or sector-specific regulatory constraints (Chhetri et al., 2017; Makris et al., 2019). An R² of 0.70 is not the end of the story; it is an invitation to investigate what the model is missing.
4.3 The Central Role of Anticipatory Capabilities: Demand Forecasting and Risk Prediction
One of the clearest, most replicable findings across both the correlation analysis (Figure 1) and the feature importance results (Table 3) is the primacy of anticipatory over reactive capabilities. Demand Forecasting was the strongest correlate of Supply Chain Resilience (r = 0.74) and the highest-ranked predictor in the Random Forest model (importance score = 0.30). Risk Prediction was second on both counts (r = 0.72; importance = 0.28). Together they account for 58% of the model's total feature importance — a concentration that is hard to dismiss as coincidental.
The theoretical explanation is not difficult to articulate, even if the organisational reality is often harder to achieve. A supply chain that can anticipate what demand will look like three or six months out is in a fundamentally different position than one reacting to demand signals in real time. It can pre-position inventory, negotiate supplier contracts under less time pressure, route logistics capacity efficiently, and absorb unexpected spikes without cascading into stockouts (Ivanov & Dolgui, 2019; Shashi et al., 2019). Risk Prediction works analogously: disruptions that are anticipated — whether through geopolitical monitoring, weather modelling, or supplier health scoring — can be absorbed at far lower cost than those that arrive without warning (Chien et al., 2020; Sobb et al., 2020). The feature importance analysis (Table 3) essentially quantifies what experienced supply chain managers have long known intuitively: the biggest competitive advantage is not responding faster, it is needing to respond less often.
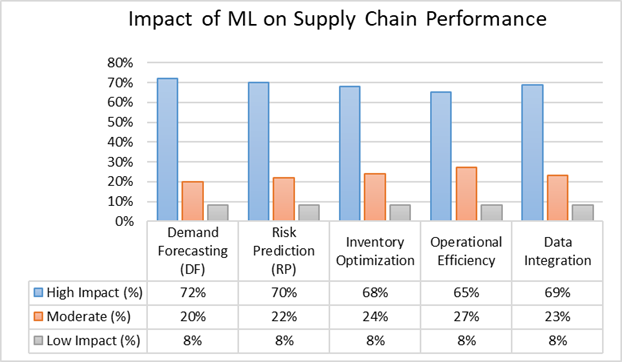
This finding also has a practical implication that the survey data (Figure 2) reinforce. When 72% of respondents rated demand forecasting as high-impact and 70% said the same of risk prediction, they were not simply endorsing the technology in the abstract — they were reporting felt experience of specific operational improvements. That convergence between the algorithmic feature importance and the practitioner perception data is, arguably, one of the more encouraging aspects of this study's design: two entirely different measurement approaches point toward the same conclusion (Bag et al., 2019; Allaoui et al., 2019).
4.4 Inventory Optimization and Data Integration as Structural Enablers
Inventory Optimization (IO) ranked third in feature importance (0.23) and correlated with SCR at r = 0.69 (Figure 1; Table 3) — a strong result, though one that perhaps requires contextualisation. Inventory optimisation is, in some respects, the operational expression of good forecasting: a model that accurately predicts demand can translate that prediction into leaner, more responsive stock levels, reducing both carrying costs and the risk of obsolescence (Govindan et al., 2013). The relatively high feature importance score for IO may therefore partly reflect the downstream benefit of upstream forecasting accuracy, rather than IO functioning as an entirely independent driver of resilience. Disentangling these contributions would require a longitudinal or interventional design that cross-sectional survey data cannot support.
Data Integration's fourth-place ranking (importance = 0.20) is, in some ways, the most conceptually interesting result of all — and the one most easily overlooked in a results section focused on headline model performance (Table 3). Data integration is not a capability in the same sense that forecasting or risk prediction are; it is the precondition that makes those capabilities possible. Without coherent, timely, and interconnected data flows across supplier networks, logistics platforms, warehouse management systems, and demand-sensing tools, even the most sophisticated ML algorithm is operating in an information vacuum (Boyson, 2014; Shang & You, 2019). The fact that data integration registers as a meaningful predictor of SCR in a survey of practitioners is perhaps a signal that organisations are increasingly aware of this dependency — aware, in other words, that data quality and pipeline integrity are not IT infrastructure problems but strategic supply chain problems (Radanliev et al., 2020; Lu, 2017).
4.5 Why Operational Efficiency Ranks Last — and Why That Is Not a Trivial Finding
Operational Efficiency (OE) was consistently the weakest predictor across both the feature importance analysis (importance = 0.15) and the correlation matrix (r = 0.66 with SCR), and the dimension rated least impactful by survey respondents at 65% (Table 3; Figure 1; Figure 2). This might seem counterintuitive — surely efficient operations contribute to resilience? They do, but the relationship appears to be more conditional than direct. Operational efficiency, in the supply chain context, often reflects lean process design, cost optimisation, and throughput maximisation. These are valuable in stable conditions; they become liabilities under disruption, when the slack that "inefficient" systems retain becomes the very buffer that allows recovery (Ivanov et al., 2013; Ralston & Blackhurst, 2020).
This tension between efficiency and resilience is well-documented in the operations management literature, and the feature importance results here are broadly consistent with it (Govindan et al., 2013; Bag et al., 2019). What the ML models appear to be detecting — and what practitioners seem to intuitively sense — is that anticipatory capabilities provide more durable protection against disruption than execution-layer optimisation alone. Efficiency matters, but it matters less when a system lacks the foresight to avoid the disruptions that efficiency cannot buffer.
4.6 Barriers to Full ML Deployment: The Gap Between Potential and Practice
Despite the broadly optimistic tone of the survey responses, the findings should not be read as evidence that ML adoption in supply chains is proceeding smoothly or equitably. Only 8% of respondents reported low perceived impact — but this is a sample of practitioners who already work in environments with some degree of ML exposure. The harder, more structurally significant question is what the distribution of views looks like in organisations that have not yet been able to adopt these tools, and the present study, by design, cannot answer that.
What the literature makes clear — and what remains as relevant in 2024 as it was when these reference works were published — is that barriers to adoption are substantial and unevenly distributed. Fragmented data infrastructures, a persistent shortage of professionals with both domain expertise and machine learning competence, high implementation and maintenance costs, and organisational cultures resistant to algorithmic decision-making all constrain the pace and breadth of ML diffusion across supply chains (Shang & You, 2019; Govindan et al., 2013; Chang et al., 2019). These barriers are not random in their distribution — they fall disproportionately on smaller firms, on organisations in lower-income economies, and on sectors with historically lower levels of digital infrastructure investment. The result is a growing divergence: supply chains with ML capabilities becoming more resilient over time, while those without fall further behind (Makris et al., 2019; Nagy et al., 2018).
This structural inequality deserves more than a paragraph in a limitations section. It is arguably the most consequential implication of this line of research — not whether ML can improve supply chain resilience under ideal conditions (the evidence suggests it can), but whether the conditions for its adoption can be made more accessible, and what the cost is when they cannot (Cai & Luo, 2020; Klemeš et al., 2020).
4.7 Limitations and Directions for Future Research
Several limitations of this study warrant explicit acknowledgement, not as ritual disclaimer but because they genuinely shape how the findings should be read. First, the cross-sectional design captures perceptions at a single point in time and cannot establish the direction or causality of the observed associations. That SCR correlates strongly with DF and RP does not mean improving demand forecasting causes resilience improvements — only that organisations where practitioners perceive both tend to co-occur. Longitudinal or quasi-experimental designs would be better positioned to test causal claims (Ralston & Blackhurst, 2020).
Second, the sample, while meaningfully sized at n = 200, is drawn from a single national context. Supply chain conditions, digital infrastructure, regulatory environments, and practitioner attitudes toward ML vary considerably across geographies — findings from one country may not transfer cleanly to others, and replication studies in different national or regional settings would considerably strengthen the evidence base (Makris et al., 2019; Koh et al., 2020).
Third, the Likert-based survey instrument, however carefully constructed, measures perception rather than operational performance. An organisation whose practitioners report high ML impact on demand forecasting may or may not actually achieve better forecast accuracy; the gap between self-assessed and objectively measured performance is well-documented and remains a boundary on interpretation here (Barreto et al., 2017; Shashi et al., 2019). Future work that links practitioner survey responses to firm-level operational KPIs — forecast error rates, stockout frequencies, disruption recovery times — would represent a meaningful methodological advance over the present design.