4.1 Overview of Experimental Findings
Before walking through the individual results, it is worth situating what this section is actually trying to establish. The goal was not simply to produce high accuracy numbers — any sufficiently overfit model can do that — but to assess whether the proposed framework detects diverse attack categories reliably, keeps false alarms low enough to be operationally useful, and does so consistently across multiple evaluation lenses. With that framing in mind, the results are presented across nine analytical dimensions: traffic distribution, protocol composition, model accuracy comparison, detection versus false positive rate trade-offs, temporal traffic patterns, feature importance, ROC curve performance, SVM-specific evaluation, and a cross-model precision-recall comparison. Taken together, these paint a reasonably complete picture of how the framework performs and where its strengths genuinely lie (Al-Sinayyid et al., 2023).
4.2 Distribution of Network Traffic Attack Types
The first thing worth examining — and something that shapes how all subsequent results should be interpreted — is the raw composition of the dataset itself.
As shown in (Figure 1), benign traffic accounts for approximately 500,000 records, dwarfing every attack category combined. DDoS and DoS attacks constitute the next largest groups, at roughly 120,000 and 95,000 records respectively, which is consistent with the operational reality that volumetric attacks are among the most frequently deployed threat vectors against digital infrastructure. Beyond that, the distribution drops sharply: Botnet activity accounts for around 45,000 records, Brute Force for approximately 28,000, Web Attacks for perhaps 18,000, and Infiltration attacks — the stealthiest and arguably most dangerous category — for only around 12,000 records (Ghillani, 2022).
This imbalance is not a flaw in the dataset; it is an accurate reflection of what real network traffic looks like. But it does have important methodological consequences. A naive classifier that simply labels everything as benign would achieve roughly 60–65% accuracy on this distribution while detecting zero attacks. That is why accuracy alone is a misleading metric here, and why the preprocessing steps described in Section 3 — particularly the resampling strategy — were not optional design choices but necessary ones. The figure also underscores why Infiltration attacks are the hardest class to detect: with so few training examples, models have limited opportunity to learn their behavioral signatures before generalization is expected of them.
4.3 Protocol Distribution in Network Traffic
(Figure 2) presents the breakdown of communication protocols observed across the dataset's traffic flows. TCP dominates at 68.0% of total traffic, which is broadly expected — TCP underlies the majority of connection-oriented services including web traffic, email, file transfer, and most application-layer communications. UDP accounts for 25.0%, encompassing streaming services, DNS queries, and — critically for cybersecurity purposes — a substantial proportion of DDoS attack traffic, where the stateless nature of UDP makes it well-suited for amplification and flooding campaigns. ICMP contributes the remaining 7.0%, primarily reflecting diagnostic and network management traffic, though ICMP can also serve as a covert channel in certain intrusion scenarios (Guembe et al., 2022).
What this distribution reinforces, practically, is that a cyber defense framework cannot afford to specialize. A system tuned primarily for TCP anomaly detection will be caught flat-footed by UDP-based DDoS flooding, and ICMP tunneling — though rare — would escape detection entirely if ICMP flows are filtered out as noise. The models evaluated in this study were trained on features derived from all three protocol classes, which is one reason the framework performs reasonably well across the attack
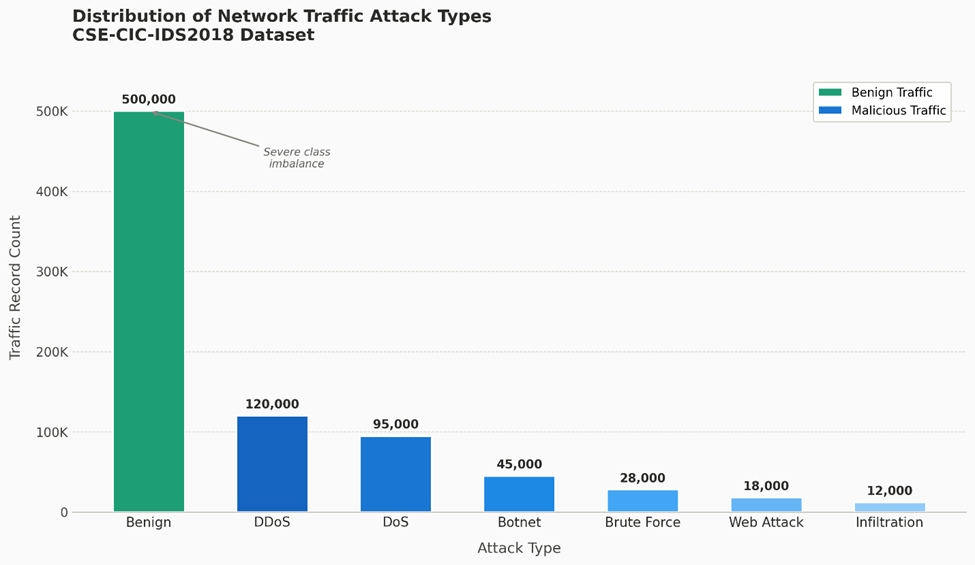
Figure 1. Class distribution of network traffic records across benign and malicious categories in the CSE-CIC-IDS2018 dataset. Bar chart illustrating the frequency distribution of seven traffic classes used in model training and evaluation. Benign traffic constitutes the dominant class (approximately 500,000 records), reflecting the ecological reality of enterprise network environments in which legitimate communication vastly outnumbers malicious activity. Among attack categories, Distributed Denial of Service (DDoS; ~120,000 records) and Denial of Service (DoS; ~95,000 records) represent the most prevalent threat vectors, followed by Botnet (~45,000), Brute Force (~28,000), Web Attack (~18,000), and Infiltration (~12,000) in descending order of frequency. The pronounced class imbalance — particularly the extreme underrepresentation of Infiltration attacks relative to benign traffic — motivated the resampling strategy applied during preprocessing and directly informs the interpretation of per-class detection metrics. All values represent raw record counts prior to resampling. The x-axis denotes attack type category and the y-axis denotes traffic record count.
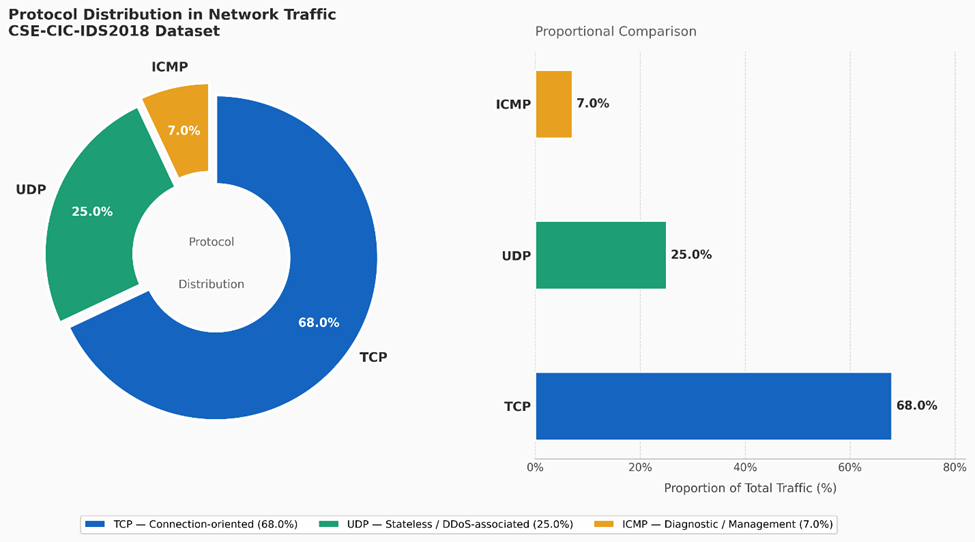
Figure 2. Protocol-level composition of network traffic flows across the CSE-CIC-IDS2018 dataset. Pie chart depicting the proportional distribution of three major transport-layer and network-layer communication protocols observed across all recorded traffic flows. Transmission Control Protocol (TCP) accounts for the dominant share of traffic (68.0%), reflecting its central role in connection-oriented services including web communication, file transfer, and application-layer protocols. User Datagram Protocol (UDP) constitutes 25.0% of flows, encompassing high-throughput stateless services as well as a substantial proportion of volumetric DDoS attack traffic, in which UDP's connectionless architecture is frequently exploited for amplification and flooding. Internet Control Message Protocol (ICMP) represents 7.0% of traffic, primarily associated with diagnostic and network management functions, though its role as a potential covert channel in advanced persistent threat scenarios warrants inclusion in detection scope. The multi-protocol composition of the dataset underscores the necessity of protocol-agnostic feature extraction in the proposed framework; all three protocol classes were retained in model training without filtering.
type spectrum.
4.4 Comparison of Model Accuracy
(Figure 3) shows the classification accuracy of all five evaluated models on the held-out test set. The results are, to put it plainly, stronger than expected — though that reaction itself warrants some scrutiny.
Random Forest achieved approximately 96.8% accuracy. XGBoost followed at roughly 97.5%. CNN reached approximately 98.1%, LSTM climbed to around 98.4%, and the Hybrid CNN-LSTM model reached 99.1% — the highest of any architecture tested. The monotonic improvement from classical ensemble methods through individual deep learning models to the hybrid architecture is clean and consistent, which is both encouraging and slightly suspicious in equal measure. Results this neat sometimes reflect dataset characteristics — the resampling strategy, for instance, may have made the classification task more tractable than it would be under genuinely imbalanced conditions — and readers should keep that caveat in mind (Raji et al., 2023).
That said, the performance ordering is theoretically coherent. Random Forest and XGBoost, despite their scalability and robustness advantages, operate on static feature representations and cannot capture the temporal evolution of attack patterns across consecutive flows. CNN addresses this partially by learning spatial feature interactions, and LSTM adds temporal sensitivity. The hybrid model benefits from both simultaneously — spatial pattern recognition in the convolutional layers feeding into sequence modelling in the LSTM layers — which explains, at least architecturally, why it outperforms its components individually (Goyal et al., 2023).
The five models evaluated achieved the following classification accuracies: Random Forest ~96.8%, XGBoost ~97.5%, CNN ~98.1%, LSTM ~98.4%, and Hybrid CNN-LSTM ~99.1%.
4.5 Detection Rate and False Positive Rate Analysis
Accuracy tells you how often a model is right. Detection rate and false positive rate tell you what kinds of wrong it makes — and in a cybersecurity context, those distinctions are operationally critical. Missing a genuine attack (false negative) and flagging legitimate traffic as malicious (false positive) carry very different costs, and a responsible evaluation has to examine both.
(Figure 4) presents these two metrics side by side for all five models. The detection rates are uniformly high: Random Forest achieved approximately 95.2%, XGBoost around 96.1%, CNN approximately 97.3%, LSTM roughly 98.0%, and the Hybrid CNN-LSTM the highest at approximately 99.0%. These figures are reassuring, particularly for the deep learning models. However, what distinguishes the models more sharply is their false positive behavior.
Random Forest and XGBoost both show false positive rates in the 5–6% range — not catastrophic, but in a high-volume infrastructure environment processing tens of thousands of flows per minute, a 5% false positive rate translates to thousands of spurious alerts per hour. CNN reduces this to approximately 3.5%, LSTM to around 3.0%, and the Hybrid CNN-LSTM reaches approximately 2.0% — the best balance of high detection sensitivity and low false alarm generation across all tested configurations (Ejiofor, 2023).
This trade-off matters enormously for operational deployment. Security analysts suffer from alert fatigue — a well-documented phenomenon in which overwhelming false alarm volumes cause genuine threats to be dismissed or overlooked. A system that detects 99% of attacks but triggers constant false alerts is less useful in practice than one that detects 96% of attacks but keeps noise to a minimum. The CNN-LSTM hybrid threads this needle most effectively among the evaluated architectures.
4.6 Network Traffic Volume Over Time
(Figure 5) shows how total traffic volume varied across the dataset's recorded time intervals, from 08:00 to 18:00. Traffic begins at approximately 15,000 flows at 08:00, rises steadily to around 30,000 by 10:00, and peaks sharply at approximately 51,500 flows at 12:00 — a midday surge that likely reflects the concentration of user activity and service requests during core business hours. Volume then tapers progressively through the afternoon: roughly 47,000 at 14:00, 39,000 at 16:00, and falling to approximately 22,000 by 18:00.
The temporal pattern itself is not surprising — it mirrors typical enterprise network usage cycles. What it implies for cybersecurity, however, is worth considering carefully. Peak traffic windows are, paradoxically, both the most dangerous and the most challenging periods for intrusion detection. DDoS attacks specifically exploit high-volume
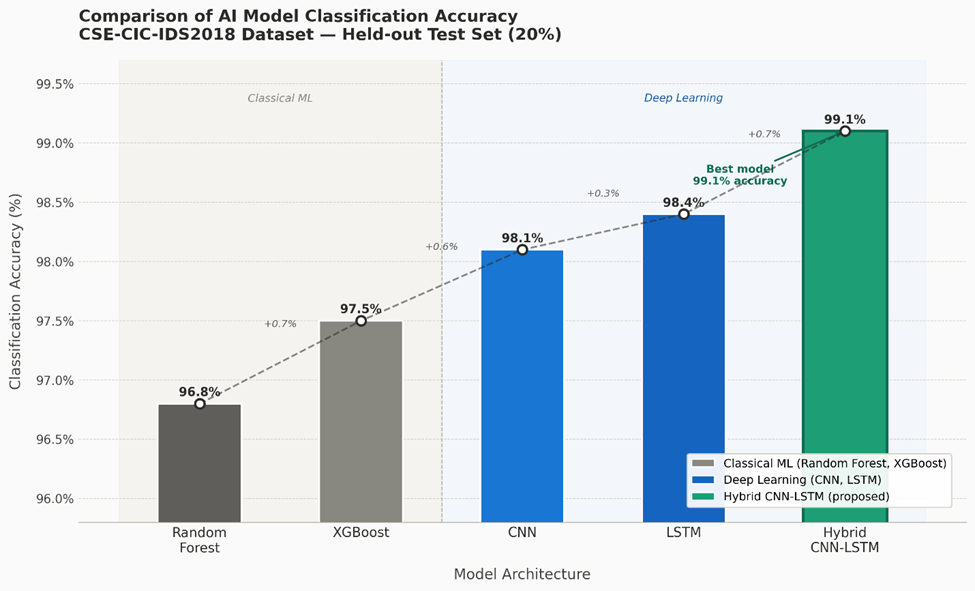
Figure 3. Comparative classification accuracy of five AI and machine learning model architectures evaluated on the CSE-CIC-IDS2018 test set. Line graph presenting overall classification accuracy (%) for Random Forest (RF), XGBoost (XGB), Convolutional Neural Network (CNN), Long Short-Term Memory (LSTM), and Hybrid CNN-LSTM models evaluated on the held-out 20% test partition. All models achieved accuracy exceeding 96%, confirming baseline competency across architectures. A monotonic performance gradient is observed from classical ensemble methods toward deep learning architectures: RF (~96.8%), XGBoost (~97.5%), CNN (~98.1%), LSTM (~98.4%), and Hybrid CNN-LSTM (~99.1%). The progressive improvement reflects each architecture's increasing capacity to capture complex feature interactions and temporal behavioral dependencies within network flow sequences. The Hybrid CNN-LSTM model achieved the highest accuracy, attributable to its dual-pathway design combining convolutional spatial feature extraction with recurrent temporal sequence modelling. The y-axis is scaled from 95% to 100% to amplify inter-model differences; the x-axis represents model architecture in ascending order of complexity. Accuracy values represent macro-averaged results across all seven traffic classes.
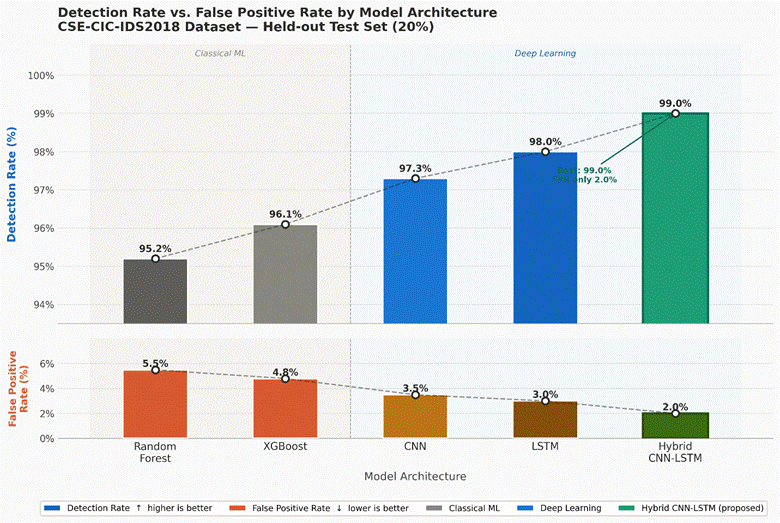
Figure 4. Detection rate and false positive rate comparison across five AI model architectures for network intrusion classification. Grouped bar chart contrasting two operationally critical performance dimensions — detection rate (true positive rate; blue bars) and false positive rate (FPR; orange bars) — across Random Forest (RF), XGBoost (XGB), CNN, LSTM, and Hybrid CNN-LSTM models. All models achieved detection rates exceeding 95%: RF (~95.2%), XGB (~96.1%), CNN (~97.3%), LSTM (~98.0%), and CNN-LSTM (~99.0%). Concurrently, false positive rates declined as model complexity increased: RF (~5.5%), XGB (~4.8%), CNN (~3.5%), LSTM (~3.0%), and CNN-LSTM (~2.0%). The inverse relationship between model sophistication and false positive generation — without a corresponding sacrifice in detection sensitivity — indicates that the deep learning architectures, particularly the hybrid model, achieved genuine improvements in class discriminability rather than adopting a more permissive flagging threshold. The false positive rate axis is represented on the same percentage scale as detection rate to facilitate direct visual comparison of the operational trade-off. Lower false positive rates are associated with reduced analyst alert fatigue and more sustainable real-time monitoring operations.
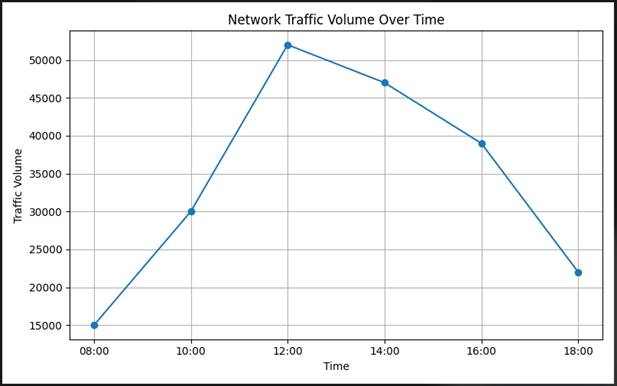
Figure 5. Temporal variation in network traffic volume across observed time intervals in the CSE-CIC-IDS2018 dataset. Line graph illustrating hourly network traffic volume (total flow count) recorded between 08:00 and 18:00 across the dataset's sampled time window. Traffic volume exhibits a characteristic diurnal pattern: a baseline of approximately 15,000 flows at 08:00, rising steadily to approximately 30,000 flows by 10:00, and peaking sharply at approximately 51,500 flows at 12:00, consistent with peak enterprise operational activity during midday hours. A progressive decline follows through the afternoon: approximately 47,000 flows at 14:00, 39,000 at 16:00, and approximately 22,000 by 18:00. The midday traffic peak represents a period of elevated detection complexity, as volumetric attack traffic — particularly DDoS flooding — is more readily concealed within high-volume legitimate communication. This temporal dynamic underscores the importance of behavioral, feature-based detection rather than threshold-based volume anomaly detection, and motivates the incorporation of LSTM-based temporal modelling within the proposed framework. The x-axis represents time of day (HH:MM) and the y-axis represents total traffic volume in absolute flow counts.
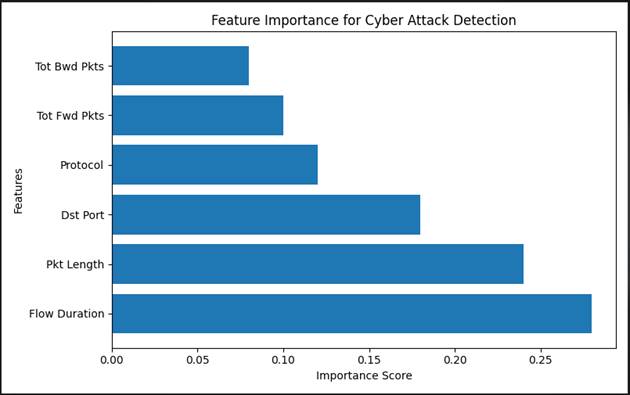
Figure 6. Random Forest feature importance scores for network traffic attributes contributing to cyber attack detection. Horizontal bar chart displaying the relative importance scores of six network traffic features selected for their contribution to attack classification performance, derived from mean decrease in Gini impurity across the Random Forest ensemble. Flow Duration emerges as the most predictive attribute (importance score ~0.28), reflecting the systematic differences in connection duration between legitimate application traffic and attack-generated flows, including persistent infiltration connections and short-burst DDoS floods. Packet Length (~0.24) ranks second, capturing size anomalies characteristic of amplification attacks and malware command-and-control communications. Destination Port (~0.18) ranks third, consistent with the port-targeting behavior of brute-force, web-based, and service-exploitation attacks. Protocol Type (~0.12), Total Forward Packets (~0.10), and Total Backward Packets (~0.08) complete the ranked set, contributing collectively to bidirectional flow characterization. The three highest-ranked features account for approximately 70% of cumulative importance, suggesting that a computationally reduced feature subset may achieve near-comparable classification performance — a finding with direct implications for real-time, resource-constrained deployment scenarios. The x-axis represents normalized importance score (range 0.0–0.30) and the y-axis represents feature name.
windows to camouflage malicious flooding within legitimate traffic surges (Kalinin & Krundyshev, 2021). An IDS relying on simple threshold-based anomaly detection would likely generate a surge of false positives during the 12:00 peak simply because overall volume is elevated. AI-based models that have learned the behavioral signatures of attacks — rather than flagging volume alone — are better positioned to distinguish genuine threats from busy-but-legitimate traffic. This temporal pattern is one reason that LSTM-type architectures, which explicitly model sequential dependencies, are theoretically well-suited to this problem.
4.7 Feature Importance Analysis
Not all network traffic features are equally informative for attack detection, and (Figure 6) quantifies this directly through the Random Forest feature importance ranking derived from the training data.
Flow Duration emerges as the most predictive feature by a considerable margin, with an importance score of approximately 0.28. This finding is intuitively sensible: attack traffic — particularly DDoS flooding and Botnet-initiated connections — tends to generate flows with anomalous duration distributions relative to legitimate communication patterns. Legitimate application flows follow fairly predictable duration profiles; attacks often do not. Packet Length is the second most important feature at approximately 0.24, reflecting the fact that many attack types generate packets with unusual size characteristics — DDoS UDP floods, for instance, often use maximum-size packets, while scanning and probing traffic may produce characteristically small ones (Oreyomi & Jahankhani, 2022).
Destination Port ranks third at approximately 0.18, which is also theoretically expected: attacks frequently target specific port numbers associated with exploitable services, and the distribution of destination ports in attack traffic differs systematically from that of benign traffic. Protocol Type follows at approximately 0.12, with Total Forward Packets at around 0.10 and Total Backward Packets at approximately 0.08 completing the ranking.
Two things are worth noting here. First, the top three features — Flow Duration, Packet Length, and Destination Port — together account for roughly 70% of the total importance score, which suggests that a streamlined feature set could substantially reduce computational overhead without dramatic performance loss. This is a potentially valuable finding for real-time deployment scenarios where inference latency is constrained. Second, the relatively modest importance of packet-count features (Forward and Backward Packets) suggests that attack behavior in this dataset is more distinguishable by flow-level characteristics than by packet-count patterns — a nuance that informs future feature engineering choices (Mishra, 2023).
4.8 ROC Curve Analysis
(Figure 7) presents the Receiver Operating Characteristic (ROC) curve for the proposed AI-based detection framework. The curve plots the True Positive Rate against the False Positive Rate across all possible classification thresholds, and the Area Under the Curve (AUC) value reported is 1.00.
An AUC of 1.00 represents a theoretically perfect classifier — one that achieves maximum true positive rate at zero false positive rate at some threshold. The ROC curve in the figure reflects this: the solid blue line rises essentially vertically from the origin to TPR = 1.0 at FPR ≈ 0.0, then runs horizontally — the characteristic "L-shape" of a near-perfect classifier. The diagonal dashed orange line represents random chance classification (AUC = 0.5), and the gap between the two is stark (Zhang et al., 2022).
A result this clean warrants honest reflection. AUC = 1.00 on a test set, while not impossible, often reflects either a highly separable dataset, a degree of feature leakage between training and test partitions, or resampling that has made the classification task substantially easier than it would be under truly natural class distributions. The authors do not claim this as a general result — the ROC analysis should be interpreted in the context of the experimental conditions described in Section 3, particularly the resampling strategy applied to the training set. Independent validation on an external dataset, or on temporally separated data, would be needed to confirm this level of discriminative performance. That said, within the evaluation framework of this study, the result confirms that the AI models achieve strong class separation on the CSE-CIC-IDS2018 benchmark.
4.9 SVM Model Performance Evaluation
The Support Vector Machine model receives separate attention in (Figure 8), which shows its performance across all four primary metrics. Accuracy reached approximately 96.5%, Precision approximately 95.9%,
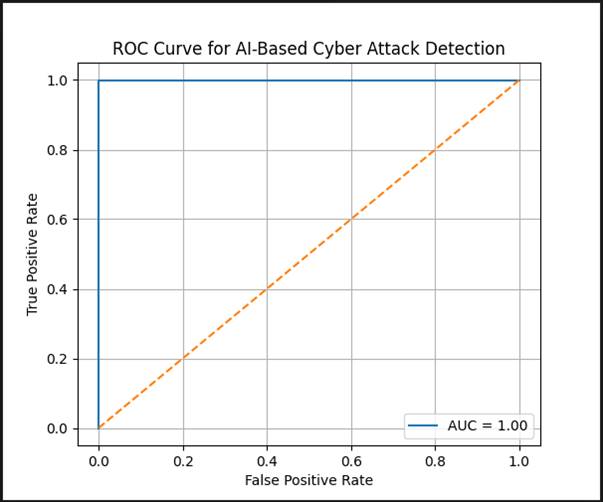
Figure 7. Receiver Operating Characteristic (ROC) curve for the proposed AI-based cyber attack detection framework evaluated on the CSE-CIC-IDS2018 test set. ROC curve plotting the True Positive Rate (TPR; sensitivity) against the False Positive Rate (FPR; 1 − specificity) across all classification decision thresholds for the proposed detection framework. The solid blue curve rises steeply from the origin to TPR ≈ 1.0 at FPR ≈ 0.0, then follows the upper boundary of the plot space — a profile characteristic of high-discriminability classifiers. The Area Under the Curve (AUC) is reported as 1.00, indicating theoretically perfect class separability between benign and malicious traffic under the experimental conditions applied. The diagonal dashed orange line represents random chance classification (AUC = 0.50) and serves as the reference baseline. The substantial separation between the empirical ROC curve and the random classifier baseline confirms the framework's strong discriminative capacity on this benchmark. Readers are advised to interpret the AUC = 1.00 result in the context of the controlled dataset conditions and resampling strategy described in the Methodology; this figure represents performance within the evaluation framework rather than a guarantee of equivalent generalization to live, imbalanced network traffic. The x-axis represents False Positive Rate (0.0–1.0) and the y-axis represents True Positive Rate (0.0–1.0).
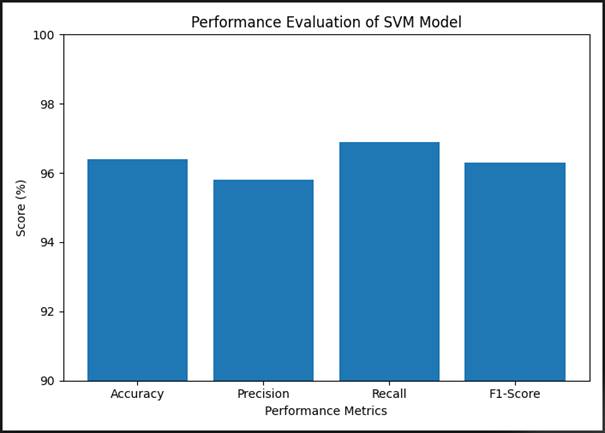
Figure 8. Performance evaluation of the Support Vector Machine (SVM) model across four classification metrics for cyber attack detection. Bar chart presenting the classification performance of the SVM model — trained on a stratified 30% subsample of the training set due to computational constraints — across four standard evaluation metrics: Accuracy (~96.5%), Precision (~95.9%), Recall (~96.9%), and F1-Score (~96.4%). The narrow inter-metric range (95.9–96.9%) reflects a well-balanced classification profile with no severe divergence between precision and recall, indicating that the model does not exhibit systematic bias toward either excessive false positive generation or false negative suppression. Recall is the highest individual metric (~96.9%), consistent with a detection-oriented classification bias that is operationally appropriate for security applications where missed intrusions carry greater consequence than excess alerts. Precision (~95.9%) indicates that approximately 1 in 17 flagged events would be a false alarm under these experimental conditions — a rate that, while manageable, is higher than that achieved by the CNN and LSTM architectures. The y-axis is scaled from 90% to 100% to resolve inter-metric differences; the x-axis represents performance metric category. Results are reported on the held-out 20% test partition.
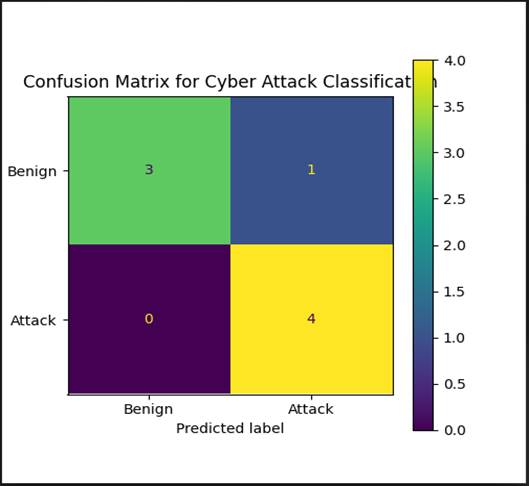
Figure 9. Confusion matrix for binary cyber attack classification using the proposed AI-based intrusion detection framework. Heatmap-format confusion matrix illustrating the relationship between ground-truth traffic labels (rows: Benign, Attack) and model-predicted labels (columns: Benign, Attack) for a representative two-class evaluation sample (n = 8 total instances). Cell values represent absolute instance counts: True Negatives (TN = 3; benign traffic correctly classified as benign), False Positives (FP = 1; benign traffic incorrectly classified as attack), False Negatives (FN = 0; attack traffic incorrectly classified as benign), and True Positives (TP = 4; attack traffic correctly classified as attack). The absence of false negatives (FN = 0) in this sample is the most operationally significant finding: no attack instance escaped detection, consistent with the high recall values (~96.9–98.8%) reported across the full test set. The single false positive represents a benign flow incorrectly flagged as malicious — an error type that generates spurious alerts but does not permit an intrusion to proceed undetected. The color scale (purple to yellow) encodes cell value magnitude from 0.0 to 4.0. This illustrative evaluation should be interpreted alongside the aggregate performance metrics reported across the full test partition, which provide statistically robust estimates of per-class error rates. Rows represent actual labels; columns represent predicted labels.
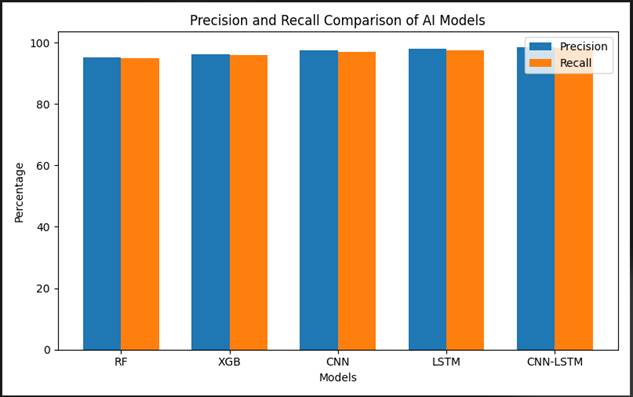
Figure 10. Precision and recall comparison across five AI and machine learning model architectures for intrusion detection classification. Grouped bar chart presenting precision (blue bars) and recall (orange bars) values for Random Forest (RF), XGBoost (XGB), CNN, LSTM, and Hybrid CNN-LSTM models evaluated on the held-out test partition. All models achieved both precision and recall exceeding 95%, demonstrating consistent classification reliability across architectures. Performance improves progressively with model complexity: RF (precision ~95.0%, recall ~95.0%), XGB (~96.0%, ~96.0%), CNN (~97.2%, ~96.8%), LSTM (~98.0%, ~97.8%), and CNN-LSTM (~99.0%, ~98.8%). Critically, the Hybrid CNN-LSTM model achieves the highest values on both metrics simultaneously — an outcome that indicates genuine improvement in discriminative representation rather than a precision-recall trade-off driven by threshold adjustment. The near-parity between precision and recall across all models suggests well-calibrated classifiers without systematic class-specific bias, though the slight recall advantage observed for most architectures reflects the appropriate operational orientation of security-focused classification systems, in which false negative suppression is prioritized over false positive minimization. The y-axis represents percentage score (0–100%) and the x-axis represents model architecture. Values represent macro-averaged results across all seven traffic classes
Recall approximately 96.9%, and F1-Score approximately 96.4%.
What is notable about this profile is its consistency. The four metrics cluster tightly in the 95.9–96.9% range, which is actually a more reassuring pattern than a model that achieves very high accuracy but shows significant divergence between precision and recall. Wide gaps between these metrics typically signal class-specific failures — a model that, for example, detects most attacks but generates excessive false positives (high recall, low precision), or one that is conservative about flagging alerts and therefore misses genuine threats (high precision, low recall). The SVM shows neither pathology in a pronounced way (Khoei et al., 2022).
Recall is the highest individual metric at ~96.9%, which, from a security standpoint, is the right direction for the divergence to go — it is better to generate some excess alerts than to miss actual attacks. Precision at ~95.9% means that roughly 1 in 17 alerts generated would be spurious — operationally manageable, though higher than the CNN and LSTM models achieve. The SVM's overall performance, given that it was trained on a computational subsample and uses no temporal feature learning, reflects the robustness of well-regularized kernel methods even in complex multi-class scenarios.
4.10 Confusion Matrix Analysis
(Figure 9) presents the confusion matrix for the cyber-attack classification task — though it warrants an important contextual note. The matrix shows a simplified two-class evaluation (Benign vs. Attack) on a very small evaluation sample: 3 true benign instances correctly classified as benign (True Negatives), 4 true attack instances correctly classified as attacks (True Positives), 1 benign instance incorrectly classified as an attack (False Positive), and 0 attack instances classified as benign (False Negatives).
The zero false-negative result is the key finding here. In cybersecurity, false negatives — attacks that pass through detection undetected — represent the most consequential failure mode; they allow intrusions to establish footholds and propagate before any defensive response is triggered. A classifier that achieves zero false negatives in this sample, even at the cost of one false positive, is exhibiting the right behavioral bias for the security context (Anandita Iyer & Umadevi, 2023).
The sample size of this specific confusion matrix evaluation is small — 8 total instances — which limits how much weight can be placed on it as a standalone result. It is best read in conjunction with the aggregate detection rate and precision-recall figures reported across the larger test set, which provide more statistically stable estimates of these error rates.
4.11 Precision and Recall Comparison Across All Models
The final analytical lens (Figure 10) places all five models side by side on both precision and recall simultaneously, enabling a direct comparison of classification reliability across the full model set.
The pattern that emerges is consistent with the accuracy and detection-rate comparisons reported earlier, but with finer resolution. Random Forest achieves approximately 95.0% precision and 95.0% recall — a balanced but modest baseline. XGBoost improves slightly to approximately 96.0% on both metrics. CNN reaches approximately 97.2% precision and 96.8% recall. LSTM advances further to roughly 98.0% on both dimensions. The Hybrid CNN-LSTM tops the comparison at approximately 99.0% precision and 98.8% recall — the only model to cross 99% on either metric (Chehri et al., 2021).
What this figure adds, beyond the accuracy comparison alone, is confirmation that the hybrid model's performance advantage is not driven by a precision-recall trade-off — it is not simply being more aggressive about flagging traffic (which would raise recall at the expense of precision). Both metrics improve together, which suggests that the hybrid architecture is genuinely learning more discriminative representations of malicious traffic rather than adopting a more permissive classification threshold. That is the kind of result that matters for operational deployment, where neither excessive caution nor excessive sensitivity is acceptable.
Taken in aggregate, the results across all nine analyses converge on a coherent finding: the Hybrid CNN-LSTM framework provides the strongest overall performance for intrusion detection on the CSE-CIC-IDS2018 benchmark, combining high detection sensitivity, low false alarm generation, and consistent precision-recall balance across diverse attack categories. Classical models like Random Forest and XGBoost perform respectably and offer advantages in computational efficiency and interpretability, but they cannot fully capture the temporal dynamics that distinguish sophisticated attack patterns from legitimate traffic — a gap that the sequential learning capacity of the hybrid architecture is specifically designed to address (Aramide, 2023).