Data Modeling

Mathematical and Computational Data Modeling
1
Citations
7k
Views
37
Articles
Your new experience awaits. Try the new design now and help us make it even better
Switch to the new experience
Figures and Tables
RESEARCH ARTICLE   (Open Access)

Deep Learning-Based Osteoporosis Screening from Lumbar Spine X-ray Images: A CNN Approach Compared with DXA

Md. Nesar Uddin1*, Kamruzzaman Mithu 1, Md. Ataur Rahman1, Shahanara Begum 2, Khondaker Abdullah Al Mamun1

+ Author Affiliations

Data Modeling 6 (1) 1-10 https://doi.org/10.25163/data.6110745

Submitted: 31 December 2024 Revised: 28 February 2025  Published: 08 March 2025 


Abstract

Osteoporosis, a condition often progressing silently until fracture occurs, continues to pose a substantial clinical and public health burden worldwide. While dual-energy X-ray absorptiometry (DXA) remains the gold standard for diagnosis, its limited accessibility and underutilization raise important questions about alternative screening strategies. In this context, the present study explores whether deep learning—specifically convolutional neural networks (CNNs)—might offer a complementary approach using routinely acquired lumbar spine X-ray images. A retrospective multicenter dataset comprising 1,255 postmenopausal women and 2,510 radiographic images was analyzed. Regions of interest were manually identified, and a dual-channel CNN model was developed using anteroposterior and lateral views. Model predictions were evaluated against DXA-derived bone mineral density classifications based on World Health Organization criteria. Performance was assessed using area under the receiver operating characteristic curve (AUC), sensitivity, and specificity. The model demonstrated moderate diagnostic capability. In the validation dataset, osteoporosis detection achieved an AUC of 0.786, with sensitivity of 60.6% and specificity of 85.5%. In independent test datasets, AUC values ranged from 0.726 to 0.810, with variability observed across imaging channels and classification categories. Notably, sensitivity for osteopenia detection improved in certain configurations, suggesting differential feature representation across views. Although these findings do not yet support clinical replacement of DXA, they suggest that deep learning applied to routine radiographs may provide a feasible adjunct screening tool. Further refinement, validation, and integration with clinical risk factors will be essential before such approaches can be meaningfully translated into practice.

Keywords: Osteoporosis, Deep Learning, Convolutional Neural Network, Lumbar Spine X-ray, Bone Mineral Density.

1. Introduction

Osteoporosis, though often described in clinical terms as a reduction in bone mass and microarchitectural deterioration, is perhaps better understood as a quietly progressive condition—one that tends to remain unnoticed until it manifests through fragility fractures. These fractures, affecting millions globally each year, represent not only a biological failure of bone strength but also a substantial burden on healthcare systems and quality of life. It has been estimated that nearly 8.9 million fractures annually are attributable to osteoporosis, a figure that continues to rise with aging populations (Cheung et al., 2016). Despite this, early detection remains inconsistent, and in many cases, delayed.

Clinically, osteoporosis is most commonly diagnosed using bone mineral density (BMD) measurements obtained through dual-energy X-ray absorptiometry (DXA), which remains the gold standard. The widely adopted T-score classification—defining osteoporosis at ≤ −2.5 standard deviations and osteopenia between −1.0 and −2.5—provides a standardized diagnostic threshold (Dimai, 2017). Yet, even as this framework offers clarity, it does not fully capture the complexity of fracture risk. Bone strength is not determined by density alone; factors such as bone geometry, trabecular integrity, and patient-specific clinical variables play equally critical roles. Tools like FRAX have attempted to bridge this gap by incorporating clinical risk factors alongside BMD, offering a more holistic risk estimation (Curry et al., 2018). Still, the reliance on DXA introduces practical challenges—limited accessibility, cost constraints, and underutilization in certain populations.

Interestingly, the issue is not merely one of underuse. Some studies suggest a paradoxical pattern: over-screening among low-risk individuals and under-screening among those at higher risk (Amarnath et al., 2015). This imbalance raises questions about how screening strategies are implemented in real-world settings and whether alternative, more accessible diagnostic pathways might help address these disparities. In this context, routine imaging modalities—particularly plain radiographs—begin to appear as an underexplored opportunity.

Lumbar spine X-rays, for instance, are frequently obtained for a variety of clinical indications unrelated to osteoporosis. Yet, embedded within these images may lie subtle structural patterns indicative of reduced bone density—patterns that are not easily discernible through conventional visual assessment. It is here that machine learning, and more specifically deep learning, begins to offer a compelling possibility. Over the past decade, advances in artificial intelligence have enabled models to identify complex, high-dimensional relationships within medical imaging data—relationships that may escape even experienced clinicians (LeCun et al., 2015; Esteva et al., 2019).

Convolutional neural networks (CNNs), in particular, have demonstrated considerable success in image-based diagnostic tasks, ranging from dermatological classification to radiological interpretation. Their ability to automatically extract hierarchical features from raw pixel data makes them especially suited for applications in medical imaging. In the domain of osteoporosis, early investigations suggest that CNN-based approaches can potentially classify bone health status—normal, osteopenic, or osteoporotic—using standard radiographs. However, the extent to which these models can reliably approximate or complement DXA-based measurements remains an open question.

At the same time, it would be overly optimistic to assume that machine learning offers a straightforward solution. Concerns regarding model generalizability, data heterogeneity, and hidden biases continue to challenge the clinical translation of AI systems. Overfitting, in particular, remains a persistent issue, where models perform well on training data but fail to generalize to new populations (Lever et al., 2016). Moreover, variability in imaging protocols, patient demographics, and annotation practices introduces additional layers of complexity that are not easily resolved.

Against this backdrop, the present study seeks to explore a somewhat pragmatic question: can deep learning models, trained on routinely acquired lumbar spine X-ray images, serve as a viable adjunct—or at least a preliminary screening tool—for osteoporosis detection? More specifically, this work evaluates the feasibility of a CNN-based framework to classify osteopenia and osteoporosis using radiographic data, with DXA-derived BMD serving as the reference standard. By leveraging existing imaging data, such an approach may offer a cost-effective and scalable pathway toward improving screening coverage, particularly in settings where access to DXA is limited.

At the same time, this investigation does not assume that deep learning models can replace established diagnostic methods. Rather, it approaches the problem with a degree of caution—recognizing both the promise and the limitations of current AI methodologies. In doing so, the study aims to contribute not only to the technical development of diagnostic models but also to the broader conversation surrounding the responsible integration of artificial intelligence into clinical practice.

Ultimately, the challenge may not lie in choosing between traditional and emerging technologies, but in understanding how they can be meaningfully combined. And perhaps, in that intersection, there is an opportunity—one that is still unfolding—to rethink how osteoporosis is detected, assessed, and, ideally, prevented.
2. Methods

2.1 Study Design and Overview

This study was designed as a retrospective, multicenter diagnostic modeling investigation, aiming to explore—perhaps cautiously—the feasibility of using deep learning for osteoporosis screening based on routinely acquired lumbar spine X-ray images. While the broader motivation draws from the growing application of artificial intelligence in medical imaging, the methodological approach was intentionally grounded in clinically established reference standards, particularly dual-energy X-ray absorptiometry (DXA), which remains the accepted benchmark for bone mineral density (BMD) assessment (Dimai, 2017).

At its core, the study sought to compare model-derived classifications—normal bone density, osteopenia, and osteoporosis—against DXA-defined categories, following the World Health Organization (WHO) criteria. In doing so, the intention was not necessarily to replace DXA, but rather to evaluate whether a complementary, lower-cost screening pathway might be technically plausible.

2.2 Data Source and Study Population

Lumbar spine X-ray images and corresponding DXA measurements were retrospectively collected from hospital-based image archiving and communication systems (PACS). The study population consisted of postmenopausal women aged 50 years and older, reflecting the demographic group most commonly affected by osteoporosis.

Inclusion criteria were defined with some care. Participants were required to have undergone both lumbar spine radiography (anteroposterior and lateral views) and DXA scanning within a three-month interval, ensuring temporal consistency between imaging modalities. Additionally, individuals must not have received any treatment affecting bone metabolism during this period (Amarnath et al., 2015).

Exclusion criteria were applied to minimize confounding structural abnormalities. These included:

  • Prior lumbar spine surgery (e.g., internal fixation or vertebroplasty)
  • Presence of spinal tumors or inflammatory diseases (e.g., ankylosing spondylitis, tuberculosis)
  • Severe spinal deformities such as scoliosis
  • Poor image quality, particularly low signal-to-noise ratio
  • Inability to accurately map regions of interest (ROIs)

After applying these criteria, a total of 910 patients (1820 images) were included in the primary dataset, with additional independent datasets used for testing.

2.3 Dataset Partitioning

The dataset was divided into training, validation, and test subsets in a manner intended to preserve independence between model development and evaluation phases.

  • Training dataset: 1820 images from 910 patients
  • Internal validation dataset: Derived from training cohort (8:1 split)
  • Test dataset 1: 1396 images from 198 patients
  • Test dataset 2: 2294 images from 147 patients

While the partitioning was randomized, care was taken to ensure that patient-level separation was maintained, thereby reducing the risk of data leakage—a known concern in machine learning studies (Lever et al., 2016).

2.4 Reference Standard and Outcome Definition

Bone mineral density values obtained from DXA were used as the reference standard for classification. T-scores were calculated using a standardized reference population, and patients were categorized according to WHO criteria:

  • Normal: T-score ≥ −1.0
  • Osteopenia: −2.5 < T-score < −1.0
  • Osteoporosis: T-score ≤ −2.5

These thresholds, while widely accepted, are not without limitations, as they primarily reflect population-level risk rather than individualized fracture probability (Dimai, 2017). Nonetheless, they provide a consistent framework for supervised learning.

2.5 Image Preprocessing and ROI Selection

Image preprocessing was performed to reduce variability arising from differences in acquisition parameters. This included normalization of grayscale intensity, adjustment of window width and level, and pixel-level standardization.

Regions of interest (ROIs) were manually annotated by four experienced radiologists (10–20 years of experience), focusing specifically on trabecular bone regions within lumbar vertebrae L1–L4. Cortical bone structures were intentionally excluded, as trabecular bone is more sensitive to early osteoporotic changes.

Each ROI was then extracted into fixed-size image patches (64 × 64 pixels), which served as input to the deep learning model. While manual ROI selection introduces a degree of subjectivity, it was considered necessary to ensure anatomical relevance in the absence of automated segmentation tools.

2.6 Deep Learning Model Architecture

A convolutional neural network (CNN) architecture was developed with a dual-channel design, incorporating both anteroposterior and lateral X-ray views. Each channel followed an identical structure, consisting of sequential convolutional, activation, and pooling layers.

Specifically, the model included:

  • Five convolutional layers (kernel size: 4 × 4)
  • Increasing filter depths: 32, 64, 64, 128, and 256
  • Rectified Linear Unit (ReLU) activation functions to introduce non-linearity
  • Batch normalization to improve convergence stability (LeCun et al., 2015)
  • A max-pooling layer after the third convolutional block to reduce spatial dimensions

Feature maps from both channels were subsequently flattened and combined before passing through a fully connected dense layer with three output neurons corresponding to the classification categories.

2.7 Model Training and Statistical Analysis

Model training was conducted using Python (version 3.6.7), while statistical analyses were performed using R software (version 3.0.2) and MedCalc. All experiments were executed on a system equipped with an NVIDIA Titan X GPU and 128 GB RAM.

Performance was evaluated using standard diagnostic metrics, including:

  • Area under the receiver operating characteristic curve (AUC)
  • Sensitivity
  • Specificity

All statistical tests were two-tailed, with a significance threshold set at p < 0.05.

2.8 Quality Assessment and Reporting Standards

To enhance methodological transparency, study quality was evaluated using the MI-CLAIM checklist, which assesses clinical AI studies across six domains: study design, data preparation, model development, performance evaluation, interpretability, and reproducibility (Esteva et al., 2019).

In addition, reporting was guided—at least in principle—by established frameworks for diagnostic accuracy and predictive modeling studies, including TRIPOD recommendations. While not all elements could be fully addressed, efforts were made to provide sufficient detail to allow replication.

2.9 Ethical Considerations

As this study involved retrospective analysis of anonymized imaging data, formal patient consent was waived. Data handling procedures adhered to institutional guidelines for confidentiality and ethical research practice.

3. Results

3.1 Study Population and Dataset Characteristics

After applying the predefined inclusion and exclusion criteria, a total of 1,255 postmenopausal women were included in the final analysis. The mean age of the study population was 65.8 ± 9.1 years, spanning a relatively wide range from 50 to 92 years, which—interestingly—captures both early and advanced stages of postmenopausal bone loss. In total, 2,510 lumbar spine X-ray images were analyzed, comprising paired anteroposterior and lateral views for each participant.

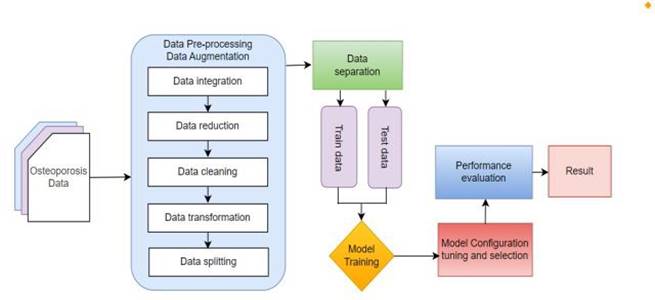
Figure 1. Proposed methodology for deep learning-based osteoporosis screening. This figure presents the overall workflow of the proposed diagnostic framework. The process begins with lumbar spine X-ray image acquisition, followed by preprocessing steps including resizing and grayscale normalization to reduce variability across images. Regions of interest (ROIs) are then identified within the trabecular bone of vertebrae L1–L4. These processed inputs are subsequently fed into a dual-channel convolutional neural network (CNN), incorporating both anteroposterior and lateral views. Finally, the model performs classification into three categories—normal bone density, osteopenia, and osteoporosis—based on learned feature representations.

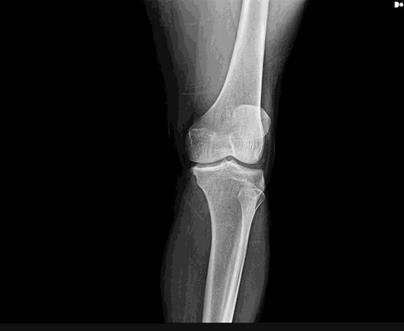
Figure 2. Representative example of lumbar spine X-ray image. This figure illustrates a typical raw lumbar spine X-ray image used in the study prior to preprocessing. The image highlights the anatomical structure of the vertebral bodies, providing a visual reference for the region of interest (ROI) selection process. Subtle variations in trabecular bone texture, which may not be readily apparent to the human eye, form the basis for subsequent deep learning-based feature extraction.

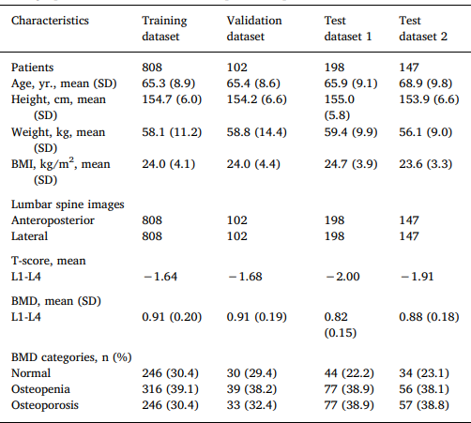
Figure 3. Distribution of categorical and continuous variables in the study population. This figure summarizes the baseline characteristics of the study cohort. Categorical variables are presented as frequencies (n), while continuous variables are expressed as mean ± standard deviation (SD). The figure provides an overview of demographic and clinical parameters across the dataset, supporting the comparability of training, validation, and test subsets.

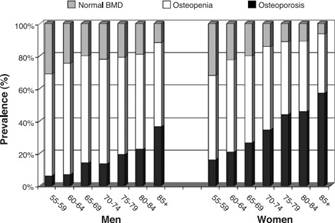
Figure 4. Prevalence of osteoporosis stratified by gender and T-score categories. This figure depicts the distribution of osteoporosis prevalence across male and female participants based on gender-specific T-score classifications. The visualization highlights differences in bone mineral density status, with a higher burden of osteoporosis observed among women, consistent with known epidemiological patterns in postmenopausal populations.

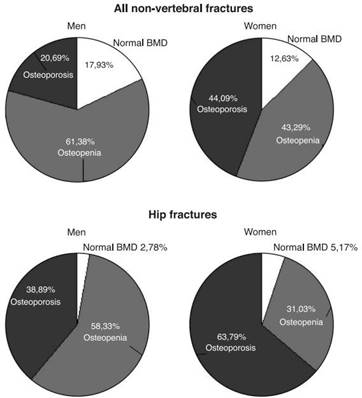
Figure 5. Proportion of osteoporosis cases by gender. This figure presents the percentage distribution of osteoporosis among male and female participants within the study population. The comparison emphasizes gender-related disparities in disease prevalence, reflecting the increased susceptibility of women to bone density loss following menopause.

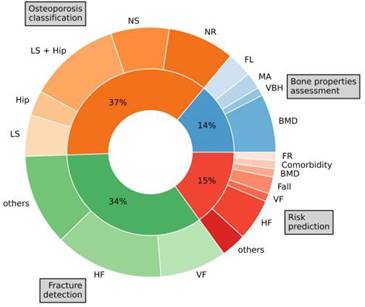
Figure 6. Overview of research domains in osteoporosis-related studies. This figure provides a conceptual summary of the major research areas investigated in the context of osteoporosis. These include diagnostic imaging, machine learning applications, fracture risk prediction, and clinical management strategies. The figure reflects the evolving landscape of osteoporosis research, with increasing integration of artificial intelligence and data-driven methodologies

The dataset was divided into training, validation, and two independent test cohorts. Baseline demographic variables, particularly age and body mass index (BMI), appeared broadly consistent across all subsets, suggesting that the dataset partitioning did not introduce obvious sampling bias (Table 1). That said, subtle differences in disease prevalence were observed. Specifically, the proportion of patients classified as osteoporotic ranged from 30.4% in the training dataset to approximately 39.9% in one of the test datasets, while osteopenia prevalence remained relatively stable across cohorts (Table 1). These variations, although not dramatic, may still influence model generalizability and performance stability.

3.2 Model Performance in Validation Dataset

The performance of the convolutional neural network (CNN) model was first evaluated using the internal validation dataset. When both anteroposterior and lateral imaging channels were combined, the model achieved its highest performance for osteoporosis detection, with an area under the receiver operating characteristic curve (AUC) of 0.786 (95% CI: 0.693–0.861). Sensitivity and specificity were 60.6% and 85.5%, respectively (Table 2).

At first glance, these findings appear moderately encouraging. The relatively high specificity suggests that the model is reasonably effective in correctly identifying non-osteoporotic individuals, which may be clinically useful in reducing false positives. However, the sensitivity—hovering just above 60%—indicates that a considerable proportion of true osteoporotic cases may still go undetected. This imbalance, while not unexpected in early-stage AI models, highlights a potential limitation for screening applications.

For osteopenia classification, the model demonstrated slightly lower performance, with an AUC of 0.743 (95% CI: 0.647–0.824), sensitivity of 46.7%, and specificity of 88.9% (Table 2). The reduced sensitivity in this category is perhaps not surprising, given that osteopenia represents an intermediate state with subtler radiographic changes, making it inherently more challenging to distinguish from normal bone density.

3.3 Model Performance in Independent Test Datasets

To assess generalizability, the trained model was evaluated on two independent test datasets. In test dataset 2, the combined-channel model achieved an AUC of 0.726 (95% CI: 0.646–0.796) for osteoporosis detection, with sensitivity improving to 68.4% (Table 2). While the AUC decreased slightly compared to the validation set, the increase in sensitivity suggests that the model may be more effective in identifying true positive cases in unseen data.

Interestingly, when evaluating osteopenia detection in the same test dataset, the anteroposterior channel alone yielded the highest AUC of 0.810 (95% CI: 0.737–0.870), with a notably higher sensitivity of 85.3%. This somewhat unexpected finding raises the possibility that certain imaging views may carry more discriminative information for specific diagnostic categories.

Taken together, these results suggest that while the model demonstrates moderate predictive capability, its performance varies depending on both the dataset and classification target. Such variability, although common in machine learning studies, underscores the need for cautious interpretation.

3.4 Epidemiological Observations

Beyond model performance, the study also provided insights into the distribution of osteoporosis across the study population. As illustrated in (Fig. 4) and (Fig. 5), the prevalence of osteoporosis varied by gender and T-score classification, with women exhibiting higher rates of low bone density. These patterns align with established epidemiological evidence highlighting postmenopausal women as a high-risk group (Cheung et al., 2016).

Additionally, the distribution of study tasks related to osteoporosis research—summarized in (Fig. 6)—suggests that imaging-based approaches are increasingly being explored, reflecting a broader shift toward data-driven diagnostic frameworks.

4. Discussion

4.1 Interpretation of Key Findings

At a broad level, the findings of this study suggest that deep learning models, particularly CNN-based architectures, may hold promise as adjunct tools for osteoporosis screening using routine lumbar spine radiographs. However, this promise—while certainly intriguing—appears to come with several caveats.

The model demonstrated moderate diagnostic performance, with AUC values generally ranging between 0.72 and 0.79 across datasets. These values, although respectable, fall short of the reliability typically expected for standalone clinical diagnostic tools. In particular, the relatively modest sensitivity observed in some scenarios raises concerns about missed diagnoses, which could have significant implications in a screening context.

That said, it may be more appropriate to view these results not as definitive evidence of clinical readiness, but rather as an indication of feasibility. The ability to extract meaningful diagnostic signals from standard X-ray images—without requiring additional imaging or radiation exposure—represents a potentially valuable step forward.

4.2 Comparison with Existing Diagnostic Approaches

DXA remains the gold standard for BMD assessment, offering precise and quantitative measurements of bone density (Dimai, 2017). However, its availability is often limited, particularly in resource-constrained settings. Alternative methods, such as quantitative computed tomography (QCT), provide additional insights but come with higher radiation exposure and cost (Ferizi et al., 2019).

In contrast, X-ray imaging is widely accessible and routinely performed, making it an attractive candidate for opportunistic screening. The present study builds on this idea by demonstrating that AI models can, to some extent, approximate DXA-based classifications. While the accuracy is not yet comparable, the trade-off between accessibility and precision may still justify further exploration.

4.3 Strengths and Contributions

One of the notable strengths of this study lies in its use of real-world clinical data, including multiple independent test datasets. This design—while not without limitations—helps provide a more realistic assessment of model performance compared to purely experimental setups.

Additionally, the dual-channel CNN architecture, incorporating both anteroposterior and lateral views, reflects an effort to capture complementary anatomical information. The involvement of experienced radiologists in ROI selection further enhances the clinical relevance of the input data, although it also introduces potential subjectivity.

4.4 Limitations

Several limitations should be acknowledged, perhaps more explicitly than is often comfortable. First, the retrospective design inherently limits control over data quality and consistency. Variations in imaging protocols, patient positioning, and equipment may have influenced model performance in ways that are difficult to quantify.

Second, the reliance on manually annotated ROIs introduces observer dependency, which could affect reproducibility. Automated segmentation methods, although more complex, may offer a more scalable solution in future studies.

Third, the model’s performance—while moderate—remains insufficient for clinical deployment without further validation. Issues such as overfitting and dataset bias, well-documented in machine learning research (Lever et al., 2016), cannot be entirely ruled out.

4.5 Future Directions

Looking ahead, several avenues for improvement emerge. Incorporating larger and more diverse datasets could enhance model robustness and generalizability. Integration of clinical risk factors—such as those used in FRAX—may also improve predictive performance by providing contextual information (Curry et al., 2018).

Furthermore, prospective studies will be essential to evaluate real-world applicability. It may also be worthwhile to explore hybrid models that combine imaging data with other modalities, potentially offering a more comprehensive assessment of fracture risk.

4.6 Clinical Implications

While it would be premature to suggest that deep learning models can replace DXA, the findings do point toward a complementary role. In settings where DXA is unavailable or underutilized, AI-assisted analysis of routine X-rays could serve as an initial screening step, identifying individuals who may benefit from further evaluation.

In that sense, the value of this approach may lie not in its precision alone, but in its accessibility. And perhaps, as these models continue to evolve, their role in clinical decision-making will become clearer—if not entirely straightforward.

5. Conclusion

In reflecting on the findings, it becomes increasingly clear that while deep learning offers a compelling new direction for osteoporosis screening, its role—at least for now—remains supportive rather than definitive. The CNN-based model demonstrated a moderate ability to classify bone health status using lumbar spine X-rays, suggesting that diagnostically relevant patterns do exist within routinely acquired radiographs. Yet, the variability in performance, particularly in sensitivity, raises important considerations about reliability in real-world settings.

DXA, despite its limitations, continues to provide a level of precision that current AI models have not fully matched (Dimai, 2017). However, the accessibility of X-ray imaging presents an opportunity—perhaps not to replace, but to extend screening reach, especially in under-resourced environments. What emerges from this study is less a conclusion and more a direction: that combining traditional diagnostic standards with evolving computational methods may offer a more inclusive approach to early detection.

Future work, ideally prospective and multi-institutional, will be necessary to refine these models, address inherent biases, and better understand how they might integrate into clinical workflows without introducing unintended risks.

Author Contribution

M.N.U. conceived and designed the study, coordinated data collection across centers, supervised the overall research, and drafted the manuscript. K.M. contributed to model development, performed data analysis, and assisted with manuscript preparation. M.A.R. performed image annotation, region-of-interest identification, and contributed to model evaluation. S.B. contributed to clinical data interpretation and DXA-based classification validation. K.A.A.M. supervised the study, provided critical guidance on methodology, and critically reviewed and revised the manuscript. All authors read and approved the final manuscript.

Acknowledgement

The authors M.N.U. et al., would like to thank the postmenopausal women who participated in this study and the participating centers for providing the retrospective radiographic dataset. The authors also acknowledge the institutional and technical support that facilitated data analysis and model development.

Competing Financial Interests

The authors M.N.U. et al.,  declare no competing financial interests.

References


Amarnath, A. L., Franks, P., Robbins, J. A., Xing, G., & Fenton, J. J. (2015). Underuse and overuse of osteoporosis screening in a regional health system: A retrospective cohort study. Journal of General Internal Medicine, 30(12), 1733–1740.

Brown, C. (2017). Osteoporosis: Staying strong. Nature, 550, S15–S17.

Centers for Medicare & Medicaid Services. (2019). National physician fee schedule. Retrieved April 17, 2019, from http://www.cms.hhs.gov/PFSlookup/

Cheung, A. M., Papaioannou, A., Morin, S., & Osteoporosis Canada Scientific Advisory Council. (2016). Postmenopausal osteoporosis. New England Journal of Medicine, 374, 2096.

Curry, S. J., Krist, A. H., Owens, D. K., Barry, M. J., Caughey, A. B., Davidson, K. W., Doubeni, C. A., Epling, J. W., Kemper, A. R., Kubik, M., Landefeld, C. S., Mangione, C. M., Silverstein, M., Simon, M. A., Tseng, C. W., & Wong, J. B. (2018). Screening for osteoporosis to prevent fractures: U.S. Preventive Services Task Force recommendation statement. JAMA, 319(24), 2521–2531.

Dimai, H. P. (2017). Use of dual-energy X-ray absorptiometry (DXA) for diagnosis and fracture risk assessment: WHO criteria, T- and Z-score, and reference databases. Bone, 104, 39–43.

Erhan, D., Bengio, Y., Courville, A., Manzagol, P.-A., Vincent, P., & Bengio, S. (2010). Why does unsupervised pre-training help deep learning? Journal of Machine Learning Research, 11, 625–660.

Esteva, A., Robicquet, A., Ramsundar, B., Kuleshov, V., DePristo, M., Chou, K., Cui, C., Corrado, G., Thrun, S., & Dean, J. (2019). A guide to deep learning in healthcare. Nature Medicine, 25, 24–29.

Ferizi, U., Honig, S., & Chang, G. (2019). Artificial intelligence, osteoporosis and fragility fractures. Current Opinion in Rheumatology, 31(4), 368–375.

King, A. B., & Fiorentino, D. M. (2011). Medicare payment cuts for osteoporosis testing reduced use despite tests’ benefit in reducing fractures. Health Affairs, 30(12), 2362–2370.

LeCun, Y., Bengio, Y., & Hinton, G. (2015). Deep learning. Nature, 521, 436–444.

Lever, J., Krzywinski, M., & Altman, N. (2016). Model selection and overfitting. Nature Methods, 13(9), 703–704.

National Health Commission of China. (2019). Epidemiological investigation of osteoporosis in China. Retrieved May 15, 2019, from http://www.phsciencedata.cn/Share/jsp/PublishManager/foregroundView/1/9eaadbb3-bd64-4531-9d9f-753ec183f26d.html

Schuit, S. C., van der Klift, M., Weel, A. E., de Laet, C. E., Burger, H., Seeman, E., Hofman, A., Uitterlinden, A. G., & Pols, H. A. (2004). Fracture incidence and association with bone mineral density in elderly men and women: The Rotterdam Study. Bone, 34(1), 195–202.

U.S. Preventive Services Task Force. (2002). Screening for osteoporosis in postmenopausal women: Recommendations and rationale. American Family Physician, 66(8), 1430–1432.

Wainwright, S. A., Marshall, L. M., Ensrud, K. E., Cauley, J. A., Black, D. M., Hillier, T. A., Hochberg, M. C., Vogt, M. T., Orwoll, E. S., & Study of Osteoporotic Fractures Research Group. (2005). Hip fracture in women without osteoporosis. Journal of Clinical Endocrinology & Metabolism, 90(5), 2787–2793.