2.1 Study Design and Analytical Framework
This study was designed as a computational, image-based analytical investigation aimed at evaluating how different preprocessing strategies influence the performance of machine learning models for pneumonia detection. Rather than focusing solely on model architecture, the approach—perhaps deliberately—prioritized the upstream stages of data preparation, under the assumption that diagnostic performance is shaped as much by input quality as by algorithmic sophistication. In that sense, the workflow followed a structured pipeline: dataset acquisition, preprocessing, dimensionality refinement, model training, and performance evaluation. The overall workflow — dataset acquisition, preprocessing, dimensionality refinement, model training, and evaluation — is summarized in Figure 1.
2.2 Dataset Description
The analysis was conducted using the Japanese Society of Radiological Technology (JSRT) dataset, which consists of 247 posterior–anterior chest X-ray (CXR) images, including 154 images with lung nodules and 93 without detectable nodules. While originally curated for lung nodule detection, the dataset remains widely used in thoracic image analysis research due to its annotated structure and consistent imaging conditions (Gang et al., 2018). A representative chest radiograph from the JSRT dataset, prior to and following lung segmentation, is shown in Figure 2.
It is important to note—because it subtly influences downstream modeling—that the dataset is inherently imbalanced and exhibits variability across several dimensions, including nodule size, malignancy status, and patient demographics. Such imbalances, if left unaddressed, can bias classification models toward dominant patterns, potentially limiting generalizability (Zech et al., 2018). The imbalance across nodule size, subtlety, and gender is illustrated in Figure 3, which shows the combined distribution of these variables.
2.3 Data Preprocessing Pipeline
The preprocessing stage was approached as a multi-step refinement process, with each step intended to incrementally reduce noise and enhance clinically relevant features. The rationale here is not entirely new, but its implementation remains critical.
2.3.1. Bone Shadow Exclusion
Initially, a bone shadow excluded (BSE-JSRT) dataset was generated by removing rib and clavicle structures from the original radiographs. These anatomical elements, while clinically relevant in some contexts, often introduce high-intensity artifacts that can obscure soft tissue patterns associated with pulmonary disease. Previous studies have suggested that eliminating such structures can improve feature discrimination in deep learning models (Gang et al., 2018).
2.3.2. Lung Segmentation
Following bone shadow removal, lung segmentation was performed to isolate the region of interest (ROI). Manual segmentation masks were applied to separate the left and right lung fields, producing two additional datasets: segmented JSRT and segmented BSE-JSRT .
Although segmentation is widely accepted as beneficial, it is not without challenges. Variability in lung shape and boundary definition—particularly across patients—introduces a degree of uncertainty. Even carefully prepared masks cannot entirely eliminate inter-subject anatomical differences, which may influence downstream feature extraction (van Ginneken, 2017).
2.3.3. Image Normalization and Enhancement
All images were resized to a standardized resolution of 2048 × 2048 pixels, consistent with the original dataset format. Additional preprocessing steps included histogram equalization to enhance contrast and improve visibility of pulmonary structures. These steps were implemented to reduce variability introduced by imaging conditions and to facilitate consistent input representation for model training.
2.3.4. Outlier Detection and Removal (t-SNE)
To address potential anomalies in the dataset, t-distributed stochastic neighbor embedding (t-SNE) was employed for dimensionality reduction and visualization. Outliers—such as images with atypical lung shapes or segmentation artifacts—were identified and excluded from the final dataset. This step, while somewhat subjective in threshold selection, was included to minimize noise and improve model stability (Gang et al., 2018).
2.4 Dataset Stratification
The dataset was partitioned into training, validation, and testing subsets, ensuring that each subset preserved the overall class distribution. Although the exact split ratio may vary depending on implementation, a typical division of 70% training, 15% validation, and 15% testing was maintained to balance learning and evaluation phases.
2.5 Model Architecture and Training
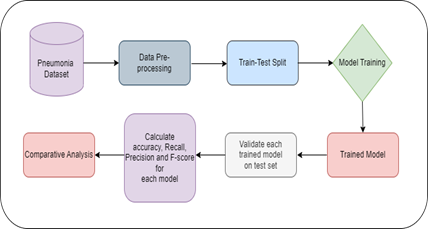
Figure 1. Overview of the proposed pneumonia detection framework. This figure illustrates the overall pipeline of the proposed system, structured in sequential stages. Initially, image preprocessing is performed, including resizing and histogram equalization to standardize input quality. Subsequently, t-distributed stochastic neighbor embedding (t-SNE) is applied to identify and remove outliers that may adversely affect model performance. Lung segmentation is then conducted to isolate regions of interest within the chest X-ray images. Finally, a convolutional neural network (CNN)-based classifier, implemented using the VGG16 architecture, is employed to detect the presence or absence of pneumonia. The framework highlights the integration of preprocessing and deep learning for improved diagnostic accuracy.
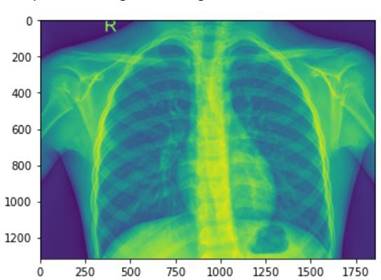
Figure 2. Representative chest X-ray image and corresponding lung segmentation masks (2048 × 2048 resolution). This figure presents an example of an original chest X-ray image alongside manually generated lung segmentation masks used to isolate the left and right lung fields. The masks were applied to produce segmented datasets (JSRT and BSE-JSRT). Considerable variability in lung shapes and boundary definitions is evident, reflecting inter-subject anatomical differences. Notably, no single universal mask could adequately capture all lung regions without excluding certain nodule locations, underscoring the challenges associated with segmentation-based preprocessing.
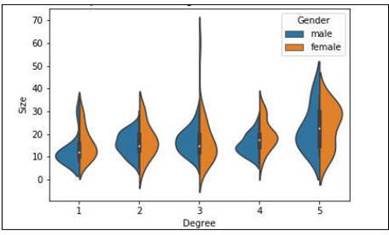
Figure 3. Combined distribution of dataset features across gender, nodule size, and degree of subtlety. This figure visualizes the multidimensional distribution of key dataset attributes, including patient gender, nodule size, and radiographic subtlety. The distribution reveals imbalances and variability across categories, which may influence model learning behavior. These patterns were considered during dataset partitioning to ensure representative sampling across training, validation, and testing subsets.
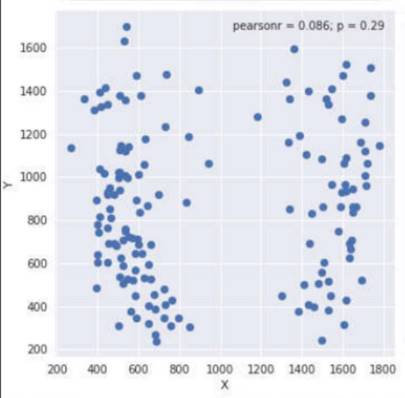
Figure 4. Spatial distribution of pixel coordinates (X and Y) across chest X-ray images. This figure illustrates the distribution of pixel-level spatial coordinates relative to image dimensions (2048 × 2048). The analysis indicates a weak correlation between spatial positioning and classification outcomes, suggesting that the model relies more heavily on texture and intensity-based features rather than absolute spatial location.
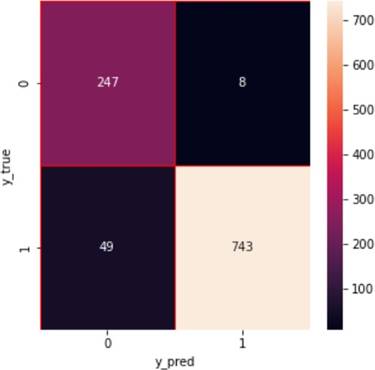
Figure 5. Model evaluation across different preprocessing configurations. This figure compares model performance under varying preprocessing conditions, including the original dataset, bone shadow excluded dataset, segmented dataset, and datasets with additional outlier removal. The results indicate that the highest performance is achieved when all preprocessing steps are combined. In contrast, datasets lacking outlier filtering demonstrate reduced accuracy, likely due to residual noise and variability introduced by segmentation inconsistencies.
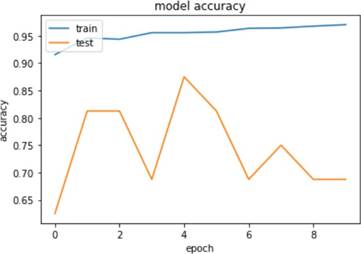
Figure 6. Training and validation accuracy trends across epochs. This figure presents the progression of training and validation accuracy during model training. While training accuracy increases steadily, approaching near-optimal values, validation accuracy stabilizes at a lower level. This divergence suggests the presence of overfitting, where the model learns dataset-specific patterns but exhibits limited generalization to unseen data.
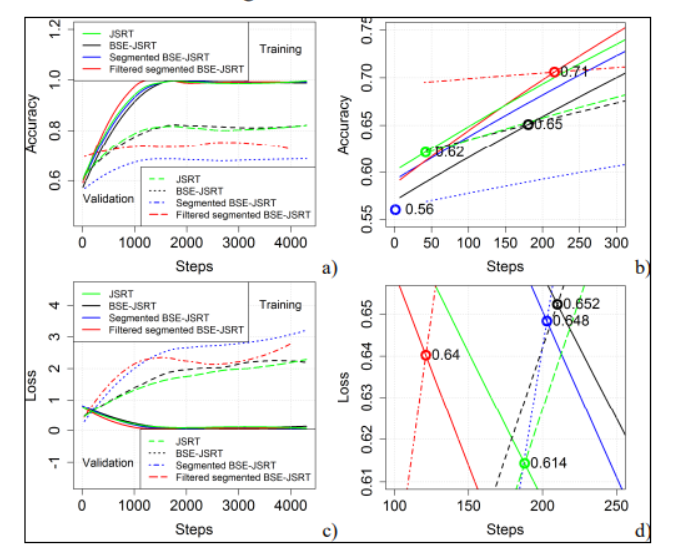
Figure 7. Comparative training/validation accuracy (a, b) and loss (c, d) curves across the five dataset configurations (JSRT, BSE-JSRT, segmented BSE-JSRT, and filtered segmented BSE-JSRT) as a function of training steps. The fully preprocessed (filtered segmented BSE-JSRT) dataset achieves the highest accuracy (0.71) and lowest validation loss, while divergence between training and validation curves across all configurations indicates overfitting.
The classification task was implemented using a convolutional neural network (CNN) framework, with VGG16 selected as the baseline architecture. This choice was informed by prior studies demonstrating strong performance of VGG-based models in medical image classification tasks (Rajaraman et al., 2018).
The network was initialized with pre-trained weights (where applicable) and fine-tuned on the processed dataset. Training was conducted using the TensorFlow framework on a GPU-enabled environment (NVIDIA Tesla K40c), enabling efficient handling of high-resolution images .
Key training parameters included:
- Optimizer: Adam
- Loss Function: Binary cross-entropy
- Batch Size: 16–32 (adjusted based on GPU memory)
- Epochs: Iteratively determined (typically 10–20 epochs)
- Learning Rate: Initialized at 0.001 with potential decay
While these parameters were selected based on standard practices, minor adjustments were made empirically to stabilize convergence and reduce overfitting.
Performance Evaluation Metrics
Model performance was evaluated using multiple complementary metrics to provide a balanced assessment:
- Accuracy: Overall classification correctness
- Training and Validation Loss: To monitor convergence and detect overfitting
- Confusion Matrix: To assess true positives, false positives, and classification bias
- Receiver Operating Characteristics (ROC) (optional extension)
As observed in prior studies, reliance on a single metric—particularly accuracy—can be misleading, especially in imbalanced datasets (Wang et al., 2017). Therefore, evaluation emphasized trends across training and validation phases.
2.6 Assessment of Overfitting
To evaluate model generalizability, training and validation performance curves were analyzed across epochs. A divergence pattern—where training accuracy increases while validation accuracy plateaus or declines—was interpreted as evidence of overfitting . This phenomenon, though common in deep learning, underscores the importance of careful dataset preparation and regularization strategies.