1. Introduction
The rapid growth of aquaculture over the past few decades has gradually transformed fish farming from a largely traditional practice into one of the most important food-producing sectors worldwide. Increasing pressure on natural fisheries, combined with the rising global demand for protein-rich food, has forced many countries to rely more heavily on aquaculture systems for sustainable food production. According to the Food and Agriculture Organization of the United Nations (UNFAO, 2012), global fishery production contributes substantially to human nutrition, supplying nearly 15% of animal protein intake worldwide, while average annual fish consumption per capita continues to remain high across many populations (UNFAO, 2012). This growing dependence on aquaculture is not merely an economic issue; rather, it is closely tied to food security, nutritional stability, and the broader sustainability of agricultural ecosystems. In many developing regions especially, aquaculture represents both livelihood and survival, making the maintenance of healthy aquatic environments increasingly critical for long-term productivity and public health (Zhu, 2010).
Despite the expansion of aquaculture technologies, maintaining a stable and healthy aquatic environment remains remarkably challenging. Fish are extremely sensitive organisms, and even relatively small fluctuations in water quality can create physiological stress, suppress immune response, reduce growth rates, and, in severe cases, lead to mass mortality events. Unlike terrestrial farming systems, aquatic ecosystems operate through a delicate balance of chemical, biological, and physical interactions. Parameters such as temperature, dissolved oxygen (DO), pH, turbidity, conductivity, salinity, alkalinity, nitrate concentration, and total dissolved solids (TDS) continuously influence one another in complex ways (Bhatnagar & Devi, 2013). A change in one variable often triggers a cascade of secondary effects across the entire aquatic environment. Consequently, aquaculture management increasingly depends on continuous monitoring rather than occasional manual observation.
Traditionally, water quality assessment in fish farming environments has relied heavily on manual inspection and periodic laboratory testing. While such approaches may provide acceptable measurements under controlled conditions, they are often time-consuming, labor-intensive, and economically impractical for many small- and medium-scale farmers. More importantly, intermittent measurements fail to capture real-time environmental fluctuations, which are common in aquaculture ponds. Water temperature, pH, and conductivity may vary substantially throughout the day due to photosynthetic activity, feeding behavior, rainfall, and microbial processes (Boyd, 1982). In practical farming scenarios, these rapid changes can occur long before a farmer becomes aware of the deteriorating conditions. As a result, the lack of real-time monitoring often delays intervention and increases production losses.
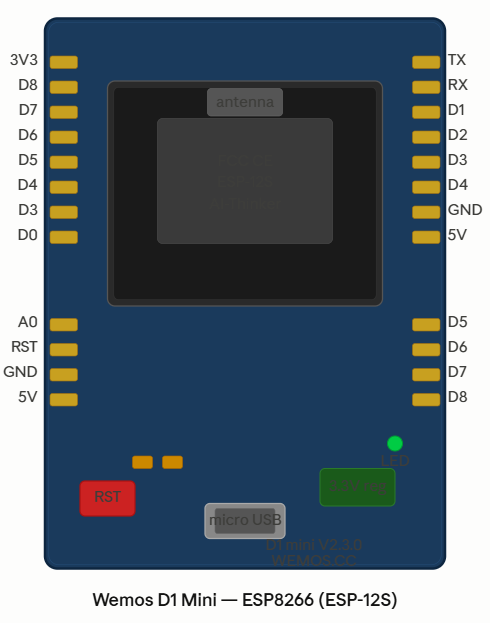
The emergence of the Internet of Things (IoT) has introduced a promising alternative to conventional aquaculture monitoring systems. IoT technologies allow interconnected sensors, microcontrollers, and communication devices to gather environmental data continuously and transmit those data remotely through wireless networks. Recent advances in low-cost microcontrollers and embedded systems have significantly accelerated the integration of IoT into agricultural and aquacultural applications. Devices such as ESP8266-based microcontrollers provide affordable Wi-Fi-enabled platforms capable of collecting and transmitting sensor information in real time, thereby reducing the need for expensive industrial monitoring infrastructure. This evolution has gradually shifted aquaculture management toward more intelligent and automated frameworks.
Several earlier studies have explored the application of IoT technologies in aquaculture monitoring. Raju and Varma (2018), for example, proposed a knowledge-based real-time aquaculture monitoring system utilizing sensors for dissolved oxygen, ammonia, salinity, nitrate, temperature, and pH. Their work demonstrated the potential of IoT-driven monitoring systems for improving aquaculture management efficiency. However, systems incorporating numerous sensors often become economically expensive and technically cumbersome for practical implementation, particularly in low-resource farming environments (Raju & Varma, 2018). Similarly, Kayalvizhi et al. (2015), Simbeye and Yang (2014), and Patil et al. (2015) investigated water monitoring approaches emphasizing parameters such as pH, turbidity, dissolved oxygen, and temperature. These studies contributed important insights into aquatic monitoring systems, yet many of them primarily focused on environmental sensing rather than predictive analysis of aquaculture health conditions (Kayalvizhi et al., 2015; Simbeye & Yang, 2014; Patil et al., 2015).
At the same time, IoT technologies have expanded broadly across agricultural domains beyond aquaculture. Israni et al. (2015) proposed an IoT-based agricultural framework emphasizing cloud-assisted accessibility of farming data, while Gondchawar and Kawitkar (2016) introduced smart agricultural systems incorporating automated irrigation, humidity sensing, and environmental monitoring. Although these studies differ from aquaculture-focused systems, they collectively highlight the increasing importance of remote sensing, automation, and cloud-based agricultural intelligence in modern food production systems (Israni et al., 2015; Gondchawar & Kawitkar, 2016).
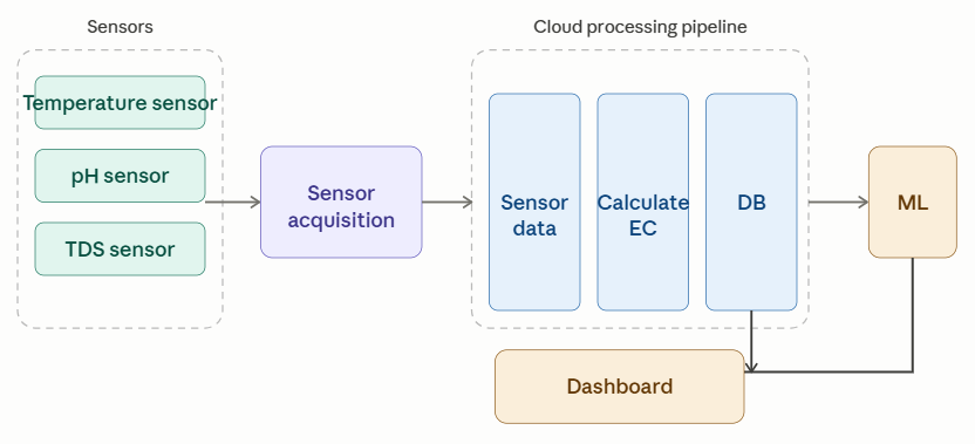
By combining low-cost IoT infrastructure with predictive analytics, this work aims to develop a comparatively affordable and practical framework for intelligent aquaculture monitoring. The overall conceptual workflow of the proposed IoT-driven aquaculture monitoring and prediction framework is illustrated in Figure 1.
Still, one issue remains somewhat underexplored. Many existing monitoring systems attempt to measure large numbers of environmental parameters simultaneously, often increasing hardware complexity and operational cost without necessarily improving prediction efficiency proportionally. In real-world aquaculture environments, certain parameters exert stronger systemic influence than others. Temperature, for instance, directly affects dissolved oxygen concentration, conductivity, salinity, and metabolic activity within aquatic ecosystems (Boyd, 1982; Bhatnagar et al., 2004). Likewise, pH is strongly associated with carbon dioxide concentration, ammonia toxicity, and broader biochemical reactions within pond environments (Delince, 2013). TDS and electrical conductivity similarly reflect dissolved mineral content and ionic concentration, both of which influence fish growth, larval development, and aquatic productivity (Bhatnagar & Devi, 2013).
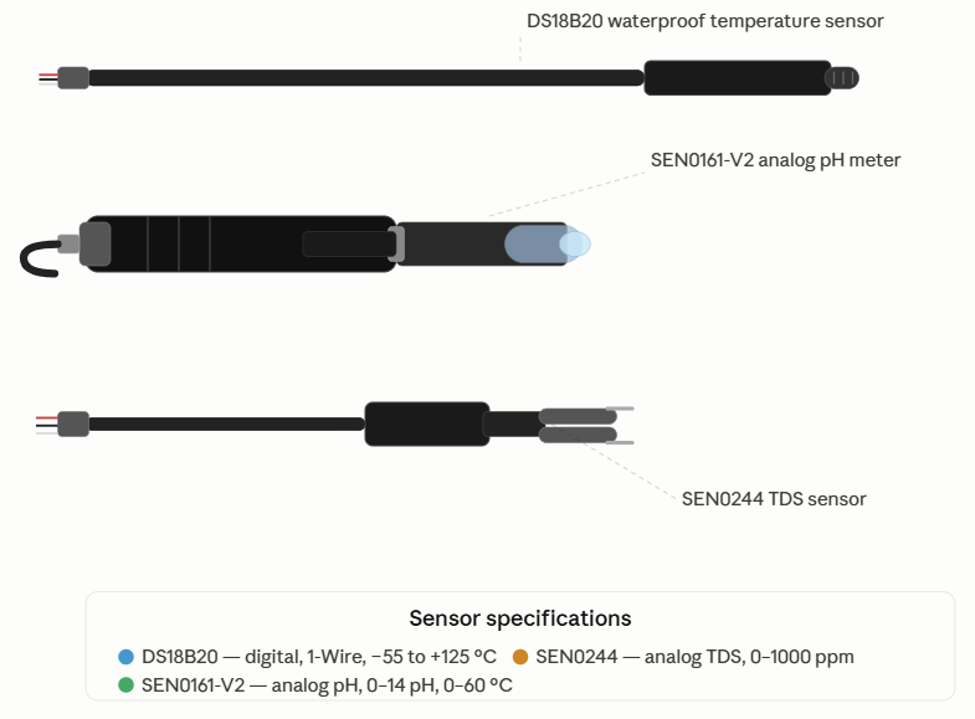
These interrelationships suggest that a smaller but carefully selected set of environmental parameters may provide sufficient predictive insight into overall aquaculture health. Such an approach could reduce system cost while maintaining acceptable predictive performance. This idea forms the conceptual basis of the present study. Rather than constructing a highly sensor-intensive platform, the proposed system focuses on four critical parameters—temperature, pH, TDS, and electrical conductivity—to evaluate aquaculture health conditions. These variables were selected based on their biological importance, interdependency, and relative ease of measurement and control.
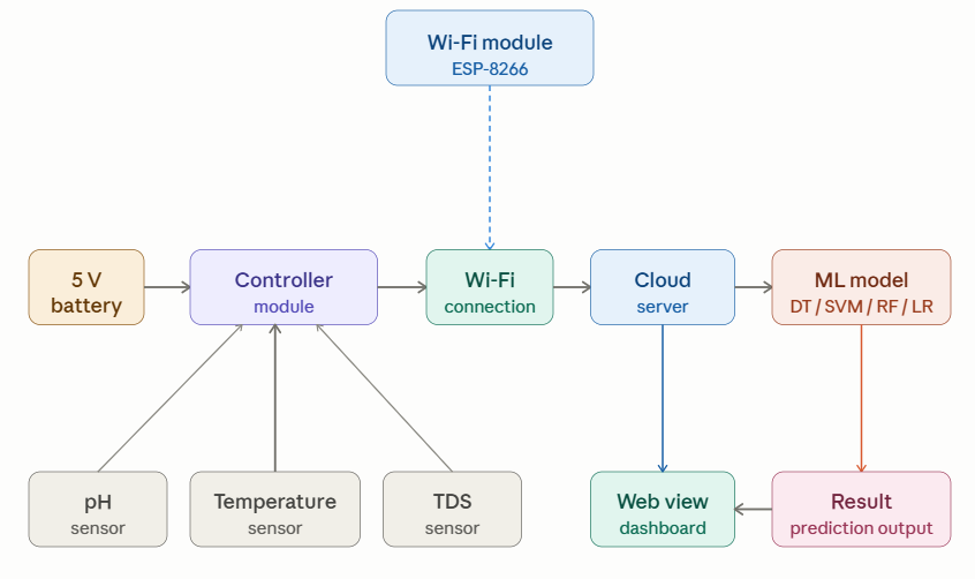
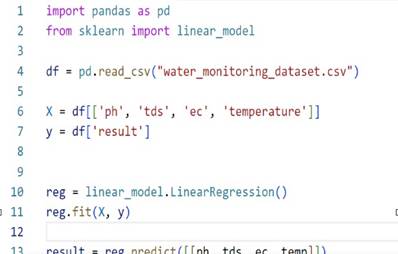
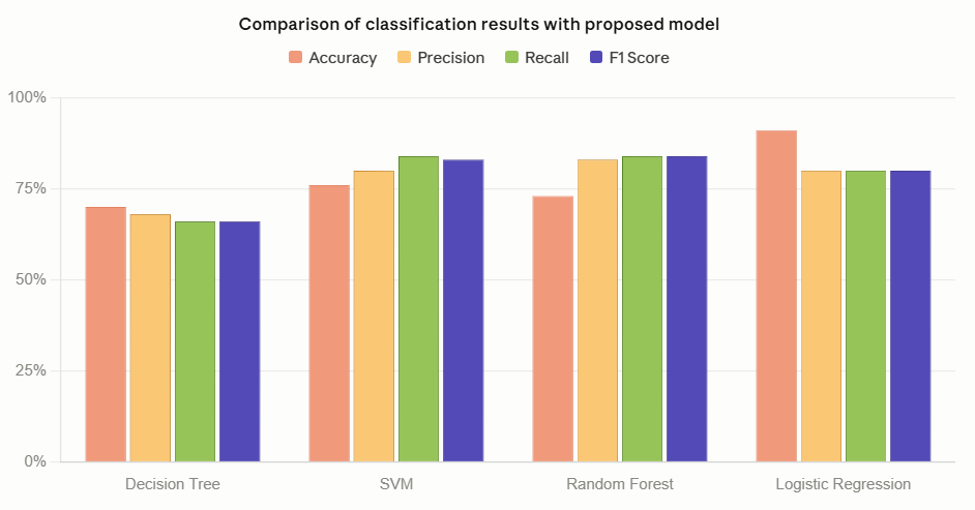
Beyond real-time sensing alone, the integration of machine learning (ML) further strengthens the predictive capability of modern monitoring systems. Machine learning algorithms can identify patterns within sensor-generated datasets and classify environmental conditions more efficiently than manual threshold-based observation. Libraries such as Scikit-learn provide accessible frameworks for implementing classification models including Decision Tree, Random Forest, Support Vector Machine (SVM), and Logistic Regression approaches (Pedregosa et al., 2011). In aquaculture applications, such predictive models may help identify deteriorating water conditions earlier, thereby enabling timely intervention before significant biological or economic damage occurs.
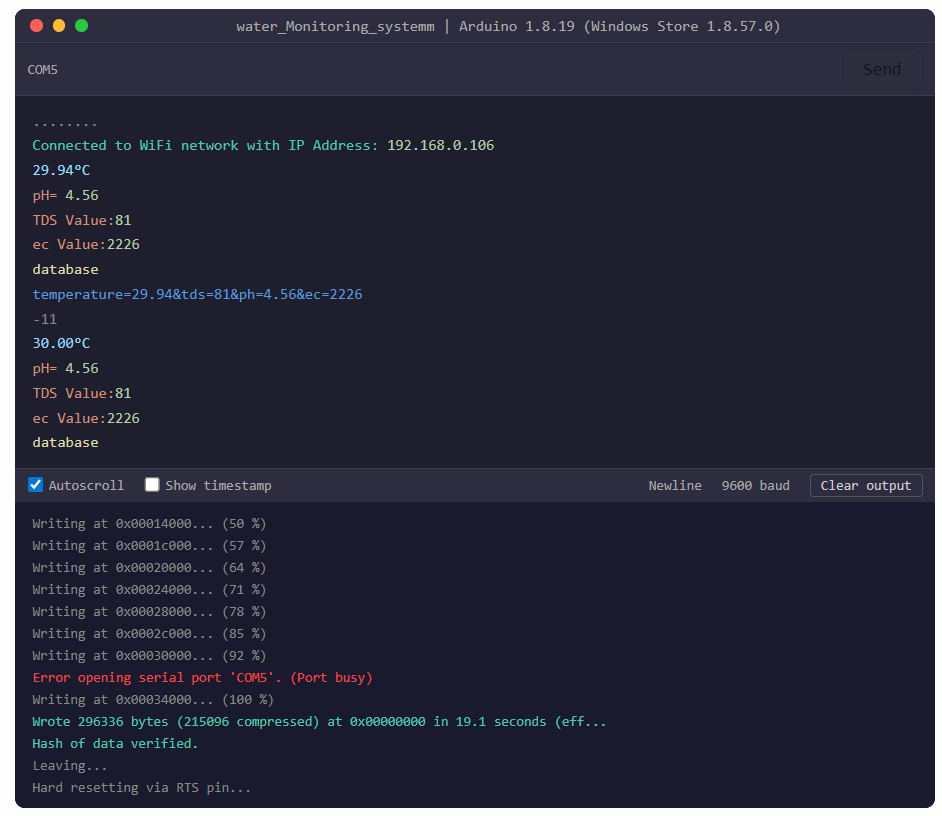
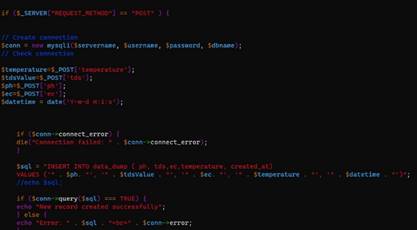
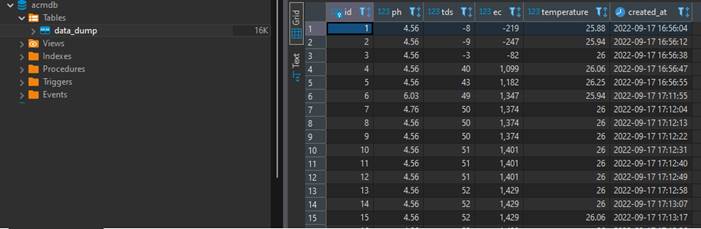
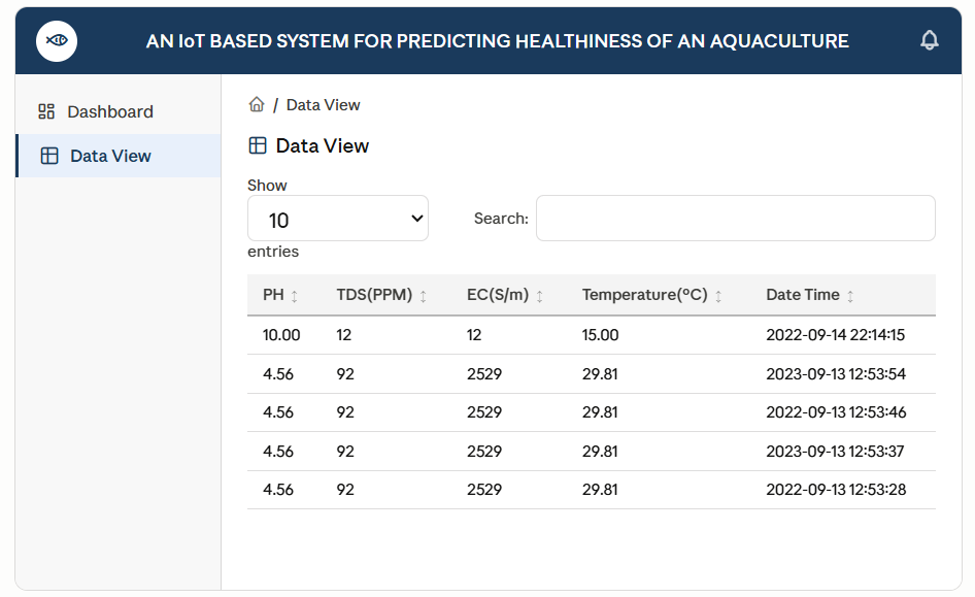
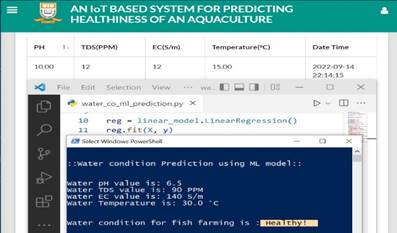
In this study, we propose an IoT-driven aquaculture monitoring and prediction system using an ESP8266-based microcontroller integrated with temperature, pH, TDS, and conductivity sensors. Sensor data are continuously collected and transmitted to a cloud-based database through Wi-Fi connectivity. A web-based dashboard enables real-time visualization of environmental parameters and prediction outcomes. Furthermore, machine learning models are employed to classify the healthiness of aquaculture conditions based on collected environmental data. By combining low-cost IoT infrastructure with predictive analytics, this work aims to develop a comparatively affordable and practical framework for intelligent aquaculture monitoring. Ultimately, the proposed approach seeks not only to improve operational efficiency but also to contribute toward more sustainable and data-driven fish farming practices.