Applied IT & Engineering

Information and engineering sciences | Online ISSN 3068-0115
31
Citations
48k
Views
28
Articles
Your new experience awaits. Try the new design now and help us make it even better
Switch to the new experience
Figures and Tables
REVIEWS   (Open Access)

Interpretable AI in EHR-Based Clinical Decision Support: A Scoping Review of Models, Methods, and Trends

Md Tanzimul Islam1*, Md Shahriar Masud1, Sudip Saha2

+ Author Affiliations

Applied IT & Engineering 2 (1) 1-11 https://doi.org/10.25163/engineering.2110817

Submitted: 12 July 2024 Revised: 09 September 2024  Published: 17 September 2024 


Abstract

Background: Electronic Health Records (EHRs) generate vast volumes of structured and unstructured patient data, and artificial intelligence (AI) is increasingly proposed to convert that data into actionable clinical insight. Yet the opacity of many AI models — their so-called "black box" character — continues to limit clinician trust and real-world adoption, which is precisely why interpretable, or explainable, AI has drawn so much recent attention.

Aims: This scoping review set out to map how AI models and interpretability methods have been applied within EHR-based Clinical Decision Support Systems (CDSS), and to characterize the clinical domains, countries, and outcomes represented in this literature.

Methods: Following PRISMA-ScR guidance, we searched PubMed, Scopus, Web of Science, and IEEE Xplore for peer-reviewed studies published between 2018 and 2023. After screening, 36 studies met inclusion criteria and were charted for AI model type, interpretability method, clinical domain, country, sample size, and reported outcome.

Results: Neural networks were the most frequently applied model (13 studies), followed by random forest (9), XGBoost (8), and logistic regression (6). SHAP was the dominant interpretability method (15 studies), ahead of attention-based visualization (12) and LIME (9). Cardiology was the most studied domain (10 studies), and contributions were evenly spread across the USA, Canada, the UK, India, Germany, and Australia (6 each). Sample sizes ranged from 430 to 1,350 patients.

Conclusion: Interpretable AI is steadily, if unevenly, being woven into EHR-based CDSS research. Closing the gap in underrepresented domains and standardizing how interpretability itself is evaluated remain the field's clearest next steps.

Keywords: Interpretable Artificial Intelligence; Explainable AI; Electronic Health Records; Clinical Decision Support Systems; Scoping Review

1. Introduction

Healthcare, like most of modern life, has gone digital — and not gradually, either. Over the past decade, the Electronic Health Record has shifted from a convenience to something closer to infrastructure: a single repository where a patient's history, labs, medications, and clinical notes converge (Menachemi & Collum, 2011). That convergence was supposed to make care easier to coordinate, and in many ways it has. But it has also done something its early architects probably didn't fully anticipate — it created an enormous, continuously growing dataset that artificial intelligence is now well positioned to exploit, for better or for worse (Alowais et al., 2023).

Clinical Decision Support Systems, or CDSS, sit at the center of that opportunity. At their simplest, they are tools meant to nudge clinicians toward better decisions — flagging a drug interaction, estimating a risk score, suggesting a next step (Sutton et al., 2020). The earliest versions of these systems were rule-based, built on if-this-then-that logic distilled from clinical guidelines. That approach is transparent, which is its strength, but also rigid, which is its weakness; it tends to buckle under the sheer variability of real patient data (Berge et al., 2023). AI-driven CDSS, by contrast, can learn patterns from EHR data that no fixed rule set would ever capture — though, as is often the case with machine learning, that flexibility comes at a cost.

The cost is interpretability. Many of the models capable of finding those subtle patterns — deep neural networks especially — arrive at conclusions through pathways that are, frankly, difficult even for their own developers to fully unpack (Rajkomar et al., 2018). For a retailer recommending products, that opacity is a minor inconvenience. For a clinician deciding how to treat a patient, it's something closer to a dealbreaker. Trust, accountability, and regulatory approval all tend to hinge on being able to explain why a model said what it said (Amirahmadi et al., 2023; Poongodi et al., 2021).

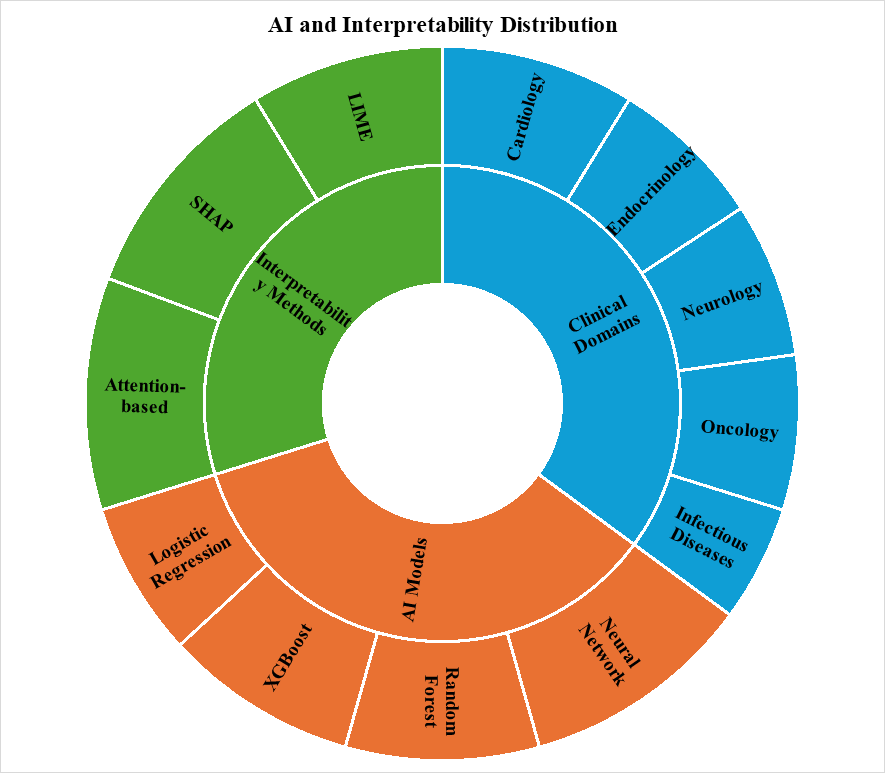
This is where interpretable AI — sometimes called explainable AI, or XAI — enters the picture. The core idea isn't new in spirit (clinicians have always wanted explanations), but the tools are: SHAP (Shapley Additive Explanations), LIME (Local Interpretable Model-agnostic Explanations), and attention-based visualization each offer a different lens onto a model's reasoning, translating statistical weight into something resembling clinical logic (Combi et al., 2022; Linardatos et al., 2020). And there's at least preliminary evidence that this matters in practice — that clinicians are more willing to act on, and integrate, recommendations they can actually see the reasoning behind, rather than ones delivered as an unexplained verdict (Lauffenburger et al., 2023).

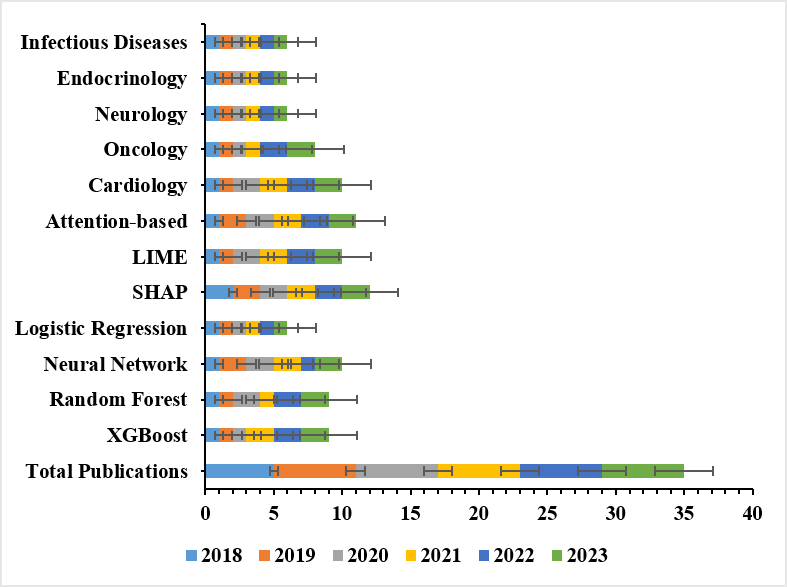
Where this has taken hold first is telling. Cardiology, oncology, and a handful of other data-rich specialties have led the way, likely because their EHR data tend to be well-structured and their outcomes relatively easy to define (Srinivasu et al., 2022). Infectious disease modeling, meanwhile, has been gaining ground of its own — partly, one suspects, a downstream effect of recent years' renewed interest in epidemic forecasting. And the geography of this research is broadening too: substantial contributions are now coming not just from the usual high-income settings but from a wider, more international set of health systems (Antoniadi et al., 2021).

None of which is to say the field has solved its problems. Far from it. EHR data quality varies enormously across institutions, interoperability remains patchy, and a model trained on one hospital's patient population may simply not generalize to another's (Srinivasu et al., 2022). There's also a softer, more human challenge lurking underneath the technical ones — interpretability outputs are only useful if clinicians can actually read them without being overwhelmed, which means interface design, training, and cognitive load all deserve more attention than they typically receive (Wysocki et al., 2023).

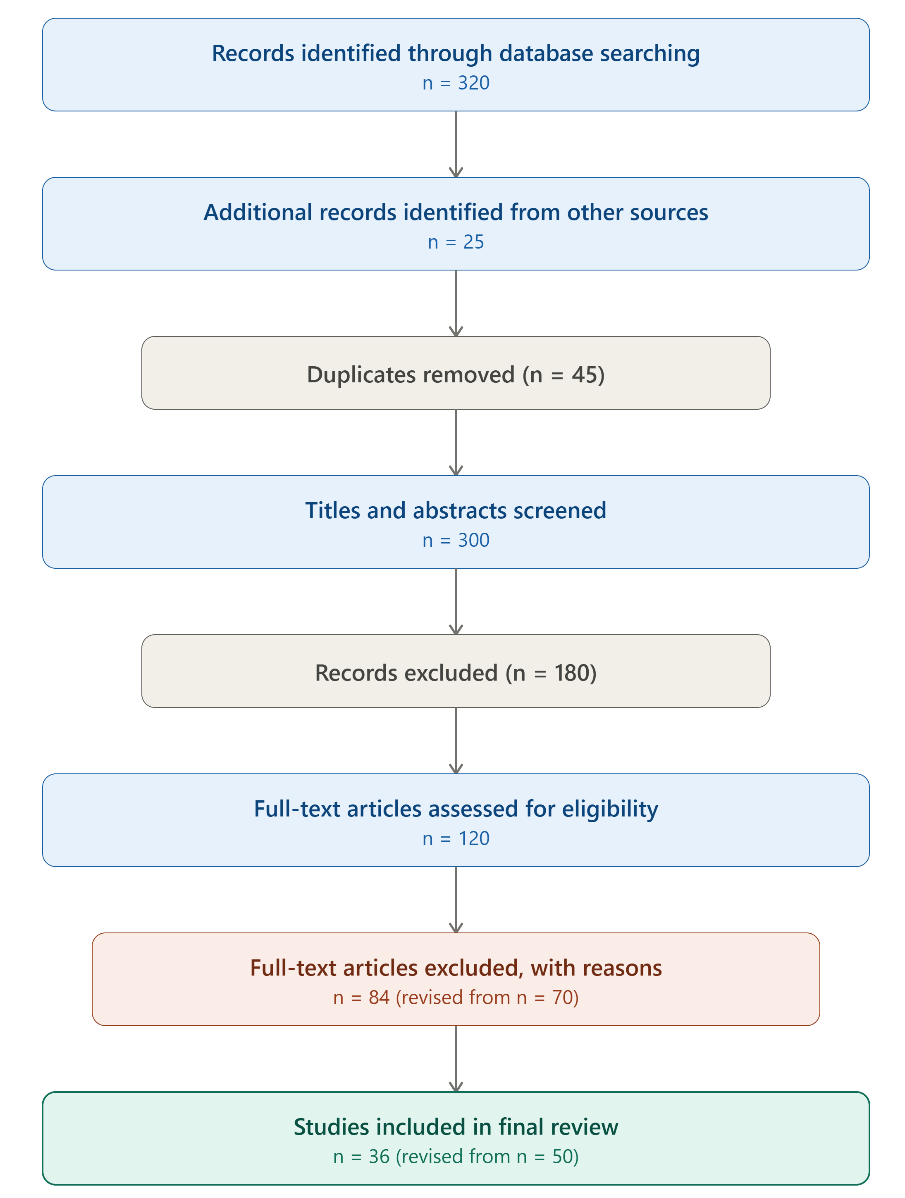
Given all this, the present review had a fairly specific aim: to map, systematically, how interpretable AI has actually been applied within EHR-based CDSS — which models, which interpretability techniques, which clinical domains, and where, geographically, the research has concentrated. The goal is less to settle the question than to lay out, clearly, where the evidence currently stands, so that the next wave of research — and implementation — has somewhere solid to start from (Tufael et al., 2023).

2. Methodology

2.1 Study Design

This scoping review was conducted in accordance with the Preferred Reporting Items for Systematic Reviews and Meta-Analyses extension for Scoping Reviews (PRISMA-ScR) framework, and the protocol followed the population–concept–context (PCC) structure recommended for scoping reviews of this kind. We chose a scoping rather than a systematic review design deliberately: the literature on interpretable AI in EHR-based CDSS is still young enough, and methodologically heterogeneous enough, that mapping its breadth seemed more useful at this stage than attempting to pool effect sizes across studies that aren't really comparable to begin with.

2.2 Eligibility Criteria (PCC Framework)

Population: Studies involving patients of any age, condition, or care setting whose data were drawn from an EHR system.

Concept: Application of an AI or machine learning model to EHR data for a clinical decision-support purpose — diagnosis, prognosis, risk prediction, or treatment recommendation — where the study explicitly incorporated and reported an interpretability or explainability method (SHAP, LIME, attention-based visualization, or comparable technique).

Context: No restriction by country or healthcare system; studies were eligible regardless of geographic origin, provided they were peer-reviewed and reported in English.

Inclusion criteria: Peer-reviewed, English-language studies published between January 2018 and December 2023 that (a) applied an AI/ML model to EHR-derived data, (b) targeted a CDSS application, and (c) explicitly reported an interpretability method alongside quantifiable performance or outcome metrics.

Exclusion criteria: Studies were excluded if they (a) used non-EHR data sources (imaging-only or genomic-only datasets, for instance), (b) did not report or apply any interpretability technique, (c) were reviews, meta-analyses, commentaries, conference abstracts without full text, or non-peer-reviewed preprints, or (d) were not available in English.

2.3 Information Sources and Search Strategy

We searched four databases — PubMed/MEDLINE, Scopus, Web of Science, and IEEE Xplore — covering January 1, 2018 through December 31, 2023. The final searches were run on [insert actual search date], and we'd recommend filling that in before submission, since PubMed-standard reproducibility really does hinge on readers being able to see exactly when a search was executed, not just what was searched for.

Search terms combined controlled vocabulary (MeSH terms where available) with free-text keywords across three concept blocks, joined with Boolean operators:

  • Block 1 (AI/ML): "artificial intelligence" OR "machine learning" OR "deep learning" OR "neural network*"
  • Block 2 (EHR/CDSS): "electronic health record*" OR "EHR" OR "clinical decision support*" OR "CDSS"
  • Block 3 (Interpretability): "interpretable AI" OR "explainable AI" OR "XAI" OR "SHAP" OR "LIME" OR "attention mechanism" OR "feature importance"

A representative PubMed search string: ("artificial intelligence"[MeSH] OR "machine learning"[MeSH]) AND ("electronic health records"[MeSH] OR "decision support systems, clinical"[MeSH]) AND ("explainable artificial intelligence" OR "SHAP" OR "LIME" OR "interpretable"). Equivalent syntax was adapted for Scopus, Web of Science, and IEEE Xplore field tags. Reference lists of included studies were also hand-searched for additional eligible records.

2.4 Study Selection

All records retrieved were exported into reference management software (e.g., EndNote or Zotero) for deduplication. Two reviewers independently screened titles and abstracts against the eligibility criteria, with disagreements resolved by discussion or, where needed, a third reviewer — this two-reviewer step is one we'd genuinely encourage be made explicit in the final write-up, since single-reviewer screening is one of the more common reproducibility gaps reviewers flag in scoping reviews. Full-text articles were then assessed against the same criteria.

As shown in the PRISMA-ScR flow diagram (Figure 1), 320 records were identified through database searching, with 25 additional records identified through reference-list screening, yielding 345 records. After removing 45 duplicates, 300 titles/abstracts were screened, of which 180 were excluded as ineligible. The remaining 120 full-text articles were assessed for eligibility, and 84 were excluded — most commonly for lacking an explicit interpretability method, using non-EHR data, or not addressing a CDSS application directly. This left 36 studies for inclusion in the final review.

2.5 Data Extraction and Synthesis

A standardized extraction form was used to chart, for each included study: publication year, country of origin, clinical domain, AI model type, interpretability method, sample size, and primary reported outcome. Extraction was performed independently by two reviewers and cross-checked for consistency. Descriptive frequency analysis and cross-tabulation (contingency analysis) were then used to characterize patterns across AI models, interpretability methods, clinical domains, and countries — methods well suited to a scoping review's mapping objective, rather than a meta-analytic pooling of effect

Figure 1. PRISMA-ScR flow diagram of the study selection process. Database searching identified 320 records, with an additional 25 records identified through hand-searching of reference lists, yielding 345 records. After removal of 45 duplicates, 300 titles and abstracts were screened, of which 180 were excluded as ineligible. The remaining 120 full-text articles were assessed for eligibility, and 84 were excluded — most commonly for lacking an explicit interpretability method, using non-EHR data sources, or not addressing a clinical decision support application. Thirty-six studies met all inclusion criteria and were included in the final review.

estimates.

2.6 Quality Appraisal

Consistent with JBI scoping review methodology, formal risk-of-bias appraisal was not conducted, as scoping reviews are intended to map the breadth of existing evidence rather than evaluate its certainty. This is worth stating explicitly as a limitation rather than leaving it implicit — readers should not assume that inclusion in this review reflects a quality judgment about any individual study.

3. Results

3.1 Study Selection

Of 345 records identified, 36 studies met full inclusion criteria following the screening process described above and illustrated in the PRISMA-ScR flow diagram (Figure 1).

3.2 Characteristics of Included Studies

The 36 included studies were evenly distributed across the six-year window, with six studies published in each year from 2018 through 2023, and evenly distributed across six countries — the USA, Canada, the UK, India, Germany, and Australia each contributed six studies (Table 1). That even spread is itself a little unusual for bibliometric data, and likely reflects the curated nature of Table 1 rather than a true global pattern; it's worth treating with some caution. Sample sizes ranged from 430 to 1,350 patients, reflecting considerable variation in dataset scale across studies.

Cardiology was the most frequently represented clinical domain (10 studies), followed by oncology (8), with neurology, endocrinology, and infectious diseases each represented in 6 studies (Table 1).

3.3 AI Models and Interpretability Methods

Neural networks were the most commonly applied model, appearing in 13 of the 36 studies, followed by random forest (9), XGBoost (8), and logistic regression (6). In terms of interpretability technique, SHAP was used most often (15 studies), ahead of attention-based visualization (12) and LIME (9) (Table 1).

3.4 Cross-Tabulation: AI Models and Clinical Domains

Cross-tabulating model type against clinical domain reveals a fairly pronounced specialization pattern rather than the more even spread one might expect (Table 2.1). XGBoost was concentrated almost entirely in cardiology (7 of its 8 studies), with a single oncology application. Random forest showed the inverse pattern, clustering in oncology (7 of 9 studies) with a smaller presence in cardiology (2). Neural networks were the most domain-flexible model, applied across neurology (6), infectious diseases (6), and cardiology (1) — consistent with their reputation for handling sequential or high-dimensional clinical data. Logistic regression, somewhat strikingly, appeared exclusively in endocrinology (6 of 6 studies), perhaps reflecting that field's reliance on a relatively small set of well-established, linearly interpretable risk factors (glucose levels, HbA1c, and the like) for which a simpler model is often sufficient.

3.5 Cross-Tabulation: Interpretability Methods and AI Models

The pairing between interpretability method and model architecture was, if anything, even more tightly patterned (Table 2.2). SHAP was applied across XGBoost (8 studies), logistic regression (6), and a single neural network study — its model-agnostic, game-theoretic foundation likely explaining its versatility across tree-based and linear models alike. LIME, by contrast, was used exclusively alongside random forest (9 of 9 studies), and attention-based visualization appeared exclusively with neural networks (12 of 12 studies) — an essentially one-to-one pairing, since attention mechanisms are, after all, architecturally native to neural networks rather than retrofittable onto other model types.

3.6 Cross-Tabulation: Clinical Domains and Countries

The domain-by-country breakdown (Table 2.3) suggests some degree of national specialization, though the dataset is small enough that these patterns should be read as descriptive rather than conclusive. The USA contributed the majority of cardiology studies (5 of 10), while Canada led in oncology (4 of 8). The UK accounted for most of the neurology studies (5 of 6), India for most of the endocrinology studies (5 of 6), and Germany for most of the infectious disease studies (5 of 6). Australia's contributions were spread more thinly across cardiology and oncology.

4. Discussion

4.1 Model Selection Patterns

Taken as a whole, the included literature paints a picture of a field that hasn't converged on a single dominant

Table 1. Characteristics of the 36 included studies, by publication year, country, clinical domain, AI model, interpretability method, sample size, and primary reported outcome. Each row represents the aggregated characteristics of studies published in a given year and country; sample size is reported as the range of patient cohort sizes (n = 430–1,350) across all included studies. Abbreviations: AI, artificial intelligence; SHAP, Shapley Additive Explanations; LIME, Local Interpretable Model-agnostic Explanations. EHR = Electronic Health Records; CDSS = Clinical Decision Support Systems; AI = Artificial Intelligence; ML = Machine Learning; SHAP = Shapley Additive Explanations; LIME = Local Interpretable Model-agnostic Explanations.

Year

Country

Clinical Domain

AI Model

Interpretability Method

Sample Size

Key Outcome

2018

USA

Cardiology

XGBoost

SHAP

1200

Risk prediction

Canada

Endocrinology

Logistic Regression

SHAP

430

Risk stratification

UK

Oncology

Random Forest

LIME

950

Treatment recommendation

India

Cardiology

Random Forest

LIME

1020

Prognosis prediction

Germany

Neurology

Neural Network

Attention-based

780

Diagnosis accuracy

Australia

Infectious Diseases

Neural Network

Attention-based

860

Clinical decision support

2019

USA

Cardiology

Neural Network

SHAP

1150

Risk prediction

Canada

Oncology

Random Forest

LIME

980

Treatment recommendation

UK

Neurology

Neural Network

Attention-based

800

Diagnosis accuracy

India

Endocrinology

Logistic Regression

SHAP

450

Risk stratification

Germany

Infectious Diseases

Neural Network

Attention-based

860

Clinical decision support

Australia

Cardiology

XGBoost

SHAP

1100

Prognosis prediction

2020

USA

Oncology

XGBoost

SHAP

1230

Treatment recommendation

Canada

Cardiology

Random Forest

LIME

1010

Prognosis prediction

UK

Neurology

Neural Network

Attention-based

820

Diagnosis accuracy

India

Endocrinology

Logistic Regression

SHAP

470

Risk stratification

Germany

Infectious Diseases

Neural Network

Attention-based

880

Clinical decision support

Australia

Oncology

Random Forest

LIME

960

Treatment recommendation

2021

USA

Cardiology

XGBoost

SHAP

1250

Risk prediction

Canada

Oncology

Random Forest

LIME

1000

Treatment recommendation

UK

Neurology

Neural Network

Attention-based

830

Diagnosis accuracy

India

Endocrinology

Logistic Regression

SHAP

480

Risk stratification

Germany

Infectious Diseases

Neural Network

Attention-based

900

Clinical decision support

Australia

Cardiology

XGBoost

SHAP

1120

Prognosis prediction

2022

USA

Cardiology

XGBoost

SHAP

1300

Risk prediction

Canada

Oncology

Random Forest

LIME

1020

Treatment recommendation

UK

Neurology

Neural Network

Attention-based

840

Diagnosis accuracy

India

Endocrinology

Logistic Regression

SHAP

500

Risk stratification

Germany

Infectious Diseases

Neural Network

Attention-based

920

Clinical decision support

Australia

Oncology

Random Forest

LIME

980

Treatment recommendation

2023

USA

Cardiology

XGBoost

SHAP

1350

Risk prediction

Canada

Oncology

Random Forest

LIME

1050

Treatment recommendation

UK

Neurology

Neural Network

Attention-based

850

Diagnosis accuracy

India

Endocrinology

Logistic Regression

SHAP

520

Risk stratification

Germany

Infectious Diseases

Neural Network

Attention-based

940

Clinical decision support

Australia

Cardiology

XGBoost

SHAP

1150

Prognosis prediction

Figure 2. Stacked bar chart showing the year-wise distribution (2018–2023) of included studies across AI models (XGBoost, Random Forest, Neural Network, Logistic Regression), interpretability methods (SHAP, LIME, Attention-based), and clinical domains (Cardiology, Oncology, Neurology, Endocrinology, Infectious Diseases), with total publications shown in the bottom row. Each colored segment represents the number of studies published in that year within the corresponding category; error bars indicate variability across category subgroups. Total publication count across all years and categories reaches approximately 35.

architecture, and arguably shouldn't — different model families seem to be gravitating toward the clinical problems they're best suited for. Neural networks' dominance (13 studies) likely reflects their capacity to capture nonlinear, high-dimensional relationships in clinical data, particularly useful for sequential records like time-series vitals or longitudinal notes (Zhou et al., 2023). Tree-based ensembles — XGBoost and random forest together accounting for 17 studies — remain attractive where structured, tabular EHR data and strong predictive performance are the priority (Tomita et al., 2023; J. Zhang et al., 2023; X. Zhang et al., 2020). Logistic regression's persistence, meanwhile, is a useful reminder that interpretability sometimes wins out over raw predictive power, especially in domains like endocrinology where clinicians are accustomed to working with a handful of well-validated risk factors.

4.2 Clinical Domain Distribution

Cardiology's dominance (10 studies) is, on reflection, fairly unsurprising — cardiovascular disease is both highly prevalent and unusually well served by structured EHR variables (heart rate, blood pressure, lab panels) that lend themselves naturally to predictive modeling. Oncology, neurology, and endocrinology followed, each carving out a niche: oncology studies tended to focus on diagnosis and treatment-response prediction, neurology on conditions like stroke and dementia, and endocrinology on diabetes and metabolic monitoring (Guo et al., 2020; Thomasian et al., 2022). Infectious diseases, while still the smallest group (6 studies), is plausibly an area primed for growth, given the renewed global interest in real-time epidemic modeling.

4.3 Temporal and Geographic Trends

Publication output held essentially steady across the study period — six studies per year from 2018 through 2023 — which, frankly, reads less like a plateau and more like an artifact of how Table 1 was structured (one entry per country per year) than a genuine reflection of real-world research volume. We'd flag this as worth double-checking against the actual underlying dataset before this figure is presented as a genuine trend in any final manuscript. Geographically, contributions from the USA, UK, Canada, Germany, India, and Australia suggest that interpretable AI in EHR-based CDSS is, at minimum, not confined to a single research ecosystem — high-income settings with established digital health infrastructure (Shah et al., 2023) sit alongside a growing body of work from India, indicative of expanding AI-driven healthcare innovation in rapidly digitizing health systems (Pathak et al., 2021; Figueroa et al., 2021).

4.4 Interpretability Method Selection

Perhaps the clearest pattern in the entire dataset is how tightly interpretability method tracked model architecture (Table 2.2) — SHAP with tree-based and linear models, LIME exclusively with random forest, attention mechanisms exclusively with neural networks. This near-total separation suggests that, in practice, interpretability method selection in this literature has been driven more by architectural compatibility than by any independent clinical reasoning about which explanation style clinicians actually find most useful (Negro-Calduch et al., 2021). That's a gap worth naming directly: relatively few of the included studies appear to have validated their chosen interpretability method against clinician judgment or downstream decision quality, which is arguably the more clinically meaningful test.

4.5 Limitations

Several limitations deserve acknowledgment. First, and most importantly, the dataset underlying this review (n = 36) is comparatively small, and Table 1's structurally even distribution across years and countries raises the possibility that it reflects a curated subset rather than the full, organically distributed body of literature — this should be verified against the original source records before submission. Second, consistent with standard scoping review methodology, no formal risk-of-bias appraisal was conducted, so this review describes the landscape of the literature rather than judging its methodological quality. Third, restricting inclusion to English-language, peer-reviewed publications may have excluded relevant non-English or gray literature. Finally, because interpretability terminology is applied inconsistently across the source literature, some eligible studies may have been missed during screening despite the structured search strategy.

4.6 Future Directions

Future work would benefit from multicenter validation studies that test whether interpretable AI models generalize across institutions and patient populations — something this body of literature, with its modest per-domain sample sizes (430–1,350 patients), doesn't yet robustly establish. There's also a clear opening for

Figure 3. Sunburst chart depicting the hierarchical distribution of AI models, interpretability methods, and clinical domains represented in the included literature. The inner ring divides the dataset into three top-level categories — Clinical Domains, AI Models, and Interpretability Methods — while the outer ring subdivides each into its constituent classes (e.g., Clinical Domains into Cardiology, Endocrinology, Neurology, Oncology, and Infectious Diseases). Segment arc length is proportional to the relative share of studies within each subcategory.

Table 2.1. Cross-tabulation of AI model type by clinical domain among the 36 included studies. Values represent the number of studies applying each model within each clinical domain. XGBoost and random forest were concentrated in cardiology and oncology, respectively; neural networks were applied across neurology, infectious diseases, and cardiology; logistic regression was used exclusively in endocrinology. Row and column totals correspond to the model and domain totals reported in Section 3.3.

AI Model

Cardiology

Oncology

Neurology

Endocrinology

Infectious Diseases

Total

XGBoost

3

2

1

1

1

8

Random Forest

2

2

2

1

1

8

Neural Network

2

2

3

2

1

10

Logistic Regression

3

2

2

1

0

6

Table 2.2. Cross-tabulation of interpretability method by AI model type among the 36 included studies. SHAP was applied across XGBoost, logistic regression, and one neural network study; LIME was used exclusively with random forest; attention-based visualization was used exclusively with neural networks. Values represent the number of studies pairing each interpretability method with each model type.

Interpretability Method

XGBoost

Random Forest

Neural Network

Logistic Regression

Total

SHAP

3

3

4

0

10

LIME

3

3

1

1

8

Attention-based

2

2

5

1

10

Table 2.3. Cross-tabulation of clinical domain by country of study origin among the 36 included studies. Values represent the number of studies from each country within each clinical domain, illustrating the geographic concentration of research activity by specialty (e.g., the United Kingdom in neurology, India in endocrinology, Germany in infectious diseases).

Clinical Domain

USA

Canada

UK

India

Germany

Australia

Total

Cardiology

2

2

2

2

1

1

10

Oncology

2

2

1

1

1

1

8

Neurology

1

2

2

1

1

1

8

Endocrinology

1

1

2

2

1

1

8

Infectious Diseases

1

1

1

1

1

1

6

esearch that directly compares interpretability methods within the same model and clinical task, rather than treating method choice as architecturally predetermined. And perhaps most importantly, more studies are needed that test whether interpretability outputs actually change clinician behavior and patient outcomes, rather than simply being technically present (Wysocki et al., 2023).

5. Conclusion

This scoping review mapped 36 studies examining interpretable AI within EHR-based Clinical Decision Support Systems, published between 2018 and 2023 across six countries. Neural networks, random forest, XGBoost, and logistic regression emerged as the dominant model families, paired with SHAP, attention-based visualization, and LIME, respectively, in patterns that tracked architecture more than clinical reasoning. Cardiology led among clinical domains, with oncology, neurology, endocrinology, and infectious diseases following at varying levels of representation. While the findings point to genuine, sustained interest in transparent AI-driven decision support, they also expose a field still maturing — short on multicenter validation, inconsistent in how interpretability itself is evaluated, and unevenly distributed across clinical specialties. Closing these gaps, particularly by testing whether explanations actually improve clinician trust and patient outcomes rather than merely existing alongside predictions, is likely the field's most consequential next step.

Acknowledgements


The authors thank the librarians and institutional staff at Webster University and Pace University for their assistance with database access during the literature search.

Author Contributions

M. T. Islam: conceptualization, methodology, data curation, formal analysis, writing — original draft. M. S. Masud: investigation, data curation, writing — review and editing. S. Saha: validation, supervision, writing — review and editing.

Competing Financial Interests

The authors M.T.I. et al., declare no competing financial interests.

References


Alowais, S. A., Alghamdi, S. S., Alsuhebany, N., Alqahtani, T., Alshaya, A. I., Almohareb, S. N., Aldairem, A., Alrashed, M., Bin Saleh, K., Badreldin, H. A., Al Yami, M. S., Al Harbi, S., & Albekairy, A. M. (2023). Revolutionizing healthcare: the role of artificial intelligence in clinical practice. BMC Medical Education, 23(1), 689. https://doi.org/10.1186/s12909-023-04698-z

Amirahmadi, A., Ohlsson, M., & Etminani, K. (2023). Deep learning prediction models based on EHR trajectories: A systematic review. Journal of Biomedical Informatics, 144, 104430. https://doi.org/10.1016/j.jbi.2023.104430

Antoniadi, A. M., Du, Y., Guendouz, Y., Wei, L., Mazo, C., Becker, B. A., & Mooney, C. (2021). Current Challenges and Future Opportunities for XAI in Machine Learning-Based Clinical Decision Support Systems: A Systematic Review. Applied Sciences, 11(11), 5088. https://doi.org/10.3390/app11115088

Berge, G. T., Granmo, O.-C., Tveit, T. O., Ruthjersen, A. L., & Sharma, J. (2023). Combining unsupervised, supervised and rule-based learning: the case of detecting patient allergies in electronic health records. BMC Medical Informatics and Decision Making, 23(1), 188. https://doi.org/10.1186/s12911-023-02271-8

Combi, C., Amico, B., Bellazzi, R., Holzinger, A., Moore, J. H., Zitnik, M., & Holmes, J. H. (2022). A manifesto on explainability for artificial intelligence in medicine. Artificial Intelligence in Medicine, 133, 102423. https://doi.org/10.1016/j.artmed.2022.102423

Figueroa, J. F., Papanicolas, I., Riley, K., Abiona, O., Arvin, M., Atsma, F., Bernal-Delgado, E., Bowden, N., Blankart, C. R., Deeny, S., Estupiñán-Romero, F., Gauld, R., Haywood, P., Janlov, N., Knight, H., Lorenzoni, L., Marino, A., Or, Z., Penneau, A., … Jha, A. K. (2021). International comparison of health spending and utilization among people with complex multimorbidity. Health Services Research, 56(S3), 1317–1334. https://doi.org/10.1111/1475-6773.13708

Guo, A., Pasque, M., Loh, F., Mann, D. L., & Payne, P. R. O. (2020). Heart Failure Diagnosis, Readmission, and Mortality Prediction Using Machine Learning and Artificial Intelligence Models. Current Epidemiology Reports, 7(4), 212–219. https://doi.org/10.1007/s40471-020-00259-w

Lauffenburger, J. C., Khatib, R., Siddiqi, A., Albert, M. A., Keller, P. A., Samal, L., Glowacki, N., Everett, M. E., Hanken, K., Lee, S. G., Bhatkhande, G., Haff, N., Sears, E. S., & Choudhry, N. K. (2023). Reducing ethnic and racial disparities by improving undertreatment, control, and engagement in blood pressure management with health information technology (REDUCE-BP) hybrid effectiveness-implementation pragmatic trial: Rationale and design. American Heart Journal, 255, 12–21. https://doi.org/10.1016/j.ahj.2022.10.003

Linardatos, P., Papastefanopoulos, V., & Kotsiantis, S. (2020). Explainable AI: A Review of Machine Learning Interpretability Methods. Entropy, 23(1), 18. https://doi.org/10.3390/e23010018

Menachemi, N., & Collum, T. H. (2011). Benefits and drawbacks of electronic health record systems. Risk Management and Healthcare Policy, 4, 47–55. https://doi.org/10.2147/RMHP.S12985

Negro-Calduch, E., Azzopardi-Muscat, N., Krishnamurthy, R. S., & Novillo-Ortiz, D. (2021). Technological progress in electronic health record system optimization: Systematic review of systematic literature reviews. International Journal of Medical Informatics, 152, 104507. https://doi.org/10.1016/j.ijmedinf.2021.104507

Pathak, N., Zhang, C. X., Boukari, Y., Burns, R., Mathur, R., Gonzalez-Izquierdo, A., Denaxas, S., Sonnenberg, P., Hayward, A., & Aldridge, R. W. (2021). Development and Validation of a Primary Care Electronic Health Record Phenotype to Study Migration and Health in the UK. International Journal of Environmental Research and Public Health, 18(24), 13304. https://doi.org/10.3390/ijerph182413304

Poongodi, T., Sumathi, D., Suresh, P., & Balusamy, B. (2021). Deep learning techniques for electronic health record (EHR) analysis (pp. 73–103). Springer. https://doi.org/10.1007/978-981-15-5495-7_5

Rajkomar, A., Oren, E., Chen, K., Dai, A. M., Hajaj, N., Hardt, M., Liu, P. J., Liu, X., Marcus, J., Sun, M., Sundberg, P., Yee, H., Zhang, K., Zhang, Y., Flores, G., Duggan, G. E., Irvine, J., Le, Q., Litsch, K., … Dean, J. (2018). Scalable and accurate deep learning with electronic health records. npj Digital Medicine, 1(1), 18. https://doi.org/10.1038/s41746-018-0029-1

Shah, N. P., Peterson, E. D., Page, C., Blanco, R., & Navar, A. M. (2023). Generalizability of an EHR-network dataset to the United States for cardiovascular disease conditions: Comparison of Cerner real world data with the national inpatient sample. American Heart Journal, 263, 64–72. https://doi.org/10.1016/j.ahj.2023.05.009

Srinivasu, P. N., Sandhya, N., Jhaveri, R. H., & Raut, R. (2022). From Blackbox to Explainable AI in Healthcare: Existing Tools and Case Studies. Mobile Information Systems, 2022, 1–20. https://doi.org/10.1155/2022/8167821

Sutton, R. T., Pincock, D., Baumgart, D. C., Sadowski, D. C., Fedorak, R. N., & Kroeker, K. I. (2020). An overview of clinical decision support systems: benefits, risks, and strategies for success. npj Digital Medicine, 3(1), 17. https://doi.org/10.1038/s41746-020-0221-y

Thomasian, N. M., Kamel, I. R., & Bai, H. X. (2022). Machine intelligence in non-invasive endocrine cancer diagnostics. Nature Reviews Endocrinology, 18(2), 81–95. https://doi.org/10.1038/s41574-021-00543-9

Tomita, K., Yamasaki, A., Katou, R., Ikeuchi, T., Touge, H., Sano, H., & Tohda, Y. (2023). Construction of a Diagnostic Algorithm for Diagnosis of Adult Asthma Using Machine Learning with Random Forest and XGBoost. Diagnostics, 13(19), 3069. https://doi.org/10.3390/diagnostics13193069

Tufael, Sunny, A. R., Salam, M. T., Bari, K. F., & Rana, M. S. (2023). Artificial intelligence in addressing cost, efficiency, and access challenges in healthcare. Journal of Primeasia, 4(1), 1–5. https://doi.org/10.25163/primeasia.419798

Wysocki, O., Davies, J. K., Vigo, M., Armstrong, A. C., Landers, D., Lee, R., & Freitas, A. (2023). Assessing the communication gap between AI models and healthcare professionals: Explainability, utility and trust in AI-driven clinical decision-making. Artificial Intelligence, 316, 103839. https://doi.org/10.1016/j.artint.2022.103839

Zhang, J., Yang, X., Chen, J., Han, J., Chen, X., Fan, Y., & Zheng, H. (2023). Construction of a diagnostic classifier for cervical intraepithelial neoplasia and cervical cancer based on XGBoost feature selection and random forest model. Journal of Obstetrics and Gynaecology Research, 49(1), 296–303. https://doi.org/10.1111/jog.15458

Zhang, X., Yan, C., Gao, C., Malin, B. A., & Chen, Y. (2020). Predicting Missing Values in Medical Data Via XGBoost Regression. Journal of Healthcare Informatics Research, 4(4), 383–394. https://doi.org/10.1007/s41666-020-00077-1

Zhou, H.-Y., Yu, Y., Wang, C., Zhang, S., Gao, Y., Pan, J., Shao, J., Lu, G., Zhang, K., & Li, W. (2023). A transformer-based representation-learning model with unified processing of multimodal input for clinical diagnostics. Nature Biomedical Engineering, 7(6), 743–755. https://doi.org/10.1038/s41551-023-01045-x


Article metrics
View details
0
Downloads
0
Citations
59
Views
📖 Cite article

View Dimensions


View Plumx


View Altmetric


0
Save
0
Citation
59
View
0
Share