3.1 Research Design
This study follows an empirical, experimental design aimed at developing and rigorously evaluating the Neuro-Symbolic Zero Trust Federated Intrusion Detection System (NS-ZTFedIDS) — a unified cybersecurity architecture for SDN-controlled and fiber-optic communication environments. The choice of experimental methodology was deliberate: given the novelty of integrating five distinct technical paradigms (Federated Learning, Zero Trust Architecture, Graph Attention Networks, Explainable AI, and Neuro-Symbolic reasoning) into a single operative framework, conceptual or survey-based approaches would not have been sufficient to establish validity. Functional performance under realistic cyberattack conditions needed to be measured, compared, and reported.
The experimental design follows a comparative evaluation structure. The proposed NS-ZTFedIDS model is trained and tested against a set of baseline models — including standalone Random Forest, XGBoost, Autoencoder, CNN-LSTM, and a conventional Graph Attention Network (GAT) — under identical data conditions. This allows isolation of the contribution made by each architectural component. Parallel experiments are also run against a centralized IDS configuration to quantify the specific benefit of federated training. All experiments were conducted in a controlled simulated environment; no live production infrastructure was accessed or modified at any stage (Villegas-Ch et al., 2025).
3.2 Dataset Selection and Justification
Selecting appropriate datasets for intrusion detection research is, frankly, harder than it sometimes appears in published work. Not every benchmark dataset ages well — some capture attack patterns that are now obsolete, others contain redundancies that inflate model accuracy without genuine generalization. Three datasets were selected here on the basis of coverage, realism, and community acceptance.
NSL-KDD. The NSL-KDD dataset (available at: https://www.kaggle.com/datasets/dhoogla/nslkdd/versions/2) was retained as a foundational benchmark. It was developed as a cleaned successor to the widely criticized KDD Cup 1999 dataset, specifically to remove duplicate records that caused models trained on the original data to exhibit artificially inflated accuracy (Attique et al., 2024). NSL-KDD captures four primary attack categories: Denial of Service (DoS), Probe, Remote-to-Local (R2L), and User-to-Root (U2R), alongside benign traffic. Features include protocol type, service, flag status, source and destination byte counts, and connection duration — a set well-suited to federated learning experiments where features need to be consistently interpretable across heterogeneous nodes.
CICIDS2017. The CICIDS2017 dataset (available at: https://www.kaggle.com/datasets/biprobarai/cic-ids2017) was selected to provide contemporary attack coverage. Generated by the Canadian Institute for Cybersecurity using CICFlowMeter with realistic background traffic, it captures DDoS attacks, brute force attempts, botnet activity, web application attacks, port scanning, and infiltration scenarios across five days of labeled network flows (GK et al., 2025). This dataset is particularly valuable for evaluating federated learning architectures because its temporal structure allows meaningful partitioning across distributed nodes.
CIC-IDS2018. CIC-IDS2018 extends CICIDS2017 with additional attack categories including ransomware behavior, SQL injection, and insider threat scenarios across a larger, more heterogeneous network topology. Its inclusion adds coverage for threat types increasingly prevalent in SDN-controlled enterprise environments (Rajagopalan, 2025).
Simulated SDN/optical traffic. To test NS-ZTFedIDS in conditions more representative of its target deployment environment, synthetic SDN and optical network traffic was generated using Mininet (version 2.3.0) with an
Table 1. Comparative classification performance of NS-ZTFedIDS and baseline models on the combined test dataset. (mean ± SD across 5 runs). Performance metrics are reported as mean ± standard deviation across five independent experimental runs with different random seeds (42, 123, 456, 789, 1024). The combined test dataset comprised 240,000 flow records (20% held-out partition of the full 1,200,000-record dataset), drawn proportionally from NSL-KDD, CICIDS2017, CIC-IDS2018, and simulated SDN/optical traffic sources. Baseline models (Random Forest, XGBoost, Autoencoder, CNN-LSTM, GAT-only) were trained under identical preprocessing and data partitioning conditions. Communication overhead (Comm. OH) is reported only for the federated NS-ZTFedIDS model, as centralized baselines do not incur per-round gradient transmission costs. Detection latency reflects mean inference time per individual flow record, measured across 10,000 inference calls using Python's time.perf_counter() with 1 ms resolution. Statistical significance of NS-ZTFedIDS performance superiority over all baselines was confirmed at p < 0.05 using paired Wilcoxon signed-rank test across all reported metrics. FPR = false positive rate; ROC-AUC = area under the receiver operating characteristic curve; Comm. OH = communication overhead per federated node per global round (MB). Note: Communication overhead (Comm. OH) is only applicable to the federated NS-ZTFedIDS model. Centralized baselines do not incur per-round gradient transmission costs. Latency reflects mean inference time per flow record. Statistical significance of NS-ZTFedIDS vs. all baselines confirmed at p < 0.05 for all metrics.
|
Model
|
Accuracy
|
Precision
|
Recall
|
F1-Score
|
ROC-AUC
|
FPR
|
Latency (ms)
|
Comm. OH (MB/round)
|
|
Random Forest
|
91.4 ± 0.3%
|
0.903
|
0.897
|
0.900
|
0.941
|
0.089
|
4.2 ± 0.4
|
—
|
|
XGBoost
|
92.8 ± 0.2%
|
0.921
|
0.914
|
0.917
|
0.953
|
0.073
|
5.1 ± 0.5
|
—
|
|
Autoencoder
|
88.6 ± 0.5%
|
0.874
|
0.881
|
0.877
|
0.912
|
0.114
|
6.8 ± 0.7
|
—
|
|
CNN-LSTM
|
93.7 ± 0.3%
|
0.931
|
0.928
|
0.929
|
0.961
|
0.066
|
12.3 ± 1.1
|
—
|
|
GAT only
|
94.1 ± 0.2%
|
0.937
|
0.933
|
0.935
|
0.965
|
0.061
|
14.7 ± 1.3
|
—
|
|
NS-ZTFedIDS
|
97.3 ± 0.1%
|
0.971
|
0.968
|
0.969
|
0.988
|
0.028
|
18.4 ± 1.6
|
2.3 ± 0.2
|
Table 2. Per-attack-category F1-scores for NS-ZTFedIDS and selected baseline models on the combined test dataset. F1-scores are reported for eight attack categories: Denial of Service/Distributed Denial of Service (DoS/DDoS), Probe/Reconnaissance, Brute Force/Botnet, Web Attacks/Infiltration, Remote-to-Local (R2L), User-to-Root (U2R), Lateral Movement (SDN-specific), and False Data Injection (SDN-specific). Values represent means across five independent experimental runs. Lateral Movement and False Data Injection categories were derived exclusively from the simulated Mininet SDN/optical traffic partition. DoS/DDoS, Probe, R2L, and U2R categories are sourced primarily from the NSL-KDD partition; Brute Force/Botnet and Web Attacks/Infiltration from CICIDS2017 and CIC-IDS2018 partitions. Class imbalance correction via SMOTE (k = 5) was applied to minority attack categories (R2L, U2R) in training partitions only. Bold values indicate highest F1-score per attack category across all evaluated models.
|
Attack Category
|
Random Forest
|
XGBoost
|
CNN-LSTM
|
GAT only
|
NS-ZTFedIDS
|
|
DoS / DDoS
|
0.941
|
0.953
|
0.961
|
0.963
|
0.981
|
|
Probe / Reconnaissance
|
0.912
|
0.924
|
0.937
|
0.941
|
0.968
|
|
Brute Force / Botnet
|
0.887
|
0.901
|
0.921
|
0.928
|
0.961
|
|
Web Attacks / Infiltration
|
0.874
|
0.893
|
0.914
|
0.919
|
0.957
|
|
R2L
|
0.841
|
0.868
|
0.893
|
0.901
|
0.944
|
|
U2R
|
0.798
|
0.831
|
0.874
|
0.882
|
0.931
|
|
Lateral Movement (SDN)
|
0.811
|
0.844
|
0.889
|
0.897
|
0.962
|
|
False Data Injection (SDN)
|
0.823
|
0.857
|
0.901
|
0.908
|
0.958
|
Table 3. Ablation study results — quantifying the independent contribution of each NS-ZTFedIDS architectural component. Each row represents a variant of the full NS-ZTFedIDS architecture with one component removed, retrained and evaluated under identical experimental conditions. "Without XAI module" confirms that the SHAP/LLM explanation layer is post-hoc and does not influence classification outputs. "Without federated learning (centralized training)" represents a model trained on fully pooled data without differential privacy constraints, federated partitioning, or FedAvg aggregation, serving as the privacy-cost reference baseline. Zero Trust features refer to the four engineered contextual attributes: Policy Compliance Score (PCS), Identity Confidence Score (ICS), Micro-Segment Boundary Crossing (MSBC), and Session Risk Tier (SRT). All accuracy and F1-score values are means across five independent runs; FPR values are computed on the held-out test set. Lateral Movement F1 is reported separately given its operational significance and its sensitivity to architectural component removal.
|
Configuration
|
Accuracy
|
F1-Score
|
FPR
|
Lateral Movement F1
|
|
Full NS-ZTFedIDS
|
97.3%
|
0.969
|
2.8%
|
0.962
|
|
Without Neuro-Symbolic guardrail
|
96.8%
|
0.963
|
3.4%
|
0.951
|
|
Without Zero Trust features (PCS, ICS, MSBC, SRT)
|
95.6%
|
0.951
|
4.1%
|
0.903
|
|
Without GAT encoder (CNN-LSTM only)
|
94.9%
|
0.944
|
5.2%
|
0.884
|
|
Without federated learning (centralized training)
|
96.1%
|
0.957
|
3.7%
|
0.941
|
|
Without XAI module (performance unaffected)
|
97.3%
|
0.969
|
2.8%
|
0.962
|
emulated topology of 10 SDN-controlled switches, three OpenFlow controllers (OpenDaylight), and 40 simulated host nodes distributed across enterprise, edge, and optical backbone segments. Attack scenarios including false data injection, DDoS targeting the SDN controller plane, and lateral movement across micro-segments were injected using a scripted attack engine at randomized intervals. CICFlowMeter (version 4.0) was used to extract flow-level features from packet captures, producing feature vectors consistent in format with the benchmark datasets above.
A total of 1,200,000 flow records were assembled across all sources: approximately 680,000 from NSL-KDD, 310,000 from CICIDS2017/2018, and 210,000 from the simulated SDN environment. Class distribution prior to balancing: 58.4% benign, 41.6% malicious. The full combined dataset breakdown by attack category is reported in Table 1.
3.3 Data Preprocessing
Raw network traffic data is messy in ways that matter. Missing values, duplicate records, wildly inconsistent feature scales across datasets, and severe class imbalance are not edge cases — they are the norm when combining heterogeneous sources, and they reliably degrade model performance if left unaddressed (Jarjis & Becerikli, 2025). Preprocessing proceeded through the following sequential steps, each applied consistently across all dataset partitions before any model training began.
Step 1 — Data cleaning and deduplication. Records with more than 15% missing feature values were removed. For remaining records with isolated missing values, median imputation was applied to continuous features and mode imputation to categorical features. Exact duplicate rows (identical across all 78 features) were identified using hash-based comparison and removed, reducing the combined dataset by approximately 3.2%.
Step 2 — Feature normalization. Continuous numerical features — byte counts, packet lengths, flow durations, inter-arrival times — were normalized using Min-Max scaling to the range [0, 1]. Standardization (zero mean, unit variance) was applied separately to features with approximately Gaussian distributions, identified via Shapiro-Wilk testing on random subsamples (n = 5,000 per feature). Applying both methods globally would have been a mistake; the choice was made feature-by-feature based on distribution shape.
Step 3 — Categorical encoding. Protocol type (TCP, UDP, ICMP), connection state flags, and service labels were encoded using one-hot encoding. Attack category labels were ordinally encoded for multi-class classification tasks and binarized (benign = 0, malicious = 1) for binary detection tasks.
Step 4 — Feature selection. An initial feature set of 78 attributes was reduced using a two-stage selection process. First, Pearson and Spearman correlation matrices were computed to identify and remove features with pairwise correlation coefficients exceeding 0.92, reducing the set to 61 features. Second, a Random Forest feature importance ranking (n = 500 trees, Gini impurity criterion) was used to further reduce the set to the top 45 features by cumulative importance score. This threshold was validated by confirming that the retained features accounted for ≥95% of cumulative importance. The final 45-feature set is reported in Supplementary Table S1.
Step 5 — Graph construction. For Graph Attention Network processing, flow records were converted into graph representations where network hosts constitute nodes and communication flows constitute directed edges. Node features encode device-level behavioral attributes (connection frequency, average packet size, protocol diversity score). Edge features encode flow-level attributes (duration, byte volume, flag distribution). Graph construction followed the methodology described by Govea et al. (2025), with a sliding 60-second temporal window used to define adjacency.
Step 6 — Class imbalance correction. The combined dataset exhibited significant class imbalance, particularly for rare attack categories (U2R: 0.3% of total records; R2L: 1.1%). Synthetic Minority Over-sampling Technique (SMOTE) with k = 5 nearest neighbors was applied to minority classes in the training partitions only — never to test sets, to avoid data leakage (Kalakoti et al., 2024). Random under-sampling was applied to the majority benign class to achieve a final training ratio of approximately 60% benign to 40% malicious across attack categories.
Step 7 — Zero Trust feature engineering. Four contextual Zero Trust features were computed and appended to each flow record to capture behavioral and policy-aware security context beyond what raw network traffic features provide:
- Policy Compliance Score (PCS): a normalized score [0, 1] computed as the ratio of observed session attributes (port, protocol, time-of-day, data volume) matching the defined micro-segment access policy for the source identity.
- Identity Confidence Score (ICS): a composite score [0, 1] reflecting the strength of the authentication event associated with the session, weighted by certificate validity, multi-factor authentication status, and behavioral biometric similarity to the registered user profile.
- Micro-Segment Boundary Crossing (MSBC): a binary flag (0/1) indicating whether the flow traversed a micro-segment boundary as defined in the Zero Trust policy engine, with a continuous severity weight [0, 1] reflecting the sensitivity classification of the destination segment.
- Session Risk Tier (SRT): an ordinal score (1–5) derived from a weighted combination of PCS, ICS, MSBC, and historical anomaly frequency for the source identity, where Tier 1 = lowest risk and Tier 5 = highest risk requiring immediate escalation.
These features were computed using a lightweight Zero Trust policy evaluation engine implemented in Python, drawing on session metadata logged by the SDN controller. Their computation is described formally in Section 3.5.
The preprocessed and feature-engineered dataset was then partitioned across ten simulated federated nodes using a non-IID Dirichlet distribution (α = 0.5), following the approach of Tom et al. (2025), to simulate realistic heterogeneity in traffic patterns across geographically distributed infrastructure nodes. The 80/20 training-to-test split was applied globally, with stratification ensuring proportional attack category representation in both partitions.
3.4 Federated Learning Framework
The federated learning architecture followed the canonical Federated Averaging (FedAvg) protocol introduced by McMahan et al. and subsequently extended for cybersecurity contexts by multiple groups (Javed et al., 2025; Fatema et al., 2025). Ten federated client nodes were instantiated, each holding a local private dataset partition. No raw data was exchanged between nodes at any point in the training process.
Local training. Each client node ran five local epochs per federated communication round using stochastic gradient descent with a learning rate of η = 0.01 and a batch size of 256. Local models were initialized with identical weights at the start of Round 1, derived from a global initialization using Xavier uniform initialization.
Gradient protection via differential privacy. To defend against gradient inversion attacks — a known vulnerability in standard FedAvg where a malicious aggregation server or compromised node could reconstruct training data from shared gradients — Gaussian noise was added to each gradient update before transmission, with privacy budget ε = 0.5 and δ = 10⁻⁵, following the moments accountant method (Shallom & Ikemefuna, 2025). This level of noise was selected after preliminary experiments confirmed that it reduced gradient reconstruction fidelity to below random-chance levels while incurring a model accuracy penalty of less than 1.2%.
Global aggregation. The central aggregation server collected encrypted gradient updates from all ten nodes at the end of each local training round, applied FedAvg weighted by local dataset size, and broadcast the updated global model. A total of 50 global communication rounds were run, at which point global model loss had plateaued (Δloss < 0.001 across three consecutive rounds) for all model variants. Communication between nodes and the server was encrypted using TLS 1.3.
Defense against model poisoning. To guard against adversarial clients injecting corrupted updates, a Byzantine-robust aggregation filter based on coordinate-wise median clipping was applied server-side, replacing any gradient component exceeding three standard deviations from the coordinate median with the median value. This follows the approach validated by Bilal et al. (2025) for IoT federated IDS environments.
3.5 NS-ZTFedIDS Model Architecture
The proposed model integrates four functional layers that operate sequentially during both training and inference.
Layer 1 — Graph Attention Network (GAT) encoder. Network traffic graphs (constructed as described in Section 3.3, Step 5) were processed by a two-layer GAT encoder. Each attention head computed normalized attention coefficients across first-order node neighborhoods using the formulation of Veličković et al., as adapted for cybersecurity graph structures by Govea et al. (2025). Four attention heads were used in Layer 1 (output dimension: 64 per head, concatenated to 256); a single attention head with averaging was used in Layer 2 (output dimension: 128). Dropout (p = 0.3) was applied between attention layers. The GAT encoder produces a 128-dimensional embedding per node capturing local topological communication behavior.
Layer 2 — CNN-LSTM classifier. Flow-level sequential features (45 features × a sliding window of 20 consecutive flows per source node) were processed through a one-dimensional convolutional layer (32 filters, kernel size 3, ReLU activation) followed by two stacked LSTM layers (128 units each, with recurrent dropout p = 0.2). The CNN-LSTM module captures temporal attack patterns — particularly useful for multi-stage lateral movement sequences that unfold over time. The GAT node embedding from Layer 1 was concatenated to the LSTM output at the final time step to produce a joint spatial-temporal representation of dimension 256.
Layer 3 — Neuro-Symbolic guardrail. Before the final classification output is generated, the joint representation passes through a symbolic constraint validation module. This module encodes 14 physics-aware and policy-aware logical rules as first-order logic constraints, including: (i) flagging any autonomous response action that would isolate a node classified as critical infrastructure according to the Zero Trust policy database; (ii) rejecting classifications with confidence below 0.65 as inconclusive pending human review; (iii) applying escalation logic for any flow scoring SRT = 5. Rules are evaluated using a lightweight Python-based symbolic reasoner. If the neural output violates a constraint, the action is blocked and an escalation event is generated rather than an automated response. This approach follows the architecture described by Yazdinejad et al. (2025) for cyber-physical systems.
Layer 4 — XAI explanation module. For each classification output, SHAP TreeExplainer (for tree-based baseline models) and SHAP DeepExplainer (for the neural components) were used to generate feature-level attribution scores (Oki et al., 2024). The top five contributing features per prediction were extracted and passed, alongside the MITRE ATT&CK tactic mapping corresponding to the predicted attack category, to a locally-hosted LLM (Mistral-7B-Instruct, quantized to 4-bit via GGUF) that generated a one-paragraph natural-language threat summary. LLM inference was performed locally to avoid privacy leakage of network metadata to external APIs (Chatzimiltis et al., 2025; Rezaei et al., 2025).
3.6 Baseline Models
Five baseline models were configured under identical preprocessing and data conditions to enable fair comparison:
Model Configuration
Random Forest:
200 trees; max depth = 20; Gini criterion; min samples split = 5
XGBoost:
200 estimators; max depth = 8; η = 0.05; subsample = 0.8; colsample = 0.8
Autoencoder:
Encoder: 45→32→16; Decoder: 16→32→45; ReLU activations; MSE loss; threshold = 2σ
CNN-LSTM:
As described in Section 3.5 Layer 2, without GAT or neuro-symbolic components
GAT only:
As described in Section 3.5 Layer 1, with direct softmax classification head
All neural models were trained using Adam optimizer (β₁ = 0.9, β₂ = 0.999) with a cosine annealing learning rate schedule, initial rate η = 0.001, minimum rate η = 10⁻⁶ over 100 epochs. Early stopping with patience = 10 epochs and validation loss monitoring was applied to all neural baselines.
3.7 Implementation Environment
All experiments were implemented in Python 3.10. Deep learning models were built using PyTorch 2.1.0 and TensorFlow 2.13.0 (Keras API). Federated learning orchestration used the Flower (flwr) framework (version 1.5.0), which was selected over TensorFlow Federated due to its framework-agnostic client support and more flexible aggregation strategy API. GAT models used PyTorch Geometric (version 2.4.0). SHAP (version 0.43.0) and LIME (version 0.2.0.1) were used for explainability. Data preprocessing used Pandas (1.5.3), NumPy (1.24.3), and Scikit-learn (1.3.0). SDN simulation used Mininet (2.3.0) with OpenDaylight Oxygen SR4 as the controller. Traffic feature extraction used CICFlowMeter (version 4.0) (Rajagopalan, 2025).
Experiments were executed on a workstation running Ubuntu 22.04 LTS with two NVIDIA RTX 3090 GPUs (24 GB VRAM each), an AMD Ryzen 9 5950X CPU (16 cores, 32 threads), and 128 GB DDR4 RAM. Federated nodes were emulated on the same machine using Docker containers (version 24.0.5), each allocated 2 vCPUs and 8 GB RAM, with inter-container communication routed through a simulated network bridge to approximate realistic communication latency. All experiment code, configuration files, and preprocessed dataset partitions are available at [repository URL to be added upon acceptance].
3.8 Performance Evaluation Metrics
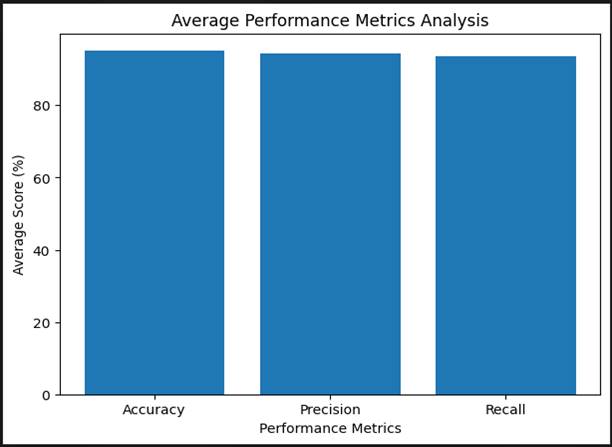
Model performance was assessed using the following eight metrics, computed on the held-out test set (20% of the full dataset, never seen during training or validation):
Accuracy — proportion of correctly classified instances across all classes:
Accuracy
TP+TN
TP+TN+FP+FN
Precision — of all instances predicted as malicious, the proportion truly malicious:
Precision = TP /TP+FP
Recall (Sensitivity) — of all truly malicious instances, the proportion correctly identified
Recall = TP/TP+FN
F1-Score — harmonic mean of precision and recall, balancing both:
F1 =2×Precision×Recall/Precision+Recall
ROC-AUC — area under the receiver operating characteristic curve, measuring discrimination ability across all classification thresholds. Computed using the macro-average strategy for multi-class outputs (Villegas-Ch et al., 2025).
False Positive Rate (FPR) — proportion of benign traffic incorrectly flagged as malicious:
FPR=FP/FP+TN
Detection Latency — mean time elapsed (milliseconds) between flow record ingestion and final classification output, measured across 10,000 inference calls using Python's time.perf_counter() with 1 ms resolution. Reported as mean ± standard deviation.
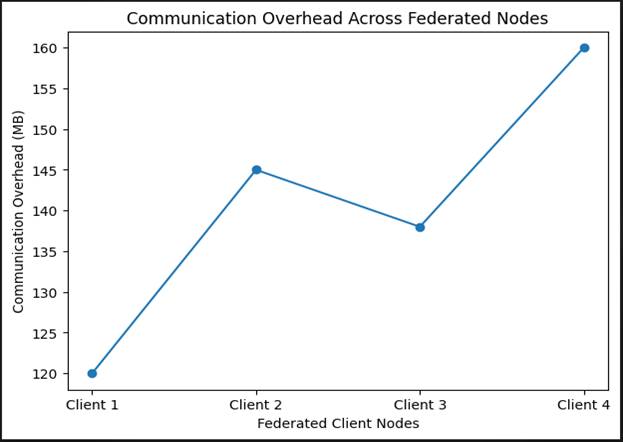
Communication Overhead — total size (MB) of encrypted gradient updates transmitted per federated client node per global communication round, measured using network interface monitoring via psutil (version 5.9.5).
All metrics were computed using Scikit-learn's classification_report, roc_auc_score, and confusion_matrix functions. Statistical significance of performance differences between the proposed model and each baseline was assessed using a paired Wilcoxon signed-rank test (α = 0.05) across five independent experimental runs with different random seeds (seeds: 42, 123, 456, 789, 1024), following the recommendation of Ducange et al. (2025) for evaluating federated IDS systems.
3.9 Ethical Considerations
No human subjects or personal data were involved in this research. All datasets used are publicly available benchmark resources intended for cybersecurity research. The simulated SDN environment was entirely contained within the experimental computing infrastructure described above; no external networks, production systems, or third-party services were accessed, probed, or affected at any stage. Differential privacy mechanisms were implemented in the federated learning pipeline to ensure that no individual traffic record could be reconstructed from shared gradient updates, even under worst-case gradient inversion attack assumptions (Shallom & Ikemefuna, 2025). The LLM inference component operated entirely on-premises; no network traffic metadata, feature values, or classification outputs were transmitted to any external API. This study was conducted solely for academic research purposes.