3.1 Baseline Characterization of the Shop Floor Management System
Before any integration of new technologies could be considered, it was necessary to understand — with some precision — what the existing shop floor actually looked like. Not in the abstract, but operationally: where time was being lost, which departments were underperforming, and why. This diagnostic work is sometimes treated as a formality in manufacturing research, a box to check before moving to the interesting part. In this study, it turned out to be anything but.
The facility under examination produced skid steer loaders across five departments — Assembly, Fabrication, Painting, Hot Testing, and Quality Inspection — operating through 25 workstations with a workforce of 52 personnel (Table 1). On paper, the operation ran a 570-minute working day with 75 minutes of scheduled downtime, leaving an effective production window of 495 minutes per shift. The total cycle time recorded across all departments, however, was 6,800 minutes — a figure that, when set against the available productive time, signals something considerably more disorganized than routine inefficiency. Combined idle time stood at 470 minutes. Production planning was documented as "random." No condition monitoring system was in place. No standardized operational guidelines existed (Table 1). These were not minor gaps.
What emerged from the initial shop floor characterization was a facility that had, in many respects, outgrown its own management systems. Semi-automation had been introduced incrementally, but the surrounding processes — scheduling, monitoring, quality control — remained largely manual and reactive. Moeuf et al. (2018) described this profile as characteristic of SMEs caught between legacy operations and the expectations of Industry 4.0: possessing the physical infrastructure for modernization, but lacking the data systems and process discipline to leverage it.
3.2 Departmental Performance Analysis: Where the System Was Failing
Breaking the aggregate figures down by department revealed a more differentiated picture — and, importantly, suggested that the causes of inefficiency were not uniform across the facility (Table 2).
Assembly carried the heaviest burden. With a cycle time of 2,895 minutes, idle time of 140 minutes, and 240 minutes of recorded downtime per cycle, it was by some margin the most troubled department (Table 2). The contributing problems were varied and, in combination, mutually reinforcing: ergonomic issues created physical discomfort and slowed operator throughput; poor work allocation meant tasks were unevenly distributed; defect rates generated rework loops; and congestion between adjacent workstations created spatial bottlenecks that no amount of individual effort could fully compensate for. These are, it should be noted, exactly the kinds of problems that Lean methodologies were designed to surface — and that IoT-based monitoring can help sustain improvements against, once Lean interventions have been applied (Chiarini & Kumar, 2021).
Fabrication, by contrast, had a much shorter cycle time (860 minutes) but suffered from machinery malfunction, safety incidents, and frequent platform changeovers (Table 2). The relatively compact cycle time is somewhat misleading here — what the data cannot show directly, but what supervisory discussions confirmed, is that this department's downtime events (105 minutes) were often sudden and unplanned, the kind that propagate disruption downstream rather than simply absorbing time locally. Wang et al. (2018) noted precisely this distinction between predictable and unpredictable downtime in IoT-monitored manufacturing environments, finding that the latter category is disproportionately costly relative to its measured duration.
Painting presented a different challenge again: 2,015 minutes of cycle time, 330 minutes of downtime — the highest downtime of any department — driven primarily by poor material handling control and irregular gaps between parts arriving at the station (Table 2). Some painting services had been outsourced, which introduced additional coordination complexity that the existing planning system (recall: "random") was poorly equipped to manage. Hot Testing recorded 1,830 minutes of cycle time alongside 150 minutes of downtime, with supervisors citing a lack of forward planning and inconsistent vehicle positioning as the principal sources of delay (Table 2). Quality Inspection, finally, logged 1,030 minutes of cycle time and 165 minutes of downtime, attributable largely to manual, unplanned inspection processes and the continuous rotation of operators across stations — a practice that, however common, reliably increases variability and error rates (Rahardjo et al., 2023).
Taken together, these figures point to a shop floor where inefficiency is structural, not incidental. The problems are not concentrated in one weak department that could be isolated and fixed; they are distributed, interconnected, and — in several cases — actively amplified by the absence of the monitoring and planning infrastructure that IoT and AI are precisely designed to provide (Trakadas et al., 2020).
3.3 Anomaly Classification and Technology-Matched Interventions
With the departmental performance baseline established, the next step was to classify the identified anomalies more systematically — not simply listing what was wrong, but organizing it in a way that made the path to intervention legible. Five anomaly categories emerged from the combined analysis of production records, site observations, and supervisory discussions: machinery, manpower, layout, quality, and operational constraints (Table 3).
Machinery anomalies — elevated vibration, thermal irregularities, unexpected breakdowns, and excess energy consumption — were, somewhat unsurprisingly, the most straightforward to address conceptually. Real-time online monitoring via IoT sensors offers a direct and well-validated response to exactly this category of problem. Vlachos et al. (2023) demonstrated in an AGV/IoT integration study that continuous sensor-based monitoring of equipment parameters can reduce unplanned breakdown frequency substantially, by converting reactive maintenance into a predictive regime where faults are flagged before they become failures (Table 3).
Manpower anomalies — particularly operator disengagement and uneven task distribution — were subtler. The proposed response here was a feedback-based work allocation system, drawing on historical production data to assign tasks more equitably and to flag when individual workstations were consistently over- or underloaded. This is less a technological fix than a data-informed management intervention, and its success depends at least as much on organizational buy-in as on the quality of the underlying data (Table 3).
Layout anomalies, principally unnecessary operational stoppages and suboptimal inter-station distances, called for AI-assisted path optimization — an application that Wang et al. (2020) examined in the context of augmented reality-enhanced shop floor management, finding that spatial inefficiencies are often invisible to the people working within them but highly legible to analytics systems with a whole-floor view (Table 3). Quality anomalies, including data entry errors and missing components, were mapped to smart sensor deployment and continuous online monitoring — interventions that reduce human error by catching deviations at the point of origin rather than at final inspection (Table 3). Operational constraint anomalies — variability in timing, resource unavailability — were assigned to online analysis systems and smart device integration, enabling more responsive, real-time adjustment than periodic manual review allows (Table 3).
3.4 The DMAIC-Integrated Technology Framework
The anomaly analysis above provided the empirical foundation for the study's central contribution: a structured framework for integrating IoT, AI, and Lean practices within the DMAIC cycle of continuous improvement. It is worth being clear about what this framework is and what it is not. It is not a guarantee of outcomes — the literature is full of integration initiatives that were well-designed in principle and poorly executed in practice. What it offers, rather, is a structured sequence of decisions and actions that manufacturing facilities — particularly SMEs — can follow without requiring the level of technical infrastructure that large-enterprise implementations typically assume (Figure 1).
The Define phase establishes the problem perimeter: which departments, which metrics, which performance gaps constitute the priority targets. This phase relies primarily on the kind of observational and records-based data collection described in Section 2 — identifying, in concrete terms, where the facility's current state diverges from its operational potential. The Measure phase deploys IoT sensors and AI/ML analytics to generate the quantitative baseline: defect rates, cycle times, energy profiles, downtime frequencies. Big data analytics during this phase creates the measurement infrastructure against which all subsequent improvement will be assessed. Ciano et al. (2021) demonstrated the value of establishing this baseline rigorously, noting that improvement claims made without a credible pre-intervention benchmark are essentially unverifiable.
The Analyze phase is where AI earns its place most clearly. Root cause analysis, supported by machine learning outputs from the IoT data stream, allows the team to distinguish between correlated and causal factors — a distinction that manual analysis frequently fails to make reliably. Value Stream Mapping (VSM), applied here as a complementary qualitative tool, visualizes the full production flow and makes visible the hand-off points where delays accumulate. Together, these two analytical modes provide a more complete picture than either offers alone. The Improve phase then moves from diagnosis to intervention — testing solutions identified through the Analyze phase, drawing on Digital Twin simulation where available, and integrating Blockchain-based verification where data integrity across suppliers or subcontractors is a concern (Tripathi et al., 2022). Lean tools — 5S, Six Sigma, Kaizen events — operate continuously through this phase, ensuring that technological improvements are embedded in standardized work practices rather than layered on top of unchanged habits (Figure 2).
The Control phase, finally, ensures that improvements do not simply erode over time — a genuine risk that the continuous improvement literature has documented repeatedly (Glover et al., 2015). Standardized monitoring
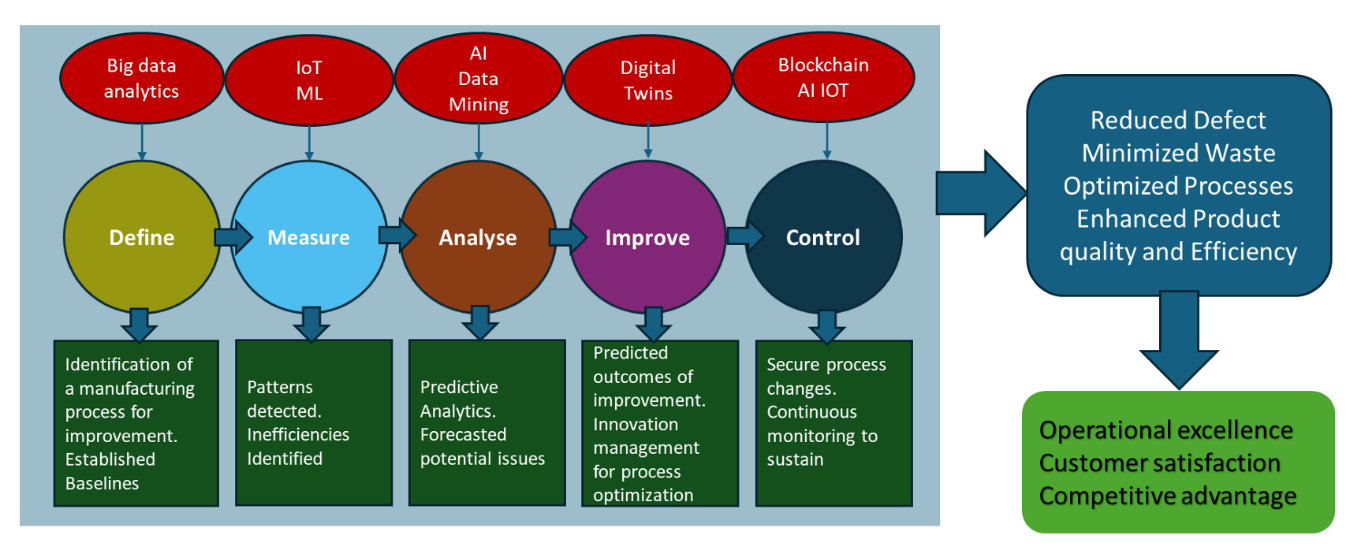
Figure 1. Strategic Integration of IoT, AI, and Lean Practices Within the DMAIC Framework for Manufacturing Process Optimization. A conceptual process diagram illustrating how IoT sensor networks, AI-driven analytics, Lean manufacturing tools, and blockchain verification are operationally mapped onto the five sequential phases of the DMAIC (Define, Measure, Analyze, Improve, Control) cycle. Beginning with the Define phase — where cross-functional teams establish key performance objectives and identify priority intervention areas — the framework progresses through the Measure phase (IoT sensor deployment and AI/ML-based data collection establishing the quantitative performance baseline), the Analyze phase (AI-assisted root cause analysis and Value Stream Mapping identifying causal inefficiencies), and the Improve phase (targeted interventions informed by pilot testing, with Digital Twin simulation and blockchain integration supporting secure, sustained process optimization). The Control phase closes the cycle, embedding continuous monitoring protocols, automated alert systems, and Kaizen review cadences to ensure that achieved improvements are maintained and progressively built upon rather than allowed to erode. The integration architecture depicted here reflects the framework applied in the present study and is intended to be adaptable to a range of SME manufacturing contexts without requiring full simultaneous deployment of all components. Adapted from Tripathi et al. (2022).
Table 3. Anomaly Classification Matrix and Technology-Matched Intervention Recommendations for the Shop Floor Management System (SFMS). A structured mapping of the five principal anomaly categories identified through the combined analysis of IoT sensor data, production records, and qualitative supervisory discussions, presented alongside specific technology-based intervention recommendations for each category. The five categories — machinery, manpower, layout, quality, and operational constraints — were derived inductively from the diagnostic phase findings and reflect the distinct causal mechanisms driving inefficiency across the facility's departments. Machinery anomalies, including elevated vibration, thermal irregularities, and excess energy consumption, are matched to online real-time monitoring solutions. Manpower inefficiencies, such as operator disengagement and uneven task distribution, are addressed through feedback-driven work allocation systems informed by historical production data. Layout anomalies are assigned AI-assisted path optimization and online control systems. Quality deficiencies — data errors and missing components — are paired with smart sensor deployment and continuous monitoring. Operational constraint anomalies, including timing variability and resource unavailability, are matched to online analytical systems and integrated smart devices. This matrix is intended to function as a practical diagnostic reference for facilities undertaking similar integration initiatives.
|
Factor
|
Anomalies
|
Suggested Action
|
|
Machinery
|
Higher vibration, heating, breakdown, excess energy consumption
|
Online monitoring and measurement
|
|
Manpower
|
Non-involvement, inefficiency
|
Work allotment by a feedback system, transfer, and previous data records
|
|
Layout
|
Unnecessary stoppage during operations, random distance
|
Analyzed optimum path decision, online controlling system
|
|
Quality
|
Data error, missing parts
|
Smart sensors, online monitoring
|
|
Constraints
|
Variation, unavailability
|
Online analysis system, smart devices
|
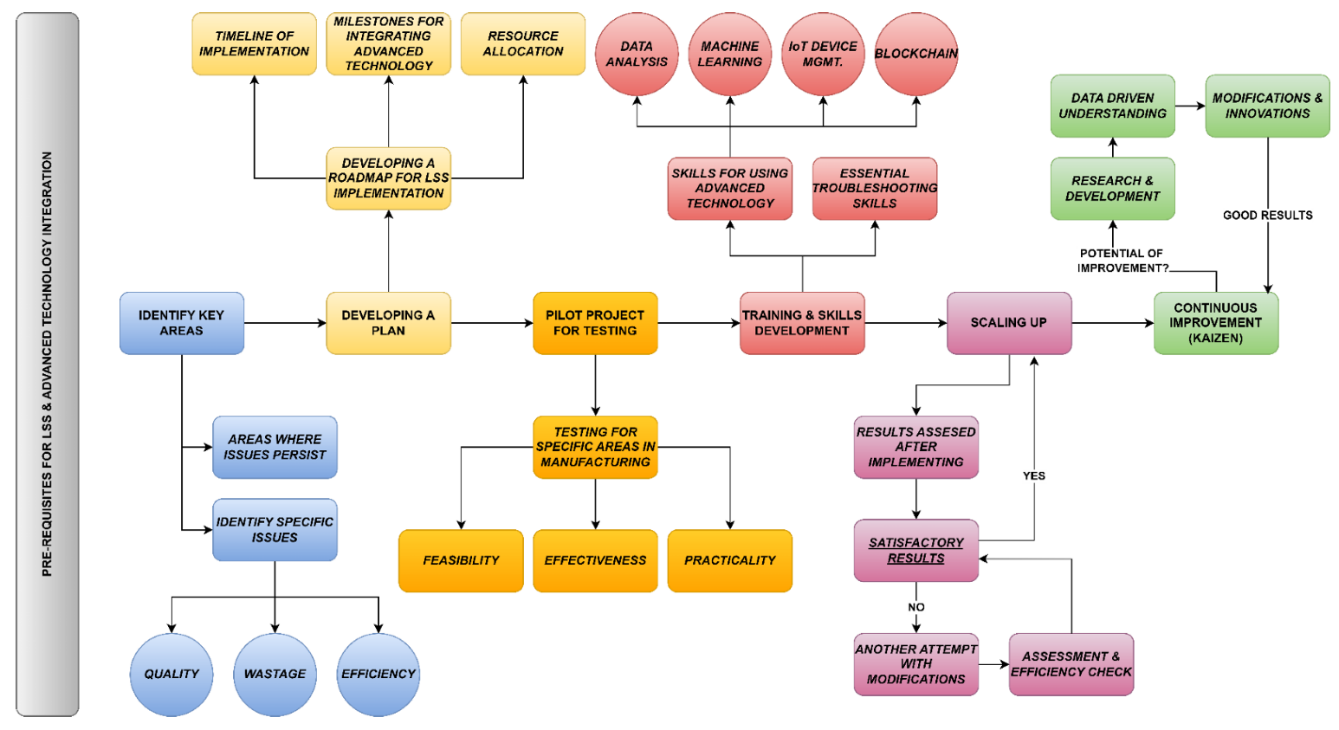
Figure 2. Prerequisites and Process Flow for Lean Six Sigma and Advanced Technology Integration in Manufacturing. A sequential flow diagram depicting the preparatory and implementation stages required before and during the integration of Lean Six Sigma (LSS) with Industry 4.0 technologies — specifically IoT sensor networks, AI analytics platforms, and blockchain-based data verification. The flow begins with the identification and prioritization of key operational problem areas, proceeds through strategic roadmap development and cross-functional team formation, and advances to a controlled pilot project phase in which the proposed integration is tested in a bounded production area before broader rollout. Subsequent stages address the iterative monitoring and evaluation of pilot outcomes, the data-driven scaling decision, and the institutionalization of continuous improvement through Kaizen cycles. Throughout, the diagram emphasizes that technology integration is not a discrete event but a staged organizational process — one where early investment in Lean discipline and data infrastructure substantially improves the probability that subsequent AI and IoT deployments will deliver and sustain measurable operational gains. The prerequisite structure depicted is consistent with the implementation sequence recommended in the present study and reflects findings from comparable integration initiatives documented in the literature. Adapted from Florescu & Barabas (2022).
Table 4. Summary of Prior Innovation Techniques and Reported Outcomes in IoT, AI, and Lean Manufacturing Integration Research. A synthesized review of 17 published studies reporting implementation outcomes relevant to the strategic integration of IoT, artificial intelligence, Lean manufacturing principles, and Industry 4.0 technologies in manufacturing environments. For each entry, the specific innovation technique or framework proposed is described alongside the principal outcome reported and the corresponding authorship citation. Studies span the period 2015–2023 and encompass a range of manufacturing contexts, scales, and integration approaches — including Smart Manufacturing frameworks (Rahardjo et al., 2023), shop floor material delivery optimization (Tripathi et al., 2022), IoT-based industrial monitoring (Ciano et al., 2021), Lean Smart Manufacturing in the bicycle sector (Li, 2019), augmented reality-enhanced shop floor management (Wang et al., 2020), and digital twin integration (Ciano et al., 2021). Collectively, these studies support the thesis that combined IoT-AI-Lean integration consistently outperforms single-technology approaches — while also revealing the implementation gaps, particularly for SMEs, that motivated the framework proposed in this study. Readers should note that outcome reporting varies across studies in specificity and measurement approach; direct quantitative comparison across rows is not recommended.
|
Innovation Techniques
|
Result
|
Author
|
|
Proposed a Smart Manufacturing framework for Industry 4.0.
|
This framework led to improvements in workload and efficiency within the smart manufacturing system.
|
(Rahardjo et al., 2023)
|
|
Developed a framework for shop floor material delivery using real-time manufacturing big data.
|
The framework improved shop floor material delivery performance through real-time and multi-source data integration.
|
(Tripathi et al., 2022)
|
|
Developed an IoT framework to monitor and control industrial data.
|
The IoT framework enhanced productivity and provided insights into production line performance.
|
(Chiarini & Kumar, 2021)
|
|
Implemented Lean Smart Manufacturing (LSM) in a bicycle industry.
|
LSM was found efficient in enhancing production, confirming the benefits of integrating lean production and smart manufacturing.
|
(Shahin et al., 2020)
|
|
Developed a roadmap for Smart Manufacturing.
|
The framework provided an effective production management system for small and medium enterprises (SMEs).
|
(Shrouf & Miragliotta, 2015)
|
|
Discussed patterns of adoption for Industry 4.0 technologies in manufacturing firms.
|
Flexibilization, advanced automation, and virtualization were key factors in the complexity of implementing Industry 4.0.
|
(Li, 2019)
|
|
Discussed the characterization of a shop floor management system through smart technologies and digital features.
|
Data analytics, real-time monitoring, digital visualization tools, mobile devices, and automated reporting were found crucial for shop floor management.
|
(X. Wang et al., 2020)
|
|
Proposed a Smart Manufacturing system based on Ubiquitous Augmented Reality technology for the shop floor.
|
The system integrated task scheduling and communication between users and the system effectively.
|
(Florescu & Barabas, 2022)
|
|
Investigated the direct effect of Industry 4.0 technologies on sustainable organizational performance with lean manufacturing practices.
|
Industry 4.0 technologies enabled lean manufacturing practices, leading to improved sustainable organizational performance.
|
(Frank et al., 2019)
|
|
Developed an IoT framework for industrial data monitoring and control.
|
This IoT framework improved productivity and production prognosis for the production lines.
|
(Ciano et al., 2021)
|
|
Proposed a model for operations and supply chain management.
|
This model provided a robust tool for digital readiness in Industry 4.0.
|
(Chiarini & Kumar, 2021)
|
|
Identified how Lean Manufacturing (LM) contributes to continuous improvement in Industry 4.0.
|
Lean Manufacturing's adaptability was enhanced by integrating new techniques.
|
(Ciano et al., 2021)
|
|
Highlighted challenges faced by management systems in integrating sustainable smart manufacturing performance.
|
Improved environmental quality in manufacturing sectors through sustainable practices.
|
(Anosike et al., 2021)
|
|
Discussed a novel solution for global asset management for Industry 4.0.
|
Efficient asset tracking system was achieved, with benefits including scalability and continuous adaptation.
|
(Chiarini & Kumar, 2021)
|
|
Analyzed the current state of information technology in the mining industry.
|
Adoption of Industrial IoT led to operational improvements and standardized management systems.
|
(Shahin et al., 2020)
|
|
Investigated technological capabilities of IoT.
|
IoT technologies helped managers make efficient decisions through monitoring and measurement.
|
(Mendes et al., 2023)
|
|
Proposed a framework integrating digital twins of various shop floor perspectives into an end-to-end solution.
|
This framework helped generate predictable and expected outcomes, fulfilling short- and long-term business requirements.
|
(Ciano et al., 2021)
|
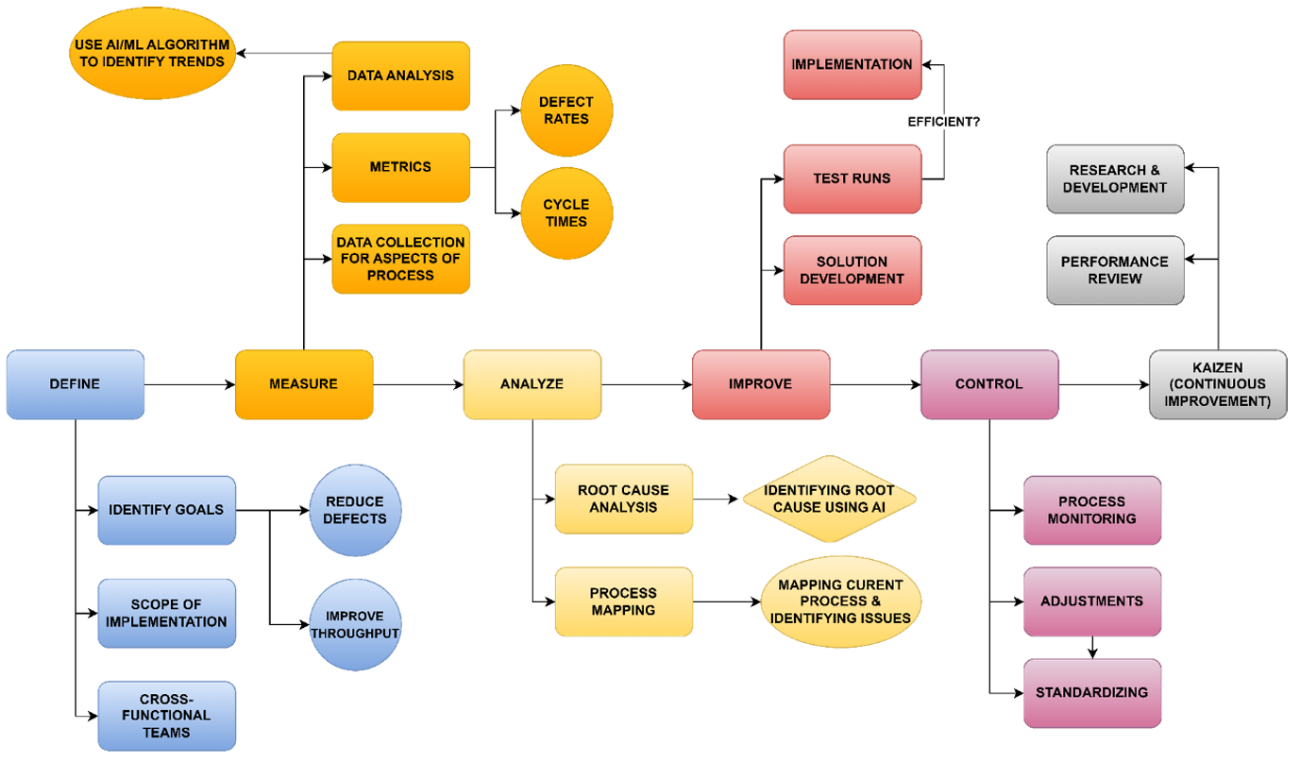
Figure 3. DMAIC-Structured Integration of IoT, AI, and Lean Practices for Sustained Operational Excellence. A detailed phase-by-phase depiction of the full DMAIC integration framework as applied in this study, illustrating the specific tools, technologies, and decision points operative at each stage. The Define phase establishes measurable performance targets and assembles the cross-functional implementation team. The Measure phase deploys IoT sensors across priority workstations — particularly in Assembly and Fabrication, where baseline anomaly density was highest (Table 2) — and establishes the quantitative data architecture for ongoing performance tracking. The Analyze phase applies AI-driven pattern recognition and root cause analysis to the sensor data stream, complemented by Value Stream Mapping to visualize end-to-end production flow and identify where delays compound. The Improve phase introduces targeted technology and process interventions — 5S workplace organization, Six Sigma defect reduction, AI-optimized scheduling, and IoT-enabled predictive maintenance — validated first through pilot testing before facility-wide implementation. The Control phase embeds standardized monitoring protocols, automated deviation alerts, and structured Kaizen review cycles to sustain performance gains over time and prevent the improvement erosion documented in comparable long-term studies. The framework is presented as a replicable architecture for SME manufacturers seeking a structured, resource-proportionate pathway into Industry 4.0 integration, with phased entry points designed to accommodate varying levels of existing technical infrastructure. Adapted from Ciano et al. (2021).
protocols, automated alert systems, and periodic Kaizen reviews collectively maintain the gains achieved during the Improve phase and create the conditions for ongoing incremental improvement rather than a one-time step change (Figure 3).
3.5 Evidence from Comparable Implementations
To situate these findings in the broader literature, Table 4 summarizes relevant prior implementations of IoT, AI, and Lean integration across a range of manufacturing contexts. The pattern across these studies is not uniform — different settings, different technologies, different scales of implementation — but several consistent themes emerge (Table 4).
First, the combination of real-time monitoring and Lean process discipline consistently outperforms either approach alone. Rahardjo et al. (2023) found that smart manufacturing frameworks integrating Lean principles achieved efficiency improvements that technology-only implementations did not replicate. Second, the DMAIC structure provides a practical organizing logic that helps facilities avoid the common failure mode of deploying IoT sensors and AI tools without a clear analytical framework for acting on the data they generate — a problem that Hughes et al. (2022) identified as one of the central obstacles to Industry 4.0 adoption in SME contexts (Table 4). Third, and perhaps most practically relevant for facilities resembling the one studied here, scalability matters enormously. Florescu & Barabas (2022) showed that smart manufacturing systems designed with modularity in mind — where IoT coverage and AI analytical depth can be expanded incrementally — achieved higher long-term adoption rates than those requiring full upfront deployment. That finding shaped the implementation strategy proposed in this study from the outset.
