Energy Environment and Economy

Energy, Environment and Sustainable Sciences | online ISSN 3069-0935
2
Citations
26.5k
Views
24
Articles
Your new experience awaits. Try the new design now and help us make it even better
Switch to the new experience
Figures and Tables
RESEARCH ARTICLE   (Open Access)

Practitioner Perceptions of Green Infrastructure for Urban Stormwater Management and Flood Mitigation in the United States: A Cross-Sectional Survey of Awareness, Effectiveness, Adoption, and Barriers

Nipa Akter1*, Muhammad Yousuf Almunshi1

+ Author Affiliations

Energy Environment and Economy 3 (1) 1-13 https://doi.org/10.25163/energy.3110767

Submitted: 29 July 2025 Revised: 07 October 2025  Published: 14 October 2025 


Abstract

Background: Urban flooding in the United States is becoming harder to manage as impervious surfaces expand and precipitation patterns shift. Green infrastructure (GI) — green roofs, rain gardens, bioswales, permeable pavements, urban trees, and retention ponds — has emerged as a promising complement to conventional drainage, though adoption has been uneven across urban contexts. What remains less well understood is how practitioners themselves perceive these systems and what they see as the obstacles to broader implementation.

Methods: A cross-sectional, quantitative survey was conducted with 215 professionals working across U.S. metropolitan, coastal, suburban, inland, and small-city settings. Respondents included engineers, academics, government officials, and allied professionals, recruited through stratified purposive sampling. A pre-tested structured questionnaire captured awareness, perceived effectiveness, adoption levels, environmental and social benefits, and implementation barriers. Data were analyzed using descriptive statistics and Pearson correlation, with significance set at p < 0.001.

Results: Awareness was high across all six GI system types, peaking at 75.3% for urban trees. Retention ponds (64.5%) and permeable pavements (61.7%) drew the strongest very-effective ratings. Adoption varied substantially by urban context — 72.6% in major metropolitan regions versus 38.7% in small cities. All six hypothesized associations reached significance, with awareness positively linked to adoption (r = 0.62) and barriers negatively linked (r = −0.55).

Conclusion: Practitioners largely understand and endorse GI, but persistent institutional and financial barriers — particularly outside large coastal and metropolitan areas — continue to slow implementation. Closing this gap will likely require coordinated investments in funding, technical capacity, and policy clarity rather than awareness alone.

Keywords: Green infrastructure, Urban stormwater management, Flood mitigation, Climate adaptation, Practitioner perceptions

1. Introduction

Cities across the United States are, by most accounts, becoming harder places to manage water in. Heavier downpours, longer dry spells punctuated by sudden cloudbursts, and the steady creep of pavement across what used to be soil — these are not separate stories but tangled threads of the same urban predicament (Kim, 2017). Roughly eighty percent of urban flooding, by some estimates, can be traced back to the simple fact that water has fewer places to go: rooftops, roads, and parking lots shed runoff faster than aging drainage systems can carry it away (Kumareswaran & Jayasinghe, 2023). It is tempting to frame this as an engineering problem with an engineering answer, but the picture is messier than that. Conventional gray infrastructure — pipes, culverts, detention basins — was designed for a climate that, in many regions, no longer exists (Lee et al., 2021).

Green infrastructure, or GI, has emerged over the past decade or so as something between a remedy and a philosophy. The term covers a fairly wide family of approaches: green roofs, rain gardens, bioswales, permeable pavements, urban tree canopies, and retention ponds, among others. What they share is a working logic that borrows from natural hydrology rather than fighting it, letting water infiltrate, evaporate, or be taken up by vegetation rather than rushing it offsite (Herath et al., 2023; Rayan et al., 2022). The evidence base, while not yet settled, is encouraging. Well-designed GI installations have been shown to cut surface runoff by somewhere in the range of sixty to eighty percent, depending on site conditions and design choices (Khodadad et al., 2023). And the co-benefits — cooler streets, cleaner waterways, more habitat, sometimes even higher property values — are not trivial.

Yet adoption has been uneven, and the reasons are not always the obvious ones. Larger metropolitan regions and coastal cities, perhaps because their flood risks are more visible or their budgets more elastic, have moved comparatively quickly (Sánchez & Govindarajulu, 2022). Smaller inland municipalities have lagged, hindered by some combination of constrained budgets, thin technical staffing, and policy environments that do not always reward green alternatives (Song et al., 2022). The result is a patchwork in which the communities that might benefit most from sustainable drainage are sometimes the ones least equipped to install it — an equity problem that runs alongside the engineering one (Liu et al., 2019).

What remains underexplored, and this is where the present study tries to be useful, is the human side of the equation. Most existing work concentrates on technical performance — how a bioswale handles a hundred-year storm, what infiltration rates a permeable pavement can sustain — and rather less on what the people designing, funding, and living with these systems actually think about them (Argyroudis et al., 2021). Awareness, perceived effectiveness, and the everyday barriers practitioners encounter likely shape adoption as much as any hydraulic calculation does, but they have rarely been examined together in a single U.S. context.

This study, therefore, sets out to do something fairly modest in scope but, we hope, useful in framing. Drawing on responses from stakeholders working across a range of American urban settings, it looks at five interrelated questions: how well GI systems are understood, how effective they are perceived to be, where adoption is actually occurring, what environmental and social benefits respondents see in them, and what stands in the way of broader implementation. The aim is not to settle the technical debate but to map the perceptual terrain on which that debate is unfolding — because policy, in the end, tends to follow perception almost as closely as it follows physics.

2. Materials and Methods

2.1 Study Design and Setting

This study followed a cross-sectional, quantitative survey design, which seemed the most defensible choice given the goal: to capture a snapshot of how stakeholders across the United States currently perceive, use, and struggle with green infrastructure (GI) for stormwater management. A cross-sectional approach trades depth-over-time for breadth-at-a-moment, and that trade-off felt appropriate here, since the questions of interest concerned current awareness, current adoption patterns, and present-day barriers rather than longitudinal change (Lund et al., 2019). The study was conducted between [insert start month/year] and [insert end month/year], with data collection running for approximately [insert duration, e.g., twelve weeks].

The geographic scope was deliberately broad. Respondents were drawn from four urban typologies — major metropolitan regions, coastal cities, inland municipalities, and smaller towns — chosen because prior work suggests that urbanization intensity and exposure to climate hazards shape GI uptake in measurably different ways (Salam et al., 2025). No single city was treated as the unit of analysis; rather, the study aimed for a composite picture of practitioner experience across these settings. Reporting in this section follows STROBE guidance for cross-sectional studies, to the extent applicable.

2.2 Participants and Eligibility Criteria

Participants were professionals with direct or supervisory involvement in urban infrastructure, environmental management, climate adaptation planning, or municipal policy. Four occupational strata were defined a priori: practicing engineers (civil, environmental, water resources), academics working in related fields, government officials with planning or environmental portfolios, and a fourth category covering allied professionals such as landscape architects, sustainability consultants, and NGO staff. To be eligible, respondents had to be (i) at least eighteen years of age, (ii) currently working in the United States, (iii) able to read English at a professional level, and (iv) able to confirm a minimum of one year of relevant professional experience. Individuals who did not meet all four criteria, or who completed less than eighty percent of the questionnaire, were excluded from the final analysis.

2.3 Sample Size and Sampling Strategy

A target sample of two hundred to two hundred fifty respondents was set in advance, based on a power calculation for Pearson correlation analysis assuming a medium effect size (r ≈ 0.25), a two-tailed alpha of 0.05, and statistical power of 0.95 — which yielded a minimum required sample of approximately 193. The final analytic sample comprised 215 valid responses.

Recruitment used a stratified approach intended to balance representation across the four occupational groups and, secondarily, across age bands and urban settings. The honest characterization is that this was stratified purposive sampling supported by professional network outreach rather than true probability sampling — a limitation we return to later. Initial invitations were distributed through institutional mailing lists, professional associations active in urban planning and climate adaptation, and academic networks accessible to the research team (Cousins, 2018). Snowball referrals were permitted within each stratum but capped so that no single referral chain contributed more than ten respondents, an approach intended to limit clustering bias (Lerer et al., 2017).

2.4 Survey Instrument

Data were collected using a structured, self-administered questionnaire developed specifically for this study. The instrument was organized into six sections, in the following order: (i) demographic and professional background, (ii) awareness of GI system types, (iii) perceived effectiveness of GI for flood mitigation, (iv) adoption levels observed in the respondent's working context, (v) implementation barriers, and (vi) perceived environmental and social benefits (Zaręba et al., 2022).

Awareness items asked respondents to rate their familiarity with six common GI system types — green roofs, rain gardens, bioswales, permeable pavements, urban trees, and retention ponds — on a three-point scale (high / moderate / low). Effectiveness items used a five-point Likert scale ranging from "very ineffective" to "very effective." Adoption was captured through a context-specific item asking respondents to estimate the share of GI implementation in their primary working area, with categorical response options (high, moderate, low). Barrier items asked respondents to rate the influence of nine pre-specified obstacles (cost, policy gaps, technical capacity, maintenance burden, public acceptance, land availability, regulatory complexity, financing mechanisms, and inter-agency coordination) on a five-point Likert scale. Benefit perception items used the same five-point agreement scale (Haruna et al., 2018).

The questionnaire was developed iteratively. An initial item pool was drafted from the existing GI literature, then reviewed by three subject-matter experts (one practicing engineer, one academic, one municipal planner) who were not subsequently included in the main sample. Their feedback informed item rewording, the removal of two redundant items, and clarification of two ambiguous response anchors. A pilot test was then conducted with fifteen respondents drawn from the target population; pilot data were used only to refine the instrument and were not included in the final analytic dataset. Internal consistency was assessed on the main sample using Cronbach's alpha for each multi-item construct, with values above 0.70 considered acceptable.

2.5 Constructs and Measurement Framework

Six composite constructs were derived from the questionnaire items. Green Infrastructure adoption (GI) reflected the respondent's reported scale of GI use in their working context. Flood Mitigation Response (FMR) and Climate Stress Mitigation (CSM) were derived from perceived-effectiveness items grouped by intended outcome (Puntub & Greiving, 2022). Awareness (AWA) was a composite of the six familiarity items. Barrier Index (BRI) was the mean of the nine barrier items, recoded so that higher scores indicated greater perceived obstruction (Cheshmehzangi, 2022). Sustainability Benefit Level (SBL) was constructed from the environmental and social benefit items. Each composite was computed as the mean of its component items after confirming acceptable internal consistency (Fohlmeister et al., 2015). The choice to work with composites rather than individual items was made partly for parsimony and partly because the conceptual framework treats these as latent perceptual domains rather than discrete observations (Bazbauers, 2021).

2.6 Data Collection Procedure

The questionnaire was hosted on a secure online survey platform and distributed via email invitation containing a unique, single-use access link. Reminders were sent at two-week intervals, with a maximum of three reminders per invitee. The median completion time was approximately fourteen minutes. No financial incentive was offered. Responses were anonymized at the point of collection, with no IP addresses or identifying metadata retained in the analytic dataset.

Ethical approval was obtained from the [insert institutional review board name and approval number] prior to data collection. All participants reviewed an electronic informed consent statement describing the study purpose, voluntary nature of participation, data handling procedures, and right to withdraw at any point before submission; consent was indicated by an affirmative click before access to the questionnaire was granted.

2.7 Data Analysis

Analyses were conducted in [insert software, e.g., IBM SPSS Statistics version 28 or R version 4.3.1]. Descriptive statistics — frequencies, percentages, means, and standard deviations — were used to summarize demographic characteristics and item-level responses (Kim, 2017). Pearson correlation coefficients were calculated to examine the strength and direction of associations among the six constructs (Addabbo et al., 2023). Statistical significance was evaluated at a threshold of p < 0.001, a conservative choice intended to reduce the risk of false positives given that six pre-specified relationships were tested simultaneously (Srivastav et al., 2021). Ninety-five percent confidence intervals were computed for each correlation coefficient.

We want to be transparent about one point: the correlational analysis describes associations and does not, on its own, support directional causal claims. The six hypotheses are therefore stated and interpreted as proposed associations within a conceptual framework, not as confirmed causal pathways. Missing data were handled using listwise deletion, which the low item-level missingness rate (under three percent across all items) made defensible (Belčáková et al., 2019).

3. Results

3.1 Who Responded: Demographic and Professional Profile

The final analytic sample comprised 215 respondents, distributed across age bands and occupational categories in a way that broadly reflected the intended stratification (Table 1). Mid-career professionals between thirty-one and forty-five years of age formed the largest single group, accounting for just over a third of the sample (36.3%). They were followed by younger professionals in the eighteen-to-thirty range (28.8%) and a substantial mid-to-late-career cohort aged forty-six to sixty (25.6%). Respondents older than sixty made up the remaining 9.3%. The skew toward mid-career participants was not unexpected; this is the demographic most likely to hold the kind of project-leading or decision-influencing roles that shape day-to-day GI implementation.

Occupationally, engineers were the largest group at 40.9%, which is consistent with the central role this profession plays in stormwater system design and review. Academics accounted for 25.1% of responses, government officials for 20.9%, and a fourth category covering allied professionals — landscape architects, sustainability consultants, NGO staff — made up the remaining 13.0%. The four-way distribution, while not perfectly balanced, gave the dataset enough diversity to compare perspectives across professional vantage points rather than relying on a single occupational lens.

3.2 Awareness of Green Infrastructure Systems

Awareness levels were, on the whole, high across all six GI system types surveyed (Figure 1). Urban trees recorded the highest familiarity, with 75.3% of respondents

Table 1. Demographic and professional characteristics of survey respondents (N = 215). Frequencies and percentages are reported across two stratification variables: age band (18–30, 31–45, 46–60, and 60+ years) and professional category (engineers, academics, government officials, and allied professionals including landscape architects, sustainability consultants, and NGO staff). Percentages are calculated within each category and may not sum to 100% due to rounding.

Category

Group

Frequency

Percentage (%)

Age

18–30

62

28.8

31–45

78

36.3

46–60

55

25.6

60+

20

9.3

Profession

Engineer

88

40.9

Academic

54

25.1

Government Official

45

20.9

Others

28

13.0

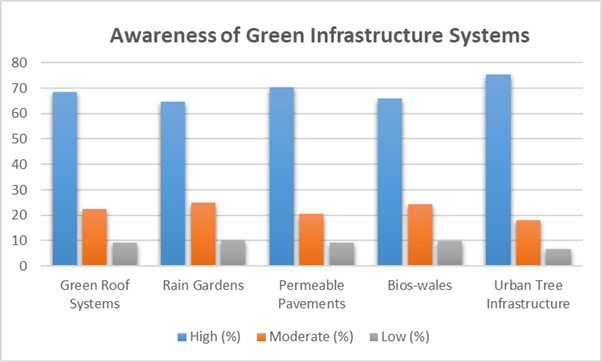
Figure 1. Respondent awareness of six common green infrastructure system types (N = 215). Awareness was self-reported on a three-point scale (high, moderate, low) for green roofs, rain gardens, bioswales, permeable pavements, urban trees, and retention ponds. Bars represent the percentage of respondents in each awareness category for each system type. Urban trees recorded the highest high-awareness rating (75.3%), while bioswales (66.0%) and rain gardens (64.7%) showed somewhat lower familiarity, likely reflecting their finer spatial scale of implementation.

reporting high awareness — a finding that seems intuitive given how long urban tree canopies have been a visible part of city landscapes, regardless of whether they are explicitly framed as "infrastructure" (Pauleit et al., 2021). Permeable pavements followed at 70.2%, and green roofs at 68.4%, both of which have received considerable visibility through demonstration projects and municipal pilot programs over the past decade.

Bioswales (66.0%) and rain gardens (64.7%) registered somewhat lower, though still substantial, awareness. The gap is modest but probably meaningful: these systems tend to operate at finer spatial scales — neighborhood parcels, individual street segments — and are arguably less legible to professionals working outside direct site design. Across all categories, moderate awareness ranged from roughly 18% to 25%, while low-awareness responses stayed under 11% for every system type. Whatever else this sample may not represent, it is not a group unfamiliar with the basic GI toolkit.

3.3 Perceived Effectiveness for Flood Mitigation

When asked to evaluate how well each GI system performs in mitigating urban flooding, respondents were broadly positive, though with meaningful variation among system types (Table 2). Retention ponds drew the strongest endorsement: 64.5% of respondents rated them "very effective," with another 26.0% selecting "effective." Permeable pavements came in second, with 61.7% rating them "very effective" and an additional 28.4% rating them "effective." Rain gardens, bioswales, and green roofs received slightly lower very-effective ratings (58.3%, 55.8%, and 52.1%, respectively) but still attracted strong overall positive evaluations once the "effective" category was added in.

Neutral responses remained under 14% across all five system types, and outright negative ratings were essentially absent. The pattern is consistent with a literature that increasingly favors hybrid or nature-based approaches over purely engineered alternatives, particularly for managing the kind of short-duration, high-intensity storm events that conventional drainage struggles with (Lee et al., 2021). One caveat is worth flagging: these are perceived effectiveness ratings, not measured performance, and a respondent's confidence in a system may reflect exposure to successful installations as much as the system's inherent capacity (Herath et al., 2023).

3.4 Adoption Levels Across Urban Contexts

Adoption patterns showed a clearer gradient across urban typologies than any other variable in the dataset (Figure 2). Major metropolitan regions reported the highest rate of high-level adoption at 72.6%, followed closely by coastal cities at 69.1%. The proximity between these two figures is not surprising; both contexts tend to combine concentrated flood exposure with relatively well-resourced municipal departments and active climate-adaptation agendas (Sánchez & Govindarajulu, 2022).

Suburban areas occupied a middle position at 54.3%, while inland cities reported 49.5%. Small cities recorded the lowest high-adoption rate at 38.7% and, correspondingly, the highest low-adoption rate at 20.8%. The differential between metropolitan and small-city contexts — close to thirty-four percentage points — is striking, and it is consistent with prior observations that smaller and inland municipalities face a compounding mix of constrained budgets, thinner technical staffing, and weaker policy incentives for green alternatives (Song et al., 2022; Liu et al., 2019). What the data cannot tell us, of course, is whether the gap reflects unmet need or simply different priorities given different risk profiles; both are likely contributing.

3.5 Perceived Environmental and Social Benefits

Respondents were generally enthusiastic about the broader benefits of green infrastructure, with most benefit indicators drawing strong agreement (Figure 3). Improved urban livability received the highest endorsement, with 72.5% of respondents in strong agreement. Reduction of urban heat followed at 70.4%, and enhanced water quality at 68.9%. Flood risk reduction itself was endorsed at 66.8%, and support for urban biodiversity at 64.2%.

Across all five benefit indicators, neutral responses sat in a narrow band between roughly 6.9% and 8.8%, suggesting fairly broad consensus rather than a polarized response pattern. The fact that benefits beyond flood control — heat reduction, water quality, biodiversity, livability — drew comparably strong support is worth noting. It implies that practitioners are reading GI as a multifunctional intervention rather than a narrowly hydraulic one, which aligns with the framing increasingly adopted in the urban sustainability literature (Rayan et al., 2022; Belčáková et al., 2019).


Table 2. Respondent-rated effectiveness of five green infrastructure (GI) system types for urban flood mitigation. Ratings were collected on a five-point Likert scale, with the three most populated response categories shown: "very effective," "effective," and "neutral." Values represent the percentage of respondents (N = 215) selecting each rating for each system type. Negative responses ("ineffective" and "very ineffective") accounted for less than 2% across all system types and are not displayed. Higher very-effective percentages indicate stronger perceived performance.

System Type

Very Effective (%)

Effective (%)

Neutral (%)

Green Roofs

52.1

34.0

13.9

Rain Gardens

58.3

30.2

11.5

Permeable Pavements

61.7

28.4

9.9

Bios-wales

55.8

33.1

11.1

Retention Ponds

64.5

26.0

9.5

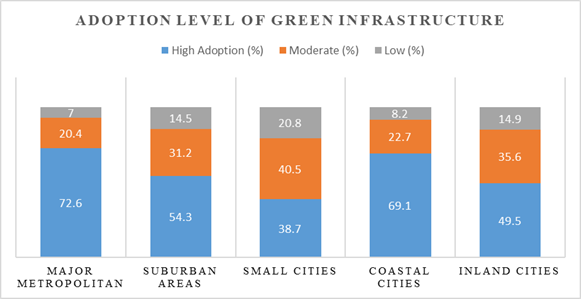
Figure 2. Reported green infrastructure adoption levels across five U.S. urban typologies (N = 215). Respondents classified GI adoption in their primary working context as high, moderate, or low. Urban typologies include major metropolitan regions, coastal cities, suburban areas, inland cities, and small cities. Major metropolitan regions reported the highest high-adoption rate (72.6%), while small cities reported the lowest (38.7%) — a differential of close to thirty-four percentage points that points to a substantial geographic equity gap in GI implementation.

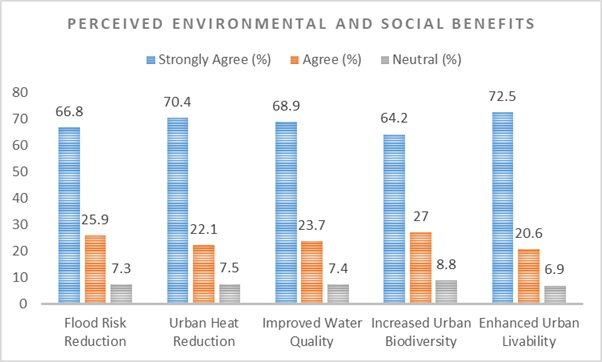
Figure 3. Respondent perceptions of the environmental and social benefits of green infrastructure (N = 215). Agreement with five benefit statements was rated on a five-point Likert scale ranging from "strongly agree" to "strongly disagree." Bars display the percentage of respondents selecting each response category for each benefit indicator: improved urban livability, urban heat reduction, water quality enhancement, flood risk reduction, and support for urban biodiversity. Improved urban livability received the highest strong-agreement rating (72.5%), suggesting that practitioners are interpreting GI as a multifunctional intervention rather than a narrowly hydraulic solution.

Table 3. Pearson correlation results for the six hypothesized associations among study constructs (N = 215). Constructs include Green Infrastructure adoption (GI), Flood Mitigation Response (FMR), Climate Stress Mitigation (CSM), Awareness (AWA), Barrier Index (BRI), and Sustainability Benefit Level (SBL). Coefficients (r) are reported with associated p-values; all six associations reached significance at p < 0.001. Hypotheses are framed as conceptual associations within the study's analytical framework; directional arrows in the "Path Relationship" column reflect the conceptual model rather than statistically confirmed causal pathways.

Hypothesis

Path Relationship

r- value

p-value

Result

H1

NGI → FMR

0.68

<0.001

Supported

H2

NGI → CSM

0.65

<0.001

Supported

H3

AWA → NGI

0.62

<0.001

Supported

H4

BRI → NGI

-0.55

<0.001

Supported (Negative Effect)

H5

FMR → SBL

0.72

<0.001

Strongly Supported

H6

CSM → SBL

0.69

<0.001

Strongly Supported

3.6 Hypothesis Testing: Associations Among Constructs

Pearson correlation analyses examined associations among the six study constructs at a significance threshold of p < 0.001 (Table 3). All six pre-specified associations reached statistical significance.

Green Infrastructure adoption was positively associated with Flood Mitigation Response (r = 0.68) and with Climate Stress Mitigation (r = 0.65), supporting H1 and H2 respectively. Awareness showed a moderately strong positive association with GI adoption (r = 0.62, H3), while the Barrier Index showed a moderately strong negative association (r = −0.55, H4). The two strongest associations in the dataset linked outcome perceptions to overall sustainability benefit: Flood Mitigation Response correlated with Sustainability Benefit Level at r = 0.72 (H5), and Climate Stress Mitigation with Sustainability Benefit Level at r = 0.69 (H6).

A note of interpretive caution belongs here. These coefficients describe associations among perceptual constructs, not measured causal pathways, and the directionality implied in the hypothesis framing (for example, "AWA → GI") should be read as conceptual rather than statistically confirmed (Addabbo et al., 2023). What the pattern does suggest, fairly clearly, is that awareness and barrier perceptions are moving in opposite directions on adoption, and that the perceived flood and climate functions of GI are tracking closely with broader sustainability evaluations.

4. Discussion

4.1 What the Findings Add to the Conversation

This study set out to examine how stakeholders working across a range of American urban settings perceive, use, and struggle with green infrastructure for stormwater management. Taken together, the findings point in a direction that is, on the whole, encouraging — though with enough internal variation to suggest that the GI conversation in the United States is still very much an unsettled one. Awareness of the basic GI toolkit is high, perceived effectiveness is generally favorable, and the associations among awareness, adoption, barriers, and downstream sustainability outcomes broadly support the conceptual framework guiding the analysis. What complicates the picture, and arguably makes it more interesting, is the uneven distribution of adoption across urban contexts and the persistence of barriers even where awareness and conviction are strong.

4.2 Awareness as a Necessary but Insufficient Condition

The high awareness levels documented in Section 3.2 (Figure 1) — particularly the 75.3% high-familiarity rating for urban trees and the 70.2% for permeable pavements — suggest that GI concepts have moved from specialist territory into the working vocabulary of mainstream urban professionals. This is not a trivial development. As recently as a decade ago, much of this terminology would have been unfamiliar outside dedicated research and design circles (Pauleit et al., 2021).

That said, awareness alone does not appear to be carrying the field. The moderately strong correlation between awareness and adoption (r = 0.62, Table 3) confirms that the two travel together, but the coefficient leaves substantial unexplained variance — meaning that other factors, plausibly institutional and financial, are doing real work in shaping whether familiarity translates into installation (Anderson & Gough, 2022). Educational outreach and technical training likely remain valuable, but it would be a mistake to read these findings as endorsing awareness campaigns as a standalone strategy. The data are more consistent with a layered view in which awareness opens the door but does not, on its own, walk anyone through it.

4.3 Perceived Effectiveness and the Hybrid-Solutions Consensus

The effectiveness ratings reported in Section 3.3 (Table 2) line up reasonably well with the direction in which the broader literature has been moving. Retention ponds drew the strongest endorsement (64.5% very effective), followed by permeable pavements (61.7%) — both systems that operate at meaningful spatial scales and that have accumulated visible track records in U.S. municipal projects. The strong association between GI and flood mitigation response (r = 0.68) supports the broader view that nature-based and hybrid approaches function less as substitutes for engineered drainage than as complements to it, absorbing stress that conventional systems alone cannot handle during high-intensity events (White-Newsome & Slay, 2021; Herath et al., 2023).

It is worth noting a limitation built into this finding. These are perceived effectiveness ratings, not hydraulic measurements, and there is no guarantee that practitioner intuitions perfectly track measured performance. Confidence in a system can reflect exposure to successful local installations as much as the system's inherent capacity. Still, the consistency of the pattern across system types and the convergence with prior empirical work give the findings reasonable interpretive weight (Khodadad et al., 2023).

4.4 The Geography of Adoption: A Persistent Equity Concern

The adoption gradient reported in Section 3.4 (Figure 2) is perhaps the most pointed finding in the dataset. Major metropolitan regions reported a 72.6% high-adoption rate, coastal cities followed at 69.1%, and small cities sat at 38.7% — a differential of close to thirty-four percentage points. This pattern is consistent with prior observations that GI uptake correlates with a cluster of factors: urbanization intensity, climate exposure, institutional capacity, and the presence of policy frameworks that actively reward green alternatives (Brom et al., 2023; Sánchez & Govindarajulu, 2022).

The equity implication is uncomfortable but worth stating plainly. Smaller inland municipalities, which often face the same shifting precipitation regimes as their larger neighbors but with thinner technical staffs and tighter capital budgets, appear to be furthest from the GI frontier. The standard policy prescriptions — better funding mechanisms, technical assistance programs, regional cost-sharing arrangements — are familiar, but the data here reinforce the case for treating them as urgent rather than aspirational (Mitchell et al., 2015). One might also note that adoption gaps of this magnitude raise the prospect of a two-tier climate adaptation landscape in the United States, in which some communities accumulate redundancy while others struggle to install even foundational green elements.

4.5 Multifunctional Benefits and the Reframing of "Drainage"

The benefit perception results in Section 3.5 (Figure 3) suggest something quietly significant about how practitioners are interpreting GI's role. Improved urban livability drew the highest agreement (72.5%), followed by urban heat reduction (70.4%) and water quality enhancement (68.9%). Flood risk reduction itself, at 66.8%, was strongly endorsed but not the single dominant benefit. The implication is that respondents are not reading GI primarily through a stormwater lens; they are reading it as a multifunctional intervention that happens to address flooding among other goals (Rayan et al., 2022).

This reframing matters for how the technology is likely to be funded and justified in practice. When GI is positioned solely as a drainage solution, it competes on cost and performance with gray infrastructure under conditions that often favor the latter. When it is positioned as a multifunctional asset delivering cooling, biodiversity, public health, and livability benefits alongside flood control, the cost-benefit calculus shifts (Fenner, 2017). The data here suggest that the multifunctional framing is already well-established in practitioner thinking, which is an encouraging sign for the kinds of multi-benefit valuation frameworks that municipal finance and planning offices are increasingly trying to apply.

4.6 Barriers: What Stands Between Conviction and Installation

Perhaps the most diagnostic finding in the dataset is the moderately strong negative association between perceived barriers and GI adoption (r = −0.55, Table 3). This is, in a sense, the missing piece that the high-awareness and high-effectiveness findings would otherwise leave unexplained. Practitioners largely know what GI is, largely believe it works, and largely value its co-benefits — yet adoption remains uneven, and the barrier index appears to be tracking that unevenness directly (Cheshmehzangi, 2022).

The barriers most commonly identified in the GI literature are familiar ones: capital costs, fragmented policy frameworks, maintenance burden, limited technical capacity, and inter-agency coordination challenges (Bazbauers, 2021; Argyroudis et al., 2021). The present data reinforce the view that these are not residual concerns but central obstacles. It is tempting to focus reform efforts on the most visible barrier — usually cost — but the persistence of multiple barrier types in the literature suggests that single-instrument interventions are unlikely to be sufficient. A more credible approach would likely combine financing reform with technical assistance, regulatory clarification, and coordinated procurement frameworks.

4.7 What the Hypothesis Tests Can and Cannot Tell Us

The six hypothesized associations were all statistically significant at p < 0.001, with effect sizes ranging from moderate to moderately strong (Table 3). The strongest associations linked perceived flood mitigation (r = 0.72) and climate stress mitigation (r = 0.69) to overall sustainability benefit, supporting the broader argument that GI's value to urban systems is best understood in integrated rather than siloed terms (Fohlmeister et al., 2015).

A measure of interpretive restraint belongs here. The analysis describes associations among perceptual constructs, not measured causal pathways, and the directional arrows in the hypothesis framing should be read as conceptual rather than statistically confirmed. With cross-sectional correlational data, alternative orderings of the relationships cannot be ruled out — adoption may shape awareness as much as awareness shapes adoption, for example, and barriers may be both a cause of low adoption and a consequence of inexperience with the technology (Addabbo et al., 2023). What the pattern does establish, fairly clearly, is that the six constructs are moving together in theoretically coherent ways, which provides empirical support for the conceptual framework even if it stops short of confirming its causal architecture.

4.8 Limitations

Several limitations qualify the interpretation of these findings. First, the cross-sectional design captures a single point in time and cannot speak to how perceptions or adoption patterns evolve. Second, recruitment through professional networks introduces a self-selection element; respondents with stronger pre-existing engagement with GI may have been more likely to participate, which could inflate awareness and effectiveness ratings relative to the broader practitioner population. Third, the sample, while reasonably diverse across occupational categories and urban typologies, is not a probability sample of any defined population, and the findings should be read as describing this particular respondent group rather than supporting strict generalization to all U.S. urban professionals. Fourth, all measures are self-reported perceptions; objective measures of GI performance, adoption rates, and barrier impact would strengthen subsequent work considerably. Finally, the correlational nature of the analysis precludes causal inference, as noted above (Lerer et al., 2017).

4.9 Implications for Practice and Policy

The findings carry several practical implications worth flagging. For municipal decision-makers in smaller and inland communities, the data reinforce the case for proactive engagement with state-level and regional GI support programs — the adoption gap relative to larger cities is large enough that catch-up will likely require external support rather than purely local initiative. For state and federal policymakers, the strong association between barriers and adoption suggests that programs targeting cost, technical capacity, and policy clarity simultaneously will likely outperform single-instrument interventions. For the GI research community, the data suggest that perception-based factors deserve continued attention alongside the more dominant technical performance literature, particularly as the field moves toward multi-benefit valuation frameworks. And for educational institutions and professional associations, the data suggest that awareness has reached useful baseline levels but that translating awareness into installed projects requires sustained attention to the institutional infrastructure surrounding implementation (Kim, 2017; Kumareswaran & Jayasinghe, 2023).

5. Conclusion

Green infrastructure appears to have moved past the question of whether it works and into the harder territory of whether it gets built. The professionals surveyed here largely understand the GI toolkit, broadly endorse its effectiveness for flood mitigation, and recognize its co-benefits for urban heat, water quality, and livability. What separates conviction from installation is, for many communities, a familiar cluster of obstacles — cost, policy fragmentation, technical capacity, and inter-agency coordination. The adoption gap between major metropolitan regions and small inland cities is large enough to raise real equity concerns about who gets to adapt and how quickly. Closing that gap will likely require something more layered than awareness campaigns: coordinated funding mechanisms, sustained technical assistance, and policy frameworks that actively reward green alternatives. The work ahead is less about persuasion and more about removing the institutional friction that still stands between practitioners and the projects they would otherwise build.

Author Contributions

N.A. conceptualized the study, designed the methodology, developed the survey instrument, conducted data collection and statistical analysis, interpreted the results, and prepared the original manuscript draft. M.Y.A. (Muhammad Yousuf Almunshi) contributed to study design, data validation, interpretation of findings, critical revision of the manuscript, and overall supervision of the research. Both authors reviewed, approved, and agreed to the final version of the manuscript for publication.

Acknowledgement

The authors would like to express their sincere gratitude to all survey participants and professionals who contributed their time, expertise, and valuable insights to this study on green infrastructure and urban flood management. Their participation was essential to the successful completion of this research.

Competing financial interests

The authors N.A. et al., have no conflict of interest.

References


Addabbo, N., Clemente, M. F., Quesada-Ganuza, L., Khalek, R. A., Labattaglia, F., Nocerino, G., Prall, M., Ruggiero, A., Stoffels, S., Tersigni, E., Verde, S., Visconti, C., & Leone, M. F. (2023). A Framework for Climate Resilient Urban Design: The Case of Porte de Montreuil, Paris. Sustainability, 15(18), 13857. https://doi.org/10.3390/su151813857

Anderson, V., & Gough, W. A. (2022). Enabling Nature-Based Solutions to Build Back Better—An Environmental Regulatory Impact analysis of green infrastructure in Ontario, Canada. Buildings, 12(1), 61. https://doi.org/10.3390/buildings12010061

Argyroudis, S. A., Mitoulis, S. A., Chatzi, E., Baker, J. W., Brilakis, I., Gkoumas, K., Vousdoukas, M., Hynes, W., Carluccio, S., Keou, O., Frangopol, D. M., & Linkov, I. (2021). Digital technologies can enhance climate resilience of critical infrastructure. Climate Risk Management, 35, 100387. https://doi.org/10.1016/j.crm.2021.100387

Bazbauers, A. R. (2021). Sustainable, green, and climate-resilient cities: an analysis of multilateral development banks. Climate and Development, 14(8), 689–704. https://doi.org/10.1080/17565529.2021.1974331

Belcáková, I., Swiader, M., & Bartyna-Zielinska, M. (2019). The green infrastructure in cities as a tool for climate change adaptation and mitigation: Slovakian and Polish experiences. Atmosphere, 10(9), 552. https://doi.org/10.3390/atmos10090552

Brom, P., Engemann, K., Breed, C., Pasgaard, M., Onaolapo, T., & Svenning, J. (2023). A decision support tool for green infrastructure planning in the face of rapid urbanization. Land, 12(2), 415. https://doi.org/10.3390/land12020415

Cheshmehzangi, A. (2022). Green Infrastructure and Urban Sustainability: an editorial. In Urban sustainability (pp. 1–17). https://doi.org/10.1007/978-981-16-9174-4_1

Cousins, J. J. (2018). Remaking stormwater as a resource: Technology, law, and citizenship. Wiley Interdisciplinary Reviews Water, 5(5). https://doi.org/10.1002/wat2.1300

Fenner, R. (2017). Spatial evaluation of multiple benefits to encourage Multi-Functional design of sustainable drainage in Blue-Green Cities. Water, 9(12), 953. https://doi.org/10.3390/w9120953

Fohlmeister, S., Pauleit, S., Coly, A., Touré, H., & Yeshitela, K. (2015). The way forward: Climate Resilient Cities for Africa’s future. In Future city (pp. 369–399). https://doi.org/10.1007/978-3-319-03982-4_12

Haruna, A. I., Oppong, R. A., & Marful, A. B. (2018). Exploring eco-aesthetics for urban green infrastructure development and building resilient cities: A theoretical overview. Cogent Social Sciences, 4(1), 1478492. https://doi.org/10.1080/23311886.2018.1478492

Herath, H. M. M. S. D., Fujino, T., & Senavirathna, M. D. H. J. (2023). A Review of Emerging Scientific Discussions on Green Infrastructure (GI)-Prospects towards Effective Use of Urban Flood Plains. Sustainability, 15(2), 1227. https://doi.org/10.3390/su15021227

Khodadad, M., Aguilar-Barajas, I., & Khan, A. Z. (2023). Green Infrastructure for Urban Flood Resilience: A review of recent literature on bibliometrics, methodologies, and typologies. Water, 15(3), 523. https://doi.org/10.3390/w15030523

Kim, K. (2017). Methods and Techniques for Climate Resilient and Low-Carbon Smart City Planning. In ?The ?urban book series (pp. 177–213). https://doi.org/10.1007/978-3-319-59618-1_4

Kim, K. (2017a). Integrated Planning Approach to Climate Resilient and Low-Carbon Smart Cities: Process and Methods. In ?The ?urban book series (pp. 87–176). https://doi.org/10.1007/978-3-319-59618-1_3

Kumareswaran, K., & Jayasinghe, G. Y. (2023). Green infrastructure and urban climate resilience. https://doi.org/10.1007/978-3-031-37081-6

Lee, H., Song, K., Kim, G., & Chon, J. (2021). Flood-adaptive green infrastructure planning for urban resilience. Landscape and Ecological Engineering, 17(4), 427–437. https://doi.org/10.1007/s11355-021-00458-7

Lerer, S., Righetti, F., Rozario, T., & Mikkelsen, P. (2017). Integrated Hydrological Model-Based assessment of stormwater management scenarios in Copenhagen’s first climate resilient neighbourhood using the three point approach. Water, 9(11), 883. https://doi.org/10.3390/w9110883

Liu, L., Fryd, O., & Zhang, S. (2019). Blue-Green Infrastructure for Sustainable Urban Stormwater Management—Lessons from Six Municipality-Led Pilot Projects in Beijing and Copenhagen. Water, 11(10), 2024. https://doi.org/10.3390/w11102024

Lund, N. S. V., Borup, M., Madsen, H., Mark, O., Arnbjerg-Nielsen, K., & Mikkelsen, P. S. (2019). Integrated stormwater inflow control for sewers and green structures in urban landscapes. Nature Sustainability, 2(11), 1003–1010. https://doi.org/10.1038/s41893-019-0392-1

Mitchell, D., Enemark, S., & Van Der Molen, P. (2015). Climate resilient urban development: Why responsible land governance is important. Land Use Policy, 48, 190–198. https://doi.org/10.1016/j.landusepol.2015.05.026

Pauleit, S., Vasquéz, A., Maruthaveeran, S., Liu, L., & Cilliers, S. S. (2021). Urban green infrastructure in the Global South. In Cities and nature (pp. 107–143). https://doi.org/10.1007/978-3-030-67650-6_5

Puntub, W., & Greiving, S. (2022). Advanced Operationalization Framework for Climate-Resilient Urban Public Health Care Services: Composite Indicators-Based Scenario Assessment of Khon Kaen City, Thailand. International Journal of Environmental Research and Public Health, 19(3), 1283. https://doi.org/10.3390/ijerph19031283

Rayan, M., Gruehn, D., & Khayyam, U. (2022). Frameworks for Urban Green Infrastructure (UGI) Indicators: Expert and Community Outlook toward Green Climate-Resilient Cities in Pakistan. Sustainability, 14(13), 7966. https://doi.org/10.3390/su14137966

Rayan, M., Gruehn, D., & Khayyam, U. (2022b). Planning for Sustainable Green Urbanism: An Empirical Bottom-Up (Community-Led) Perspective on Green Infrastructure (GI) Indicators in Khyber Pakhtunkhwa (KP), Pakistan. International Journal of Environmental Research and Public Health, 19(19), 11844. https://doi.org/10.3390/ijerph191911844

Salam, H. A., Mukherjee, M., Yadav, B. K., Kumar, A., & Rashiq, A. (2025). A Blueprint for Climate-Resilient Urban Flood Drainage Master Planning. In Lecture notes in civil engineering (pp. 329–342). https://doi.org/10.1007/978-981-96-2030-2_17

Sánchez, F. G., & Govindarajulu, D. (2022). Integrating blue-green infrastructure in urban planning for climate adaptation: Lessons from Chennai and Kochi, India. Land Use Policy, 124, 106455. https://doi.org/10.1016/j.landusepol.2022.106455

Song, K., Kim, M., Kang, H., Ham, E., Noh, J., Khim, J. S., & Chon, J. (2022). Stormwater runoff reduction simulation model for urban flood restoration in coastal area. Natural Hazards, 114(3), 2509–2526. https://doi.org/10.1007/s11069-022-05477-7

Srivastav, A. L., Dhyani, R., Ranjan, M., Madhav, S., & Sillanpää, M. (2021). Climate-resilient strategies for sustainable management of water resources and agriculture. Environmental Science and Pollution Research, 28(31), 41576–41595. https://doi.org/10.1007/s11356-021-14332-4

White-Newsome, J. L., & Slay, J. A. (2021). Learning to Lead with Equity: Advancing Climate Resilience Planning to Address Urban Flooding Across Multiple Sectors and Scales. In Strategies for sustainability (pp. 97–116). https://doi.org/10.1007/978-3-030-73939-3_6

Zareba, A., Krzeminska, A., Adynkiewicz-Piragas, M., Widawski, K., Van Der Horst, D., Grijalva, F., & Monreal, R. (2022). Water Oriented City—A ‘5 scales’ system of blue and green infrastructure in sponge cities supporting the retention of the urban fabric. Water, 14(24), 4070. https://doi.org/10.3390/w14244070


Article metrics
View details
0
Downloads
0
Citations
219
Views
📖 Cite article

View Dimensions


View Plumx


View Altmetric


0
Save
0
Citation
219
View
0
Share